Recession or Booming?

The economy is either in recession or booming. This is what the headlines are telling us each week. So, against this muddled stream of seemingly conflicting and contradictory information, we look for signs regarding which way we are headed. Consider the following evidence for the “recession” case and the “boom” case.
Evidence of recession:
- An inverted yield curve,
- Two-quarters of declining gross domestic product, and
- Dismal confidence surveys
Evidence of boom:
- Near half-century low unemployment,
- Sky high property prices and rents,
- Surging corporate profits.
We see the divergence each day in pronouncements by others, too. For example, William Dudley, former New York Federal Reserve President, sees a recession as “virtually inevitable.” Others say recession calls are premature and point to inventory building or technical factors as culprits for worry. Yet, sooner or later, a recession will emerge, or it will not. The market will eventually settle the debate over a 2022 recession. Our job is to observe facts, offer an interpretation of what we see, and prepare accordingly.
Three Stages
We have watched the market adjust in real-time this year as the outlook is assessed and reassessed in light of inflation, rising rates, and growth. We saw three distinct market stages from the post-shutdown recovery. These stages unfolded as follows:
Stage 1 (Mid 2020 – Late 2021): Stimulus and market exuberance drive asset values to records. Market Thematic: The riskiest investments do well.
Stage 2 (Late 2021 – Mid 2022): Stimulus and confidence start to fade, calling into question ultra-high valuations. Market Thematic: Overpriced investments fall as earlier assumptions are called into question.
Stage 3 (Mid 2022 – ????): Worries over inflation, rates, and recession cause a rethink about higher-risk, lower-quality assets. Fear grows that the Federal Reserve’s (Fed’s) aggressive rate hikes will lead to contraction. Market Thematic: Defensive and high-quality stocks outperform cyclical and low-quality stocks.
All Clear?
Now that Friday’s employment report revealed the economy added a whopping 528,000 jobs in July, we might wonder if we are now in the clear. After all, if this is a recession, are we not supposed to be losing instead of adding jobs? All we can say is that the report adds something to the economy’s positive side of the ledger (at least in the short run). We can chalk one up for the “no-recession” camp.
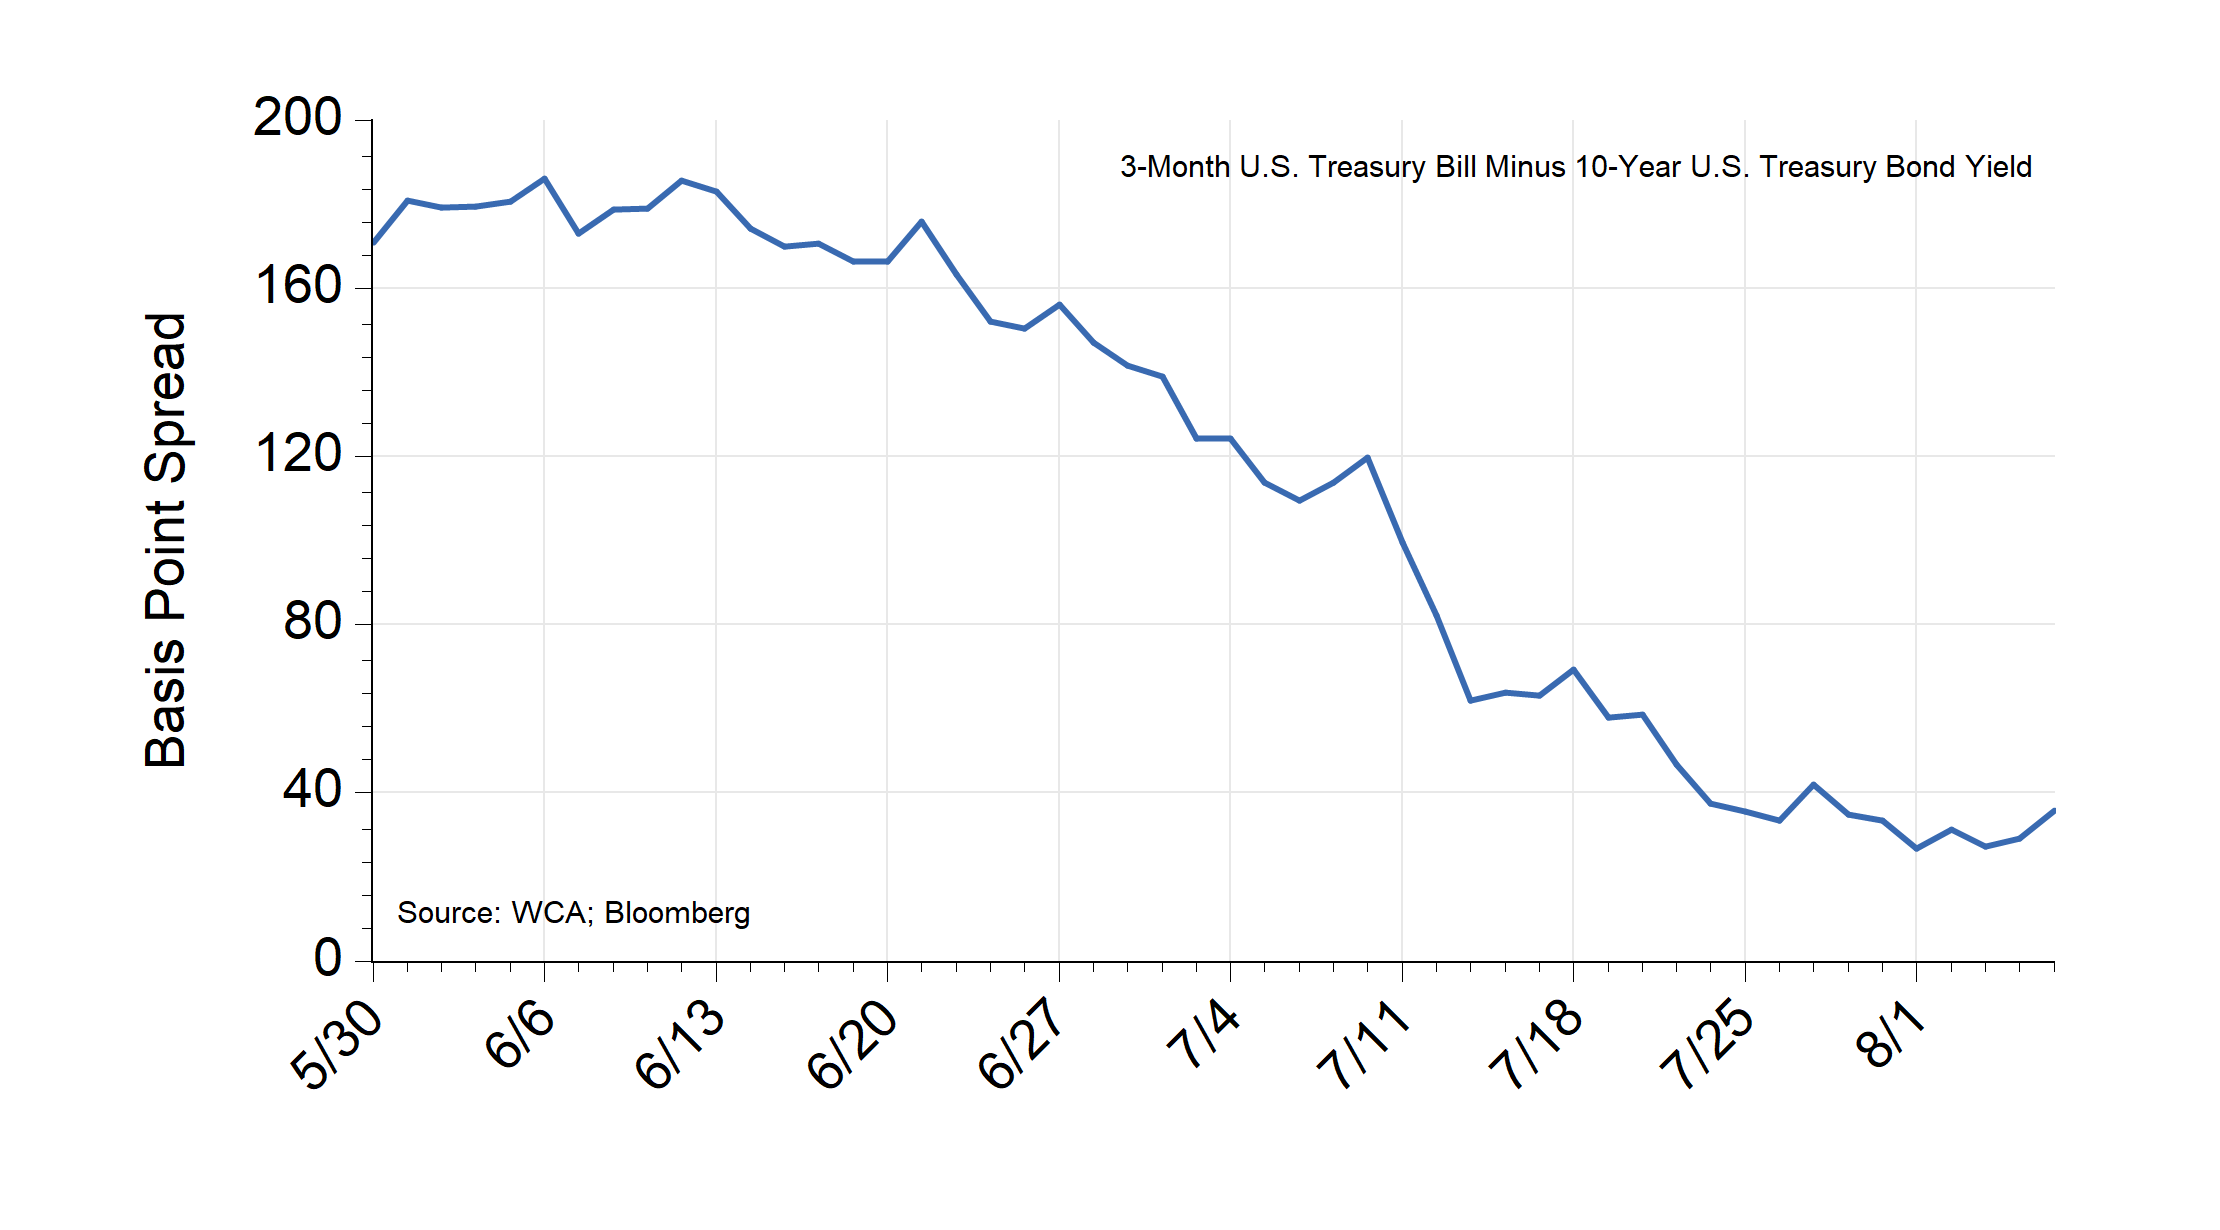
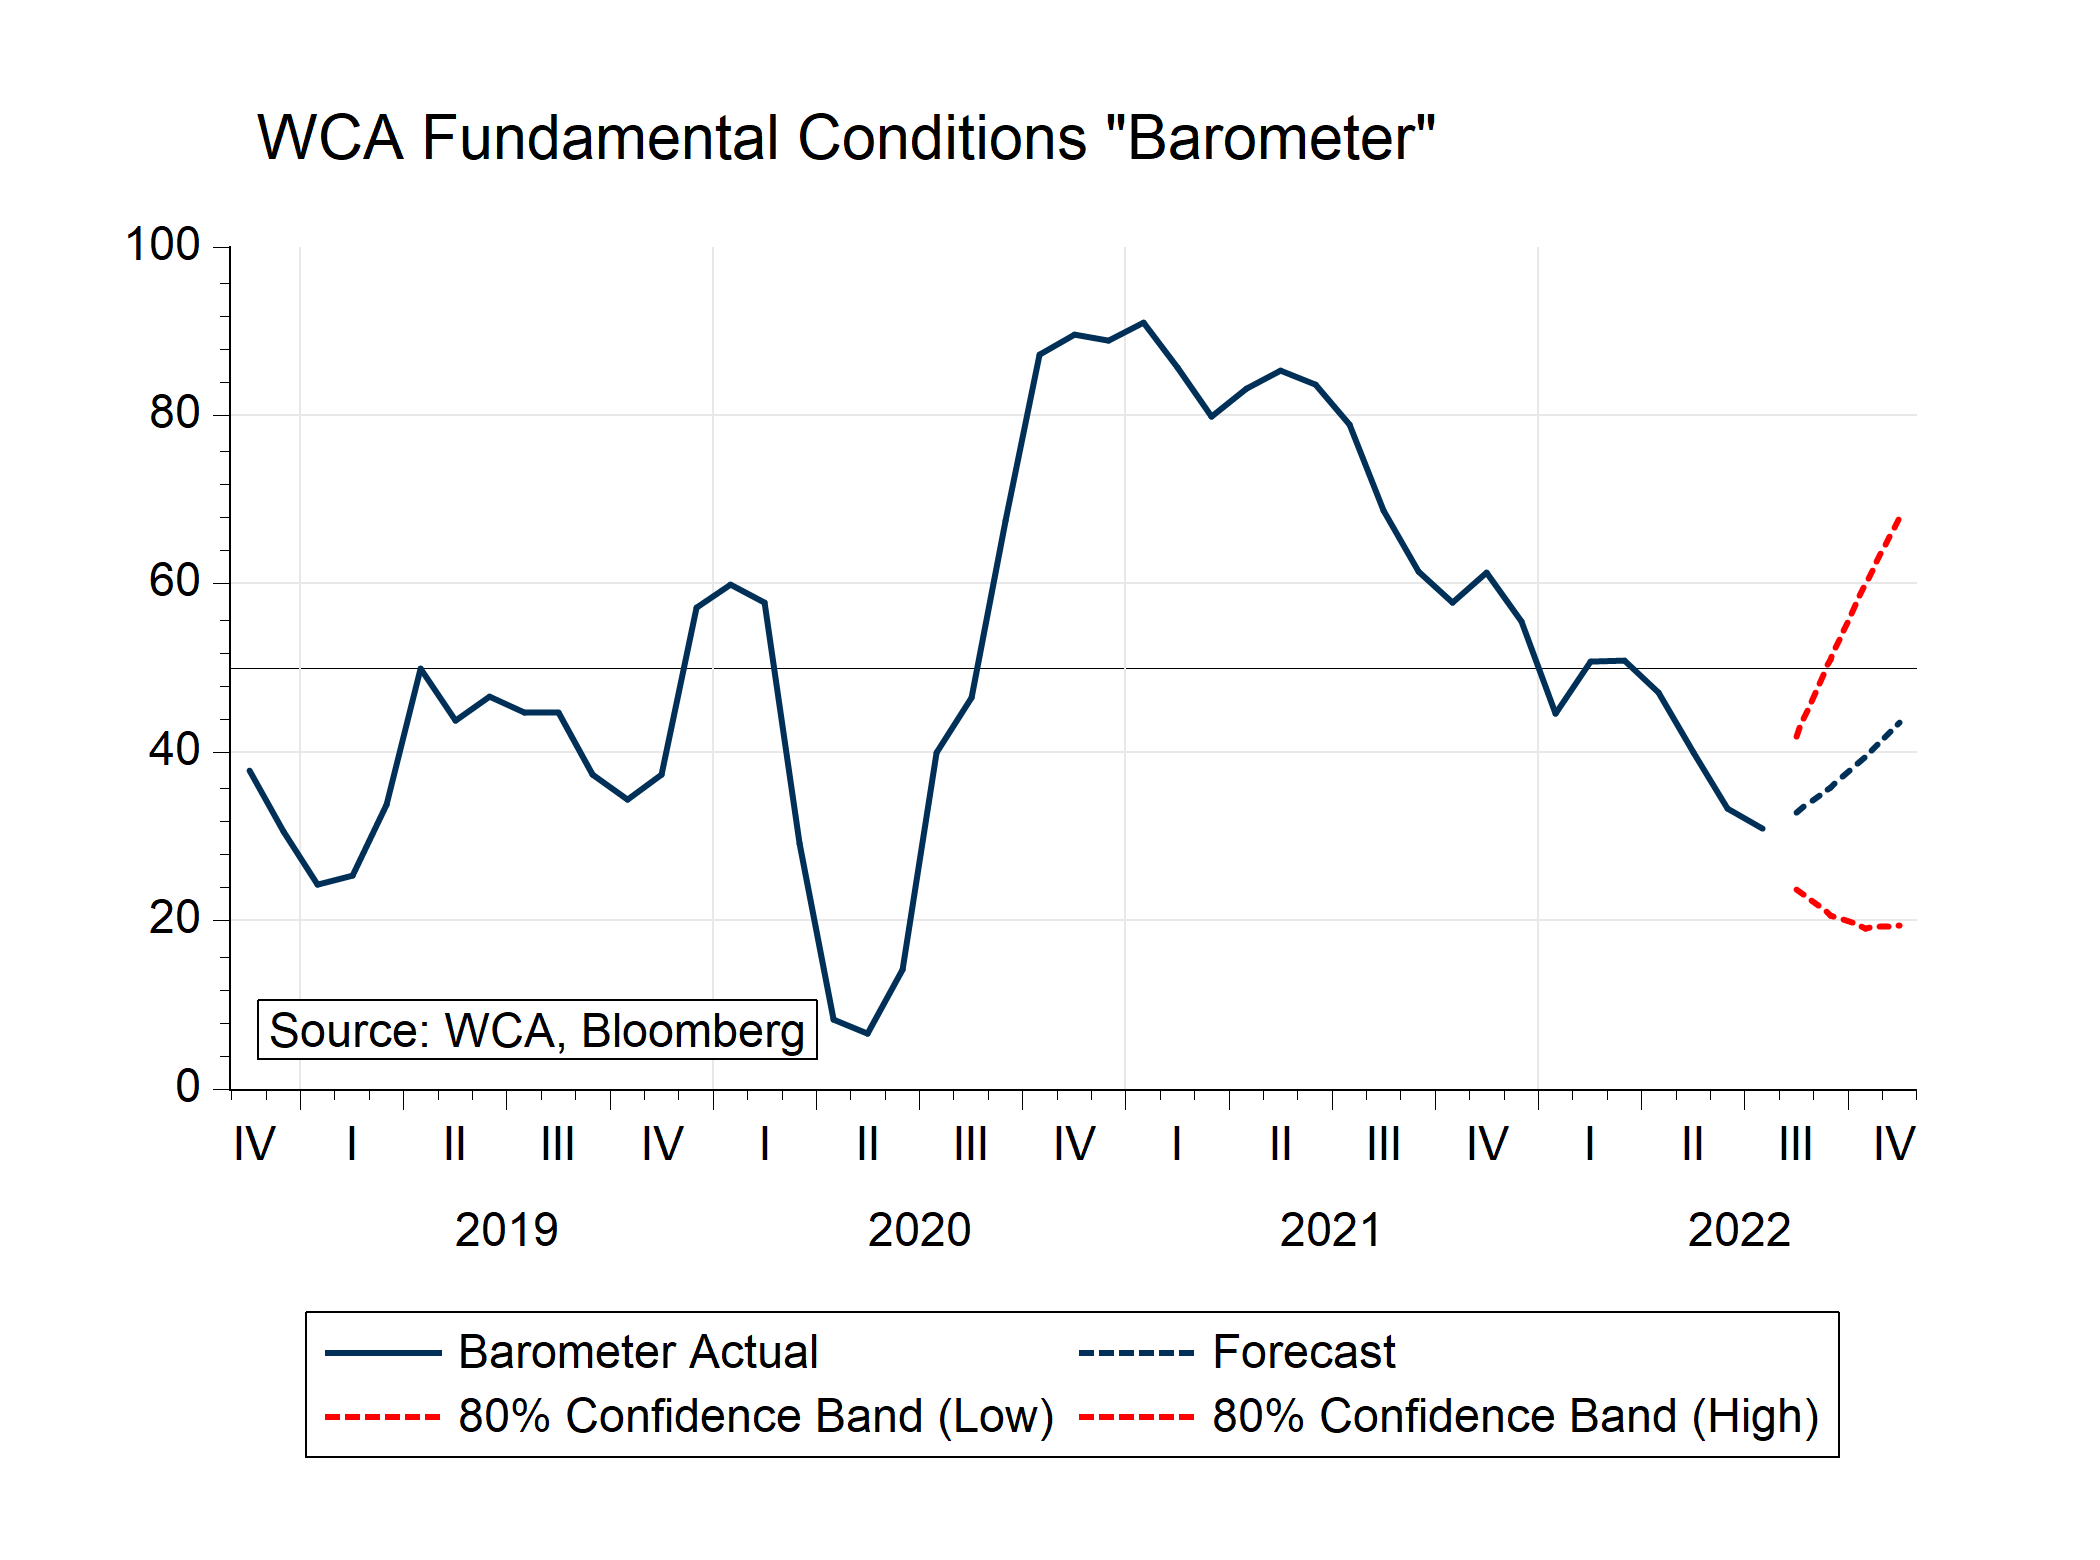
But we cannot let down our guard just yet. Stubborn inflation is forcing the Fed to go hard on rate hikes, and it is well understood that such policy changes hit with a lag. Markets now expect the Fed to boost short-term interest rates to the 3.5-4.0% range within a year from 0% a few months ago. This is the elephant in the room that seems to be most spooking investors as markets hate to “fight the Fed.” So we must take cues from markets themselves since they are forward-looking and can “feed back” into the “real economy.” To that end, we offer three graphs for insight.
Graph 1 (The Yield Curve): Here, we see the bond market pricing in worry about the growth outlook. Since early summer, long-term bond yields have been falling as short-term yields are pushed up (by policy changes). In the past, a flattening yield curve has been a harbinger of weaker growth and recession (inversions).
U.S. Yield Curve Flattens Throughout Summer Months
Graph 2 (“A” Quality vs. “F” Quality Stock Performance): This graph shows that higher-quality stocks are now performing better than low-quality stocks. We would expect this, especially if investors were growing nervous about the outlook. We constructed these indices to award higher quality to high and consistent profitability and low debt. Since early summer, investors have favored these factors over lower-quality, inconsistent, or indebted ones. This shift in leadership arose just as “recession” worries took hold.
WCA “A” vs. “F” Quality Stock Performance
Based on WCA Quality Indices

Graph 3 (WCA Fundamental Conditions Barometer): Regular readers know this is our longstanding measure of near-term conditions. While the recent employment report was positive, and markets are behaving a bit better, the forecast path is still below 50, indicating caution. This month’s slight improvement leads us to pare back the degree of equity exposure under-weighting. This tactical adjustment will be updated month by month as conditions evolve.
Conclusion
To answer the question of whether we are in a recession or if the economy is booming will take a few more months. For now, we see the situation as a mixed bag and an evolutionary process out of the pandemic. We recommend focusing on quality and flexibility in portfolios as the situation remains fluid and uncertain.
WCA Fundamental Conditions Barometer:
We regularly assess changes in fundamental conditions to help guide near-term asset allocation decisions. The analysis incorporates approximately 30 forward-looking indicators in categories ranging from Credit and Capital Markets to U.S. Economic Conditions and Foreign Conditions. From each category of data, we create three diffusion-style sub-indices that measure the trends in the underlying data. Sustained improvement that is spread across a wide variety of observations will produce index readings above 50 (potentially favoring stocks), while readings below 50 would indicate potential deterioration (potentially favoring bonds). The WCA Fundamental Conditions Index combines the three underlying categories into a single summary measure. This measure can be thought of as a “barometer” for changes in fundamental conditions.
Disclosures:
WCA Barometer – We regularly assess changes in fundamental conditions to help guide near-term asset allocation decisions. Analysis incorporates approximately 30 forward-looking indicators in categories ranging from Credit and Capital Markets to U.S. Economic Conditions and Foreign Conditions. From each category of data, we create three diffusion-style sub-indices that measure the trends in the underlying data. Sustained improvement that is spread across a wide variety of observations will produce index readings above 50 (potentially favoring stocks), while readings below 50 would indicate potential deterioration (potentially favoring bonds). The WCA Fundamental Conditions Index combines the three underlying categories into a single summary measure. This measure can be thought of as a “barometer” for changes in fundamental conditions.
Standard & Poor’s 500 Index (S&P 500) is a capitalization-weighted index that is generally considered representative of the U.S. large capitalization market.
The S&P 500® Information Technology comprises those companies included in the S&P 500 that are classified as members of the GICS® information technology sector.
S&P Global (SPGI) is a leading American provider of financial information, analytics, and credit ratings, headquartered in New York, NY. It operates major divisions including S&P Global Ratings, S&P Global Market Intelligence, S&P Global Commodity Insights, S&P Global Mobility, and S&P Dow Jones Indices.
The ICE BofA U.S. High Yield Index is an unmanaged index that tracks the performance of U.S. dollar denominated, below investment-grade rated corporate debt publicly issued in the U.S. domestic market.
The S&P 500 Growth measures constituents from the S&P 500 that are classified as growth stocks based on three factors: sales growth, the ratio of earnings change to price, and momentum.
The S&P 500 Value Index measures constituents from the S&P 500 that are classified as value stocks based on three factors: the ratios of book value, earnings and sales to price.
The S&P 500 Equal Weight Index is the equal-weight version of the widely regarded Standard & Poor’s 500 Index, which is generally considered representative of the U.S. large capitalization market. The index has the same constituents as the capitalization-weighted S&P 500, but each company in the index is allocated a fixed weight of 0.20% at each quarterly rebalancing.
The WCA Rising Dividend Custom Benchmark is a rules-based benchmark constructed by Washington Crossing Advisors to represent a universe of large capitalization U.S. companies that meet certain quality and dividend growth criteria, including proprietary screens for profitability, earnings consistency, and balance sheet strength, along with minimum market capitalization and dividend growth requirements. The benchmark is reconstituted and rebalanced quarterly and is intended to serve as a style-appropriate benchmark for the WCA Rising Dividend strategy.
The Washington Crossing Advisors’ High Quality Index and Low Quality Index are objective, quantitative measures designed to identify quality in the top 1,000 U.S. companies. Ranked by fundamental factors, WCA grades companies from “A” (top quintile) to “F” (bottom quintile). Factors include debt relative to equity, asset profitability, and consistency in performance. Companies with lower debt, higher profitability, and greater consistency earn higher grades. These indices are reconstituted annually and rebalanced daily. For informational purposes only, and WCA Quality Grade indices do not reflect the performance of any WCA investment strategy.
The risk of loss in trading commodities and futures can be substantial. You should therefore carefully consider whether such trading is suitable for you in light of your financial condition. The high degree of leverage that is often obtainable in commodity trading can work against you as well as for you. The use of leverage can lead to large losses as well as gains.
The information contained herein has been prepared from sources believed to be reliable but is not guaranteed by us and is not a complete summary or statement of all available data, nor is it considered an offer to buy or sell any securities referred to herein. Opinions expressed are subject to change without notice and do not take into account the particular investment objectives, financial situation, or needs of individual investors. There is no guarantee that the figures or opinions forecast in this report will be realized or achieved. Employees of Stifel, Nicolaus & Company, Incorporated or its affiliates may, at times, release written or oral commentary, technical analysis, or trading strategies that differ from the opinions expressed within. Past performance is no guarantee of future results. Indices are unmanaged, and you cannot invest directly in an index.
Asset allocation and diversification do not ensure a profit and may not protect against loss. There are special considerations associated with international investing, including the risk of currency fluctuations and political and economic events. Changes in market conditions or a company’s financial condition may impact a company’s ability to continue to pay dividends, and companies may also choose to discontinue dividend payments. Investing in emerging markets may involve greater risk and volatility than investing in more developed countries. Due to their narrow focus, sector-based investments typically exhibit greater volatility. Small-company stocks are typically more volatile and carry additional risks since smaller companies generally are not as well established as larger companies. Property values can fall due to environmental, economic, or other reasons, and changes in interest rates can negatively impact the performance of real estate companies. When investing in bonds, it is important to note that as interest rates rise, bond prices will fall. High-yield bonds have greater credit risk than higher-quality bonds. Bond laddering does not assure a profit or protect against loss in a declining market. The risk of loss in trading commodities and futures can be substantial. You should therefore carefully consider whether such trading is suitable for you in light of your financial condition. The high degree of leverage that is often obtainable in commodity trading can work against you as well as for you. The use of leverage can lead to large losses as well as gains. Changes in market conditions or a company’s financial condition may impact a company’s ability to continue to pay dividends, and companies may also choose to discontinue dividend payments.
All investments involve risk, including loss of principal, and there is no guarantee that investment objectives will be met. It is important to review your investment objectives, risk tolerance, and liquidity needs before choosing an investment style or manager. Equity investments are subject generally to market, market sector, market liquidity, issuer, and investment style risks, among other factors to varying degrees. Fixed Income investments are subject to market, market liquidity, issuer, investment style, interest rate, credit quality, and call risks, among other factors to varying degrees.
Beta is a measure of the volatility, or systematic risk, of a security or a portfolio relative to the market as a whole. A beta of one is considered as risky as the benchmark and is therefore likely to provide expected returns approximate to those of the benchmark during both up and down periods. A portfolio with a beta of two would move approximately twice as much as the benchmark.
Standard deviation is a measure of the volatility of a security’s or portfolio’s returns in relation to the mean return. The larger the standard deviation, the greater the volatility of return in relation to the mean return.
Changes in market conditions or a company’s financial condition may impact a company’s ability to continue to pay dividends, and companies may also choose to discontinue dividend payments
This commentary often expresses opinions about the direction of market, investment sector, and other trends. The opinions should not be considered predictions of future results. The information contained in this report is based on sources believed to be reliable, but is not guaranteed and not necessarily complete.
The securities discussed in this material were selected due to recent changes in the strategies. This selection criterion is not based on any measurement of performance of the underlying security.
Washington Crossing Advisors, LLC is a wholly-owned subsidiary and affiliated SEC Registered Investment Adviser of Stifel Financial Corp (NYSE: SF). Registration with the SEC implies no level of sophistication in investment management.