Great Expectations or Just High Hopes?
The U.S. stock market has been on a tear of late, rising 56% in value, or $18 trillion, in the last year. Two-thirds of the gain came in the six months since October. Surging stock values mirror last spring’s rapid plunge, leaving many feeling elated, unnerved, and anxious. Are expectations for the world ahead justified and fairly factored into stock prices? Or is the bull run reflecting unrealistically high hopes?
A Pretty Penny
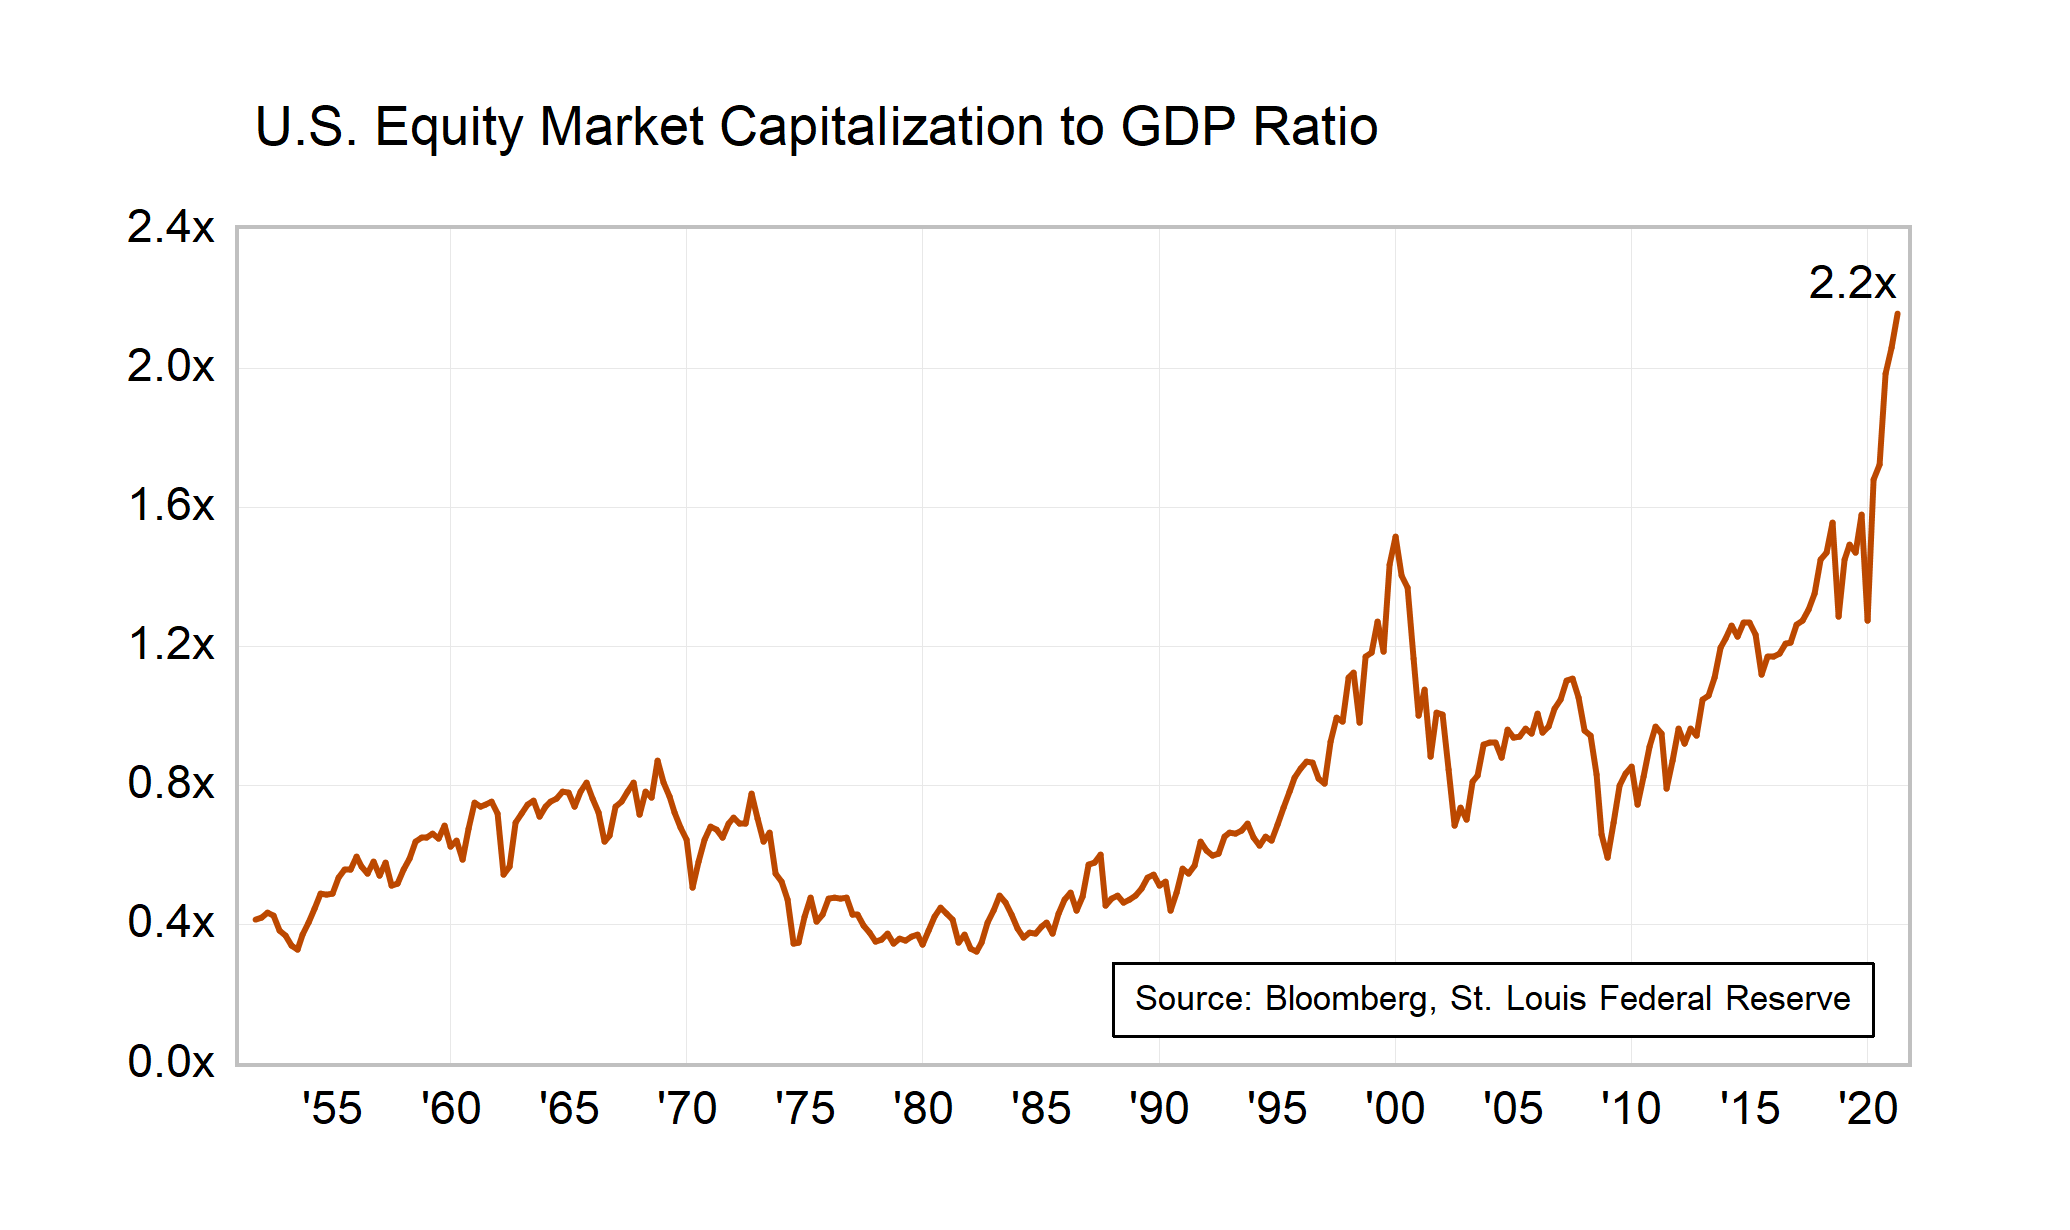
In our view, valuations are full. By most metrics, we see stock values at high levels. Just look at the value of U.S. stocks at $48 trillion compared to our $22 trillion economy (Chart A). At 2.2 times its size, the stock market is more than double the value of the entire economy — a record. This suggests that prices contain a set of bold expectations about the future.
Chart A
Another example that shows how valuations are full is through a simple trend line. Chart B shows the market with a computer-drawn long-term trend line. The solid orange line shows the S&P 500 from 1946 to today. The index now stands near 4,181, above the middle trend line, suggesting an elevated price. For further reference, we’ve had the computer fit high and low trend lines as well. This long perspective indicates the market might be a little on the expensive side.
Chart B

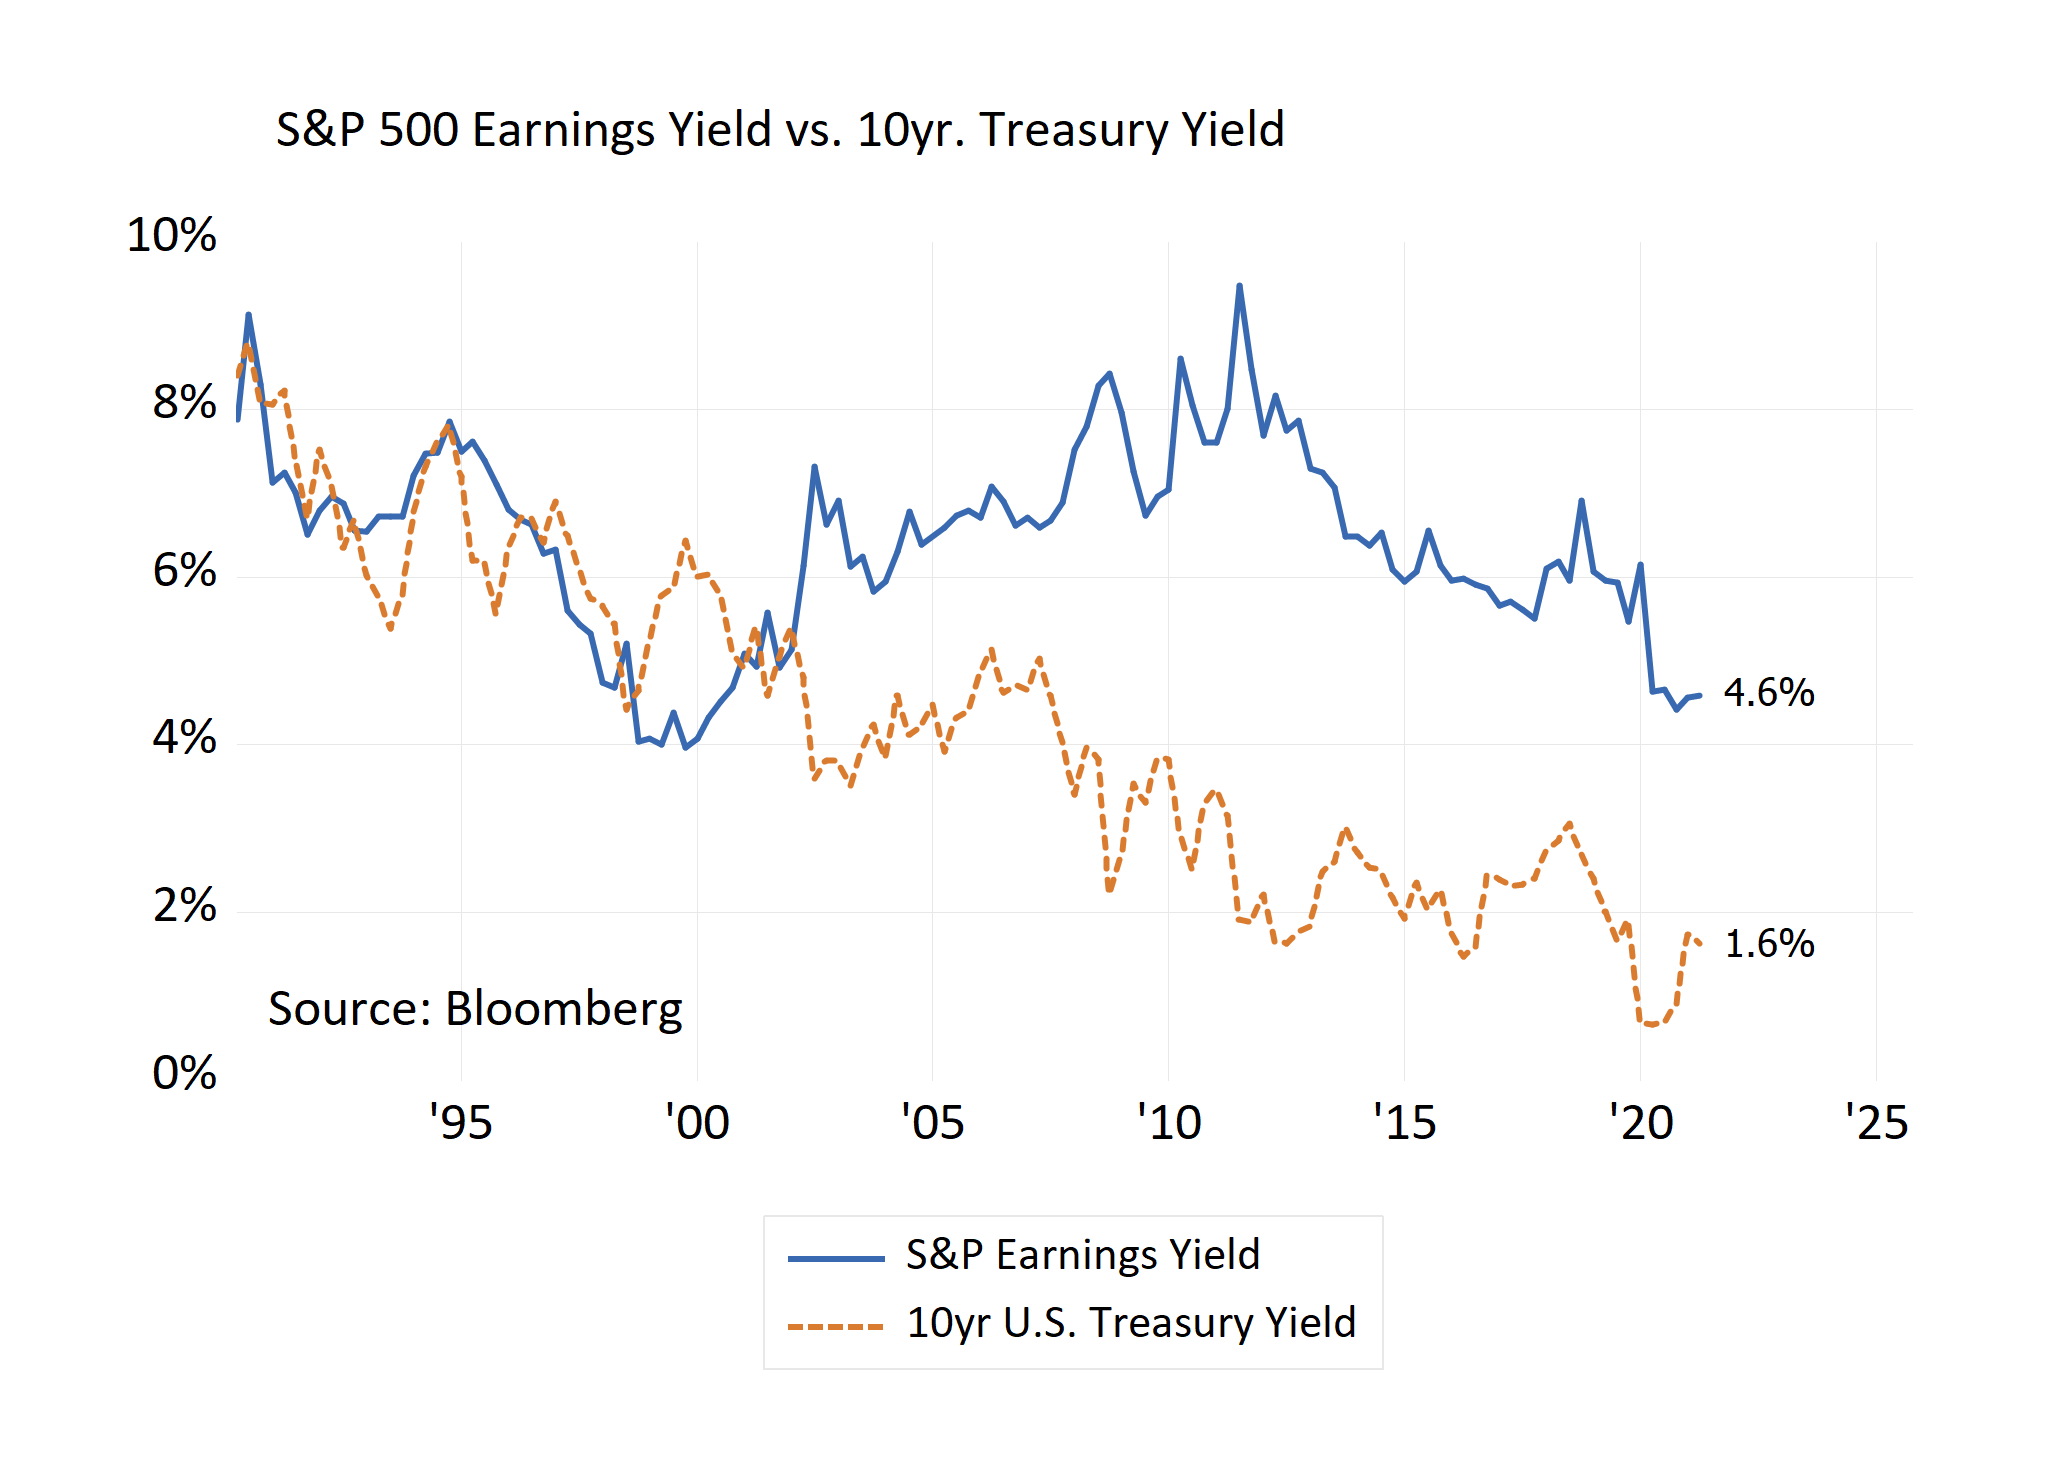
What about comparing stocks to bonds? Chart C below shows the earnings yield on the S&P 500, a proxy for large stocks, in relation to the 10-year U.S. Treasury Bond yield. The earnings yield is a measure of value compared to earnings, calculated as expected earnings divided by price. By this measure, stocks appear to offer a better value than Treasury bonds. The trouble with this perspective is that stocks may still be pricey because bond yields are so low.
Chart C
Reshaping Government
Even though valuations appear full, growth expectations in the near term should continue to ramp up, helped along by a surge in government spending. Consider that the federal government spends roughly $5 trillion yearly. This amounts to about 20-23% of the economy and does not include state or local government spending (Chart D). As recently as 2018, growth in federal spending was near 3%. In 2019 outlays grew 8.3%, and in 2020 they rose 12.5% as the pandemic hit.
Chart D

The Biden administration hopes to continue along this spending path. Nearly $6 trillion of spending has been enacted or proposed since January. The $1.9 trillion American Rescue Plan (ARP), the $2.3 trillion American Jobs Plan (AJP), and the $1.8 trillion American Families Plan (AFP) are the three plans designed to reshape the economy post-COVID-19. If implemented, these plans will accelerate a shift by the government to become a more significant consumer of goods, labor, and services. This shift can add to already pent-up demand from the private sector.
Of course, the Federal Reserve has played a major role in providing liquidity and driving ultra-accommodative monetary policy alongside a historic fiscal impulse. The one-two punch of potent monetary and fiscal policy has had a dramatic impact on the pandemic economy, and will likely have ripple effects (ie. taxation, inflation, interest rate effects) long after the pandemic passes into history.
Pent-Up Demand
The most crucial reason growth should ramp up is because vaccinations can uncork pent-up demand. This is already seen in reports of Americans expecting to return to pre-pandemic life soon. And not only is there an appetite to take vacations, go to restaurants, and get out, but there is cash to fund these activities.
Consider last week’s report on household income and spending (Chart E). The blue line on top shows how total disposable income actually surged during the pandemic. Much of this comes from federal payments and supports to aid with the pandemic. We now see that disposable income, including federal support payments, is $18.2 trillion over the past 12 months. Before the pandemic, this number was $16.4 trillion, for a $1.8 trillion increase.
Chart E

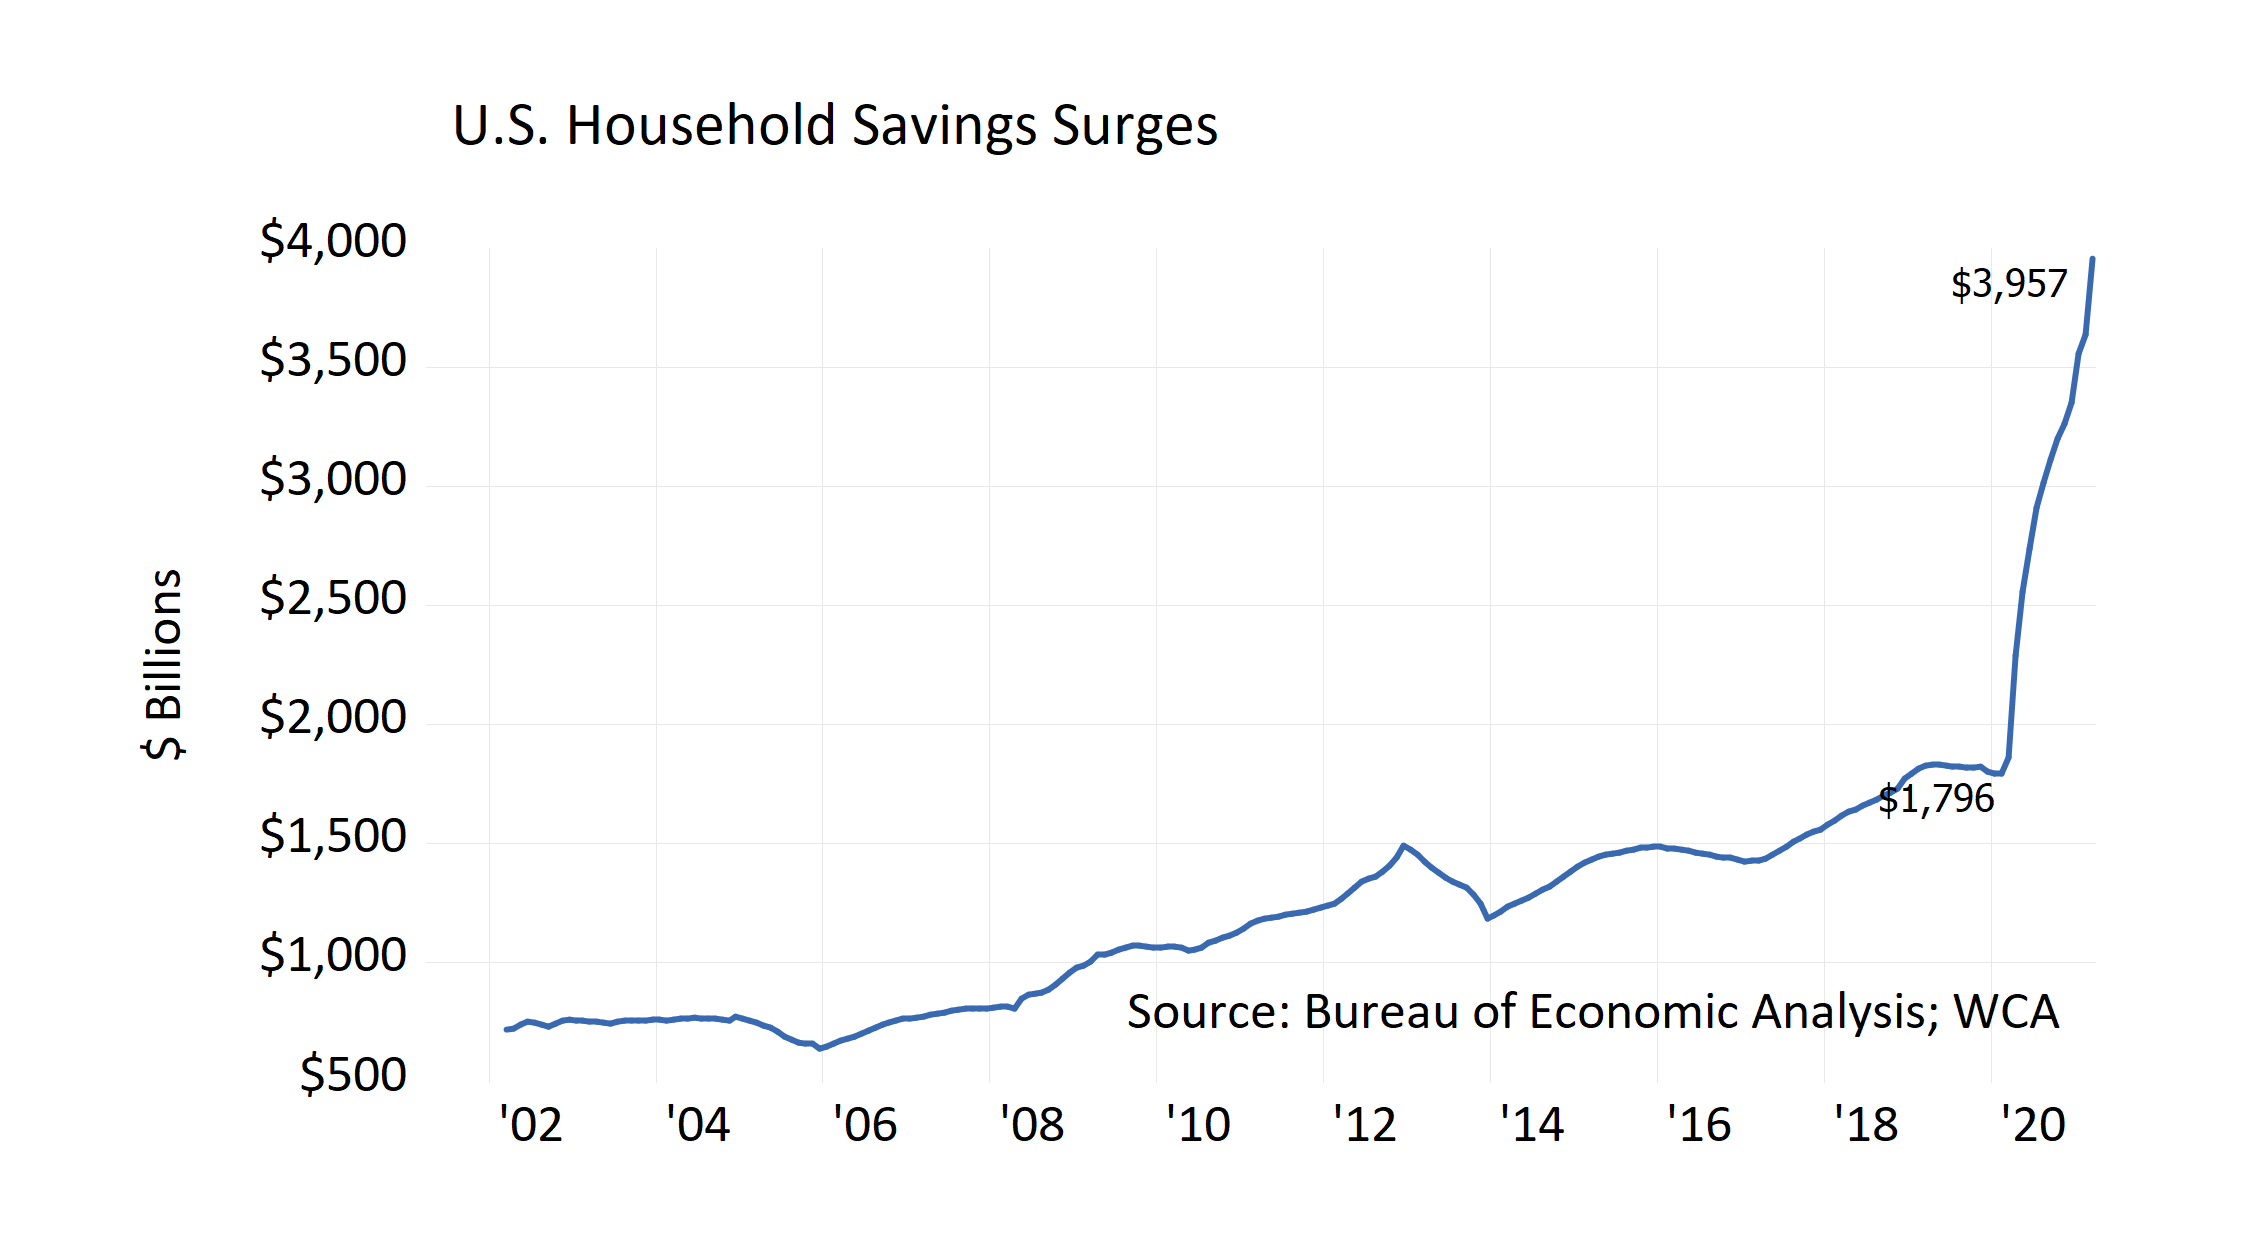
But this is not all. Just as total incomes rose, spending slipped. The rate of total spending declined to $14.3 trillion from $14.7 trillion, for a $400 billion falloff. Because incomes rose $1.8 trillion and spending fell $400 billion, total household savings soared to $2.2 trillion (Chart F). On top of that, rising asset values lifted U.S. household’s net worth $12.1 trillion in 2020, adding to the $12.7 trillion gains of 2019. As vaccinations are rolled out, many Americans are well-positioned to step up spending.
Chart F
Conclusion
So it is clear that while valuations appear full, there is reason to believe that near-term growth expectations should prove very powerful for two reasons. First, government spending is surging. But most importantly, there is enormous pent-up demand (and money to spend) for Americans looking to get out and about.
Is the market right in assuming that the changes at hand will meet lofty expectations? Only time will tell. For now, we must remain realistic about the future and what today’s high prices imply. A focus on flexible, high-quality companies remains especially important, as does a set of reasonable expectations about future returns from today’s starting point.
Disclosures:
WCA Barometer – We regularly assess changes in fundamental conditions to help guide near-term asset allocation decisions. Analysis incorporates approximately 30 forward-looking indicators in categories ranging from Credit and Capital Markets to U.S. Economic Conditions and Foreign Conditions. From each category of data, we create three diffusion-style sub-indices that measure the trends in the underlying data. Sustained improvement that is spread across a wide variety of observations will produce index readings above 50 (potentially favoring stocks), while readings below 50 would indicate potential deterioration (potentially favoring bonds). The WCA Fundamental Conditions Index combines the three underlying categories into a single summary measure. This measure can be thought of as a “barometer” for changes in fundamental conditions.
Standard & Poor’s 500 Index (S&P 500) is a capitalization-weighted index that is generally considered representative of the U.S. large capitalization market.
S&P Global (SPGI) is a leading American provider of financial information, analytics, and credit ratings, headquartered in New York, NY. It operates major divisions including S&P Global Ratings, S&P Global Market Intelligence, S&P Global Commodity Insights, S&P Global Mobility, and S&P Dow Jones Indices.
The ICE BofA U.S. High Yield Index is an unmanaged index that tracks the performance of U.S. dollar denominated, below investment-grade rated corporate debt publicly issued in the U.S. domestic market.
The S&P 500 Growth measures constituents from the S&P 500 that are classified as growth stocks based on three factors: sales growth, the ratio of earnings change to price, and momentum.
The S&P 500 Value Index measures constituents from the S&P 500 that are classified as value stocks based on three factors: the ratios of book value, earnings and sales to price.
The S&P 500 Equal Weight Index is the equal-weight version of the widely regarded Standard & Poor’s 500 Index, which is generally considered representative of the U.S. large capitalization market. The index has the same constituents as the capitalization-weighted S&P 500, but each company in the index is allocated a fixed weight of 0.20% at each quarterly rebalancing.
The WCA Rising Dividend Custom Benchmark is a rules-based benchmark constructed by Washington Crossing Advisors to represent a universe of large capitalization U.S. companies that meet certain quality and dividend growth criteria, including proprietary screens for profitability, earnings consistency, and balance sheet strength, along with minimum market capitalization and dividend growth requirements. The benchmark is reconstituted and rebalanced quarterly and is intended to serve as a style-appropriate benchmark for the WCA Rising Dividend strategy.
The Washington Crossing Advisors’ High Quality Index and Low Quality Index are objective, quantitative measures designed to identify quality in the top 1,000 U.S. companies. Ranked by fundamental factors, WCA grades companies from “A” (top quintile) to “F” (bottom quintile). Factors include debt relative to equity, asset profitability, and consistency in performance. Companies with lower debt, higher profitability, and greater consistency earn higher grades. These indices are reconstituted annually and rebalanced daily. For informational purposes only, and WCA Quality Grade indices do not reflect the performance of any WCA investment strategy.
The risk of loss in trading commodities and futures can be substantial. You should therefore carefully consider whether such trading is suitable for you in light of your financial condition. The high degree of leverage that is often obtainable in commodity trading can work against you as well as for you. The use of leverage can lead to large losses as well as gains.
The information contained herein has been prepared from sources believed to be reliable but is not guaranteed by us and is not a complete summary or statement of all available data, nor is it considered an offer to buy or sell any securities referred to herein. Opinions expressed are subject to change without notice and do not take into account the particular investment objectives, financial situation, or needs of individual investors. There is no guarantee that the figures or opinions forecast in this report will be realized or achieved. Employees of Stifel, Nicolaus & Company, Incorporated or its affiliates may, at times, release written or oral commentary, technical analysis, or trading strategies that differ from the opinions expressed within. Past performance is no guarantee of future results. Indices are unmanaged, and you cannot invest directly in an index.
Asset allocation and diversification do not ensure a profit and may not protect against loss. There are special considerations associated with international investing, including the risk of currency fluctuations and political and economic events. Changes in market conditions or a company’s financial condition may impact a company’s ability to continue to pay dividends, and companies may also choose to discontinue dividend payments. Investing in emerging markets may involve greater risk and volatility than investing in more developed countries. Due to their narrow focus, sector-based investments typically exhibit greater volatility. Small-company stocks are typically more volatile and carry additional risks since smaller companies generally are not as well established as larger companies. Property values can fall due to environmental, economic, or other reasons, and changes in interest rates can negatively impact the performance of real estate companies. When investing in bonds, it is important to note that as interest rates rise, bond prices will fall. High-yield bonds have greater credit risk than higher-quality bonds. Bond laddering does not assure a profit or protect against loss in a declining market. The risk of loss in trading commodities and futures can be substantial. You should therefore carefully consider whether such trading is suitable for you in light of your financial condition. The high degree of leverage that is often obtainable in commodity trading can work against you as well as for you. The use of leverage can lead to large losses as well as gains. Changes in market conditions or a company’s financial condition may impact a company’s ability to continue to pay dividends, and companies may also choose to discontinue dividend payments.
All investments involve risk, including loss of principal, and there is no guarantee that investment objectives will be met. It is important to review your investment objectives, risk tolerance, and liquidity needs before choosing an investment style or manager. Equity investments are subject generally to market, market sector, market liquidity, issuer, and investment style risks, among other factors to varying degrees. Fixed Income investments are subject to market, market liquidity, issuer, investment style, interest rate, credit quality, and call risks, among other factors to varying degrees.
Beta is a measure of the volatility, or systematic risk, of a security or a portfolio relative to the market as a whole. A beta of one is considered as risky as the benchmark and is therefore likely to provide expected returns approximate to those of the benchmark during both up and down periods. A portfolio with a beta of two would move approximately twice as much as the benchmark.
Standard deviation is a measure of the volatility of a security’s or portfolio’s returns in relation to the mean return. The larger the standard deviation, the greater the volatility of return in relation to the mean return.
Changes in market conditions or a company’s financial condition may impact a company’s ability to continue to pay dividends, and companies may also choose to discontinue dividend payments
This commentary often expresses opinions about the direction of market, investment sector, and other trends. The opinions should not be considered predictions of future results. The information contained in this report is based on sources believed to be reliable, but is not guaranteed and not necessarily complete.
The securities discussed in this material were selected due to recent changes in the strategies. This selection criterion is not based on any measurement of performance of the underlying security.
Washington Crossing Advisors, LLC is a wholly-owned subsidiary and affiliated SEC Registered Investment Adviser of Stifel Financial Corp (NYSE: SF). Registration with the SEC implies no level of sophistication in investment management.


