What Will Drive Return?

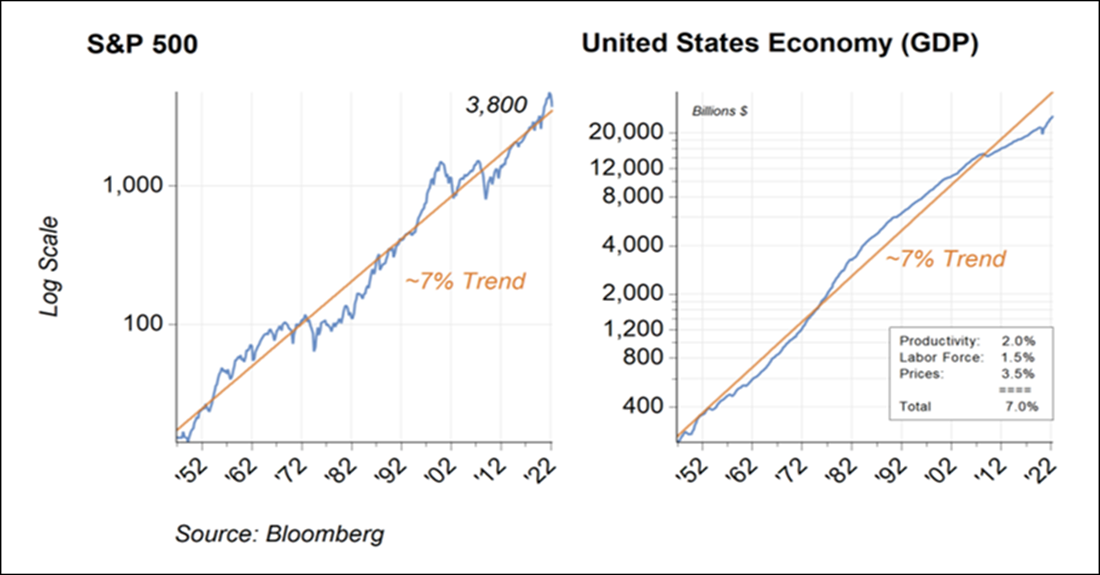
Earnings drive stock prices over time. This simple truth is evident in the past century’s market performance. Over the past 100 years, both the S&P Composite index and S&P Composite index earnings gained about 6-7% per year. The profits, along with the market’s appraisal of the value of those earnings, rose and fell year-to-year. Sometimes, those swings in earnings and valuations were large, creating excitement and anxiety.
What drove the earnings growth? Fortunately, we see an excellent and rational cause for the growth in earnings. As the chart below shows, we can trace growth in stock prices to economic growth (Chart A below). And economic growth is rooted in “real” phenomena like gains in productivity and workforce. We also see that earnings are partly driven by inflation. This last part helps explain why, over time, stocks provide some inflation protection.
Chart A Long View: Stock Market & Economy
Inflation Era
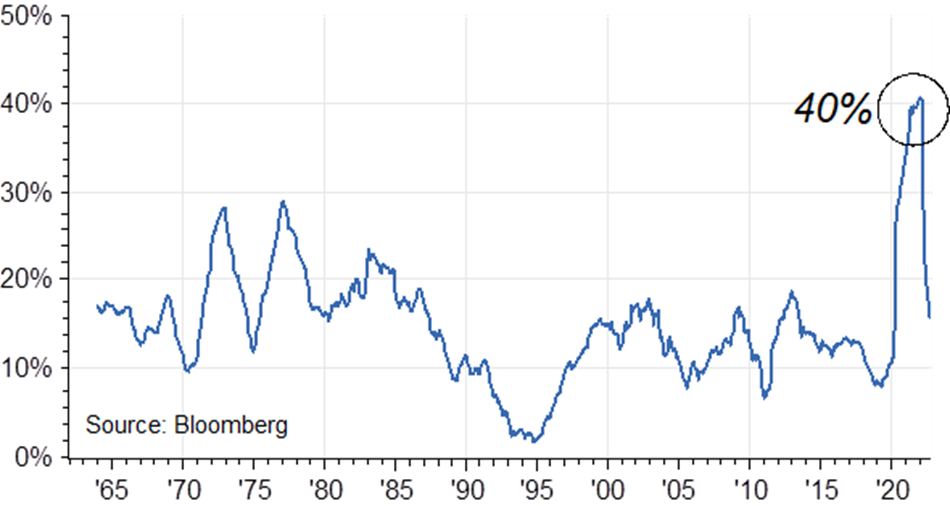
In the two years after the start of the pandemic, the U.S. economy went from bust to boom. After losing 20 million jobs in early 2020, the government undertook policies to inject 40% more money into the economy by the following year (Chart B below). Notice that the increase in money supply is more significant than we saw during the 1970s by a wide margin. However, the surge in money was not matched by a similar rise in the supply of goods and services.
Chart B Money Supply Growth (2-Year Change in M2)
We know this because the economy’s total value is now larger than some estimate the economy should be able to produce. Today, the economy is estimated to be about $25.7 trillion, much larger than the Congressional Budget Office’s (CBO) $25.3 estimate of potential output. This means that the economy, operating about $400 billion above potential, is overheating.
Compounding the issue is recent data on productivity. The Bureau of Labor Statistics productivity estimate shows significant weakness. This data shows productivity (output per hour) declining at a -2.4% rate, the most significant contraction since the 1970s. Another source, the Federal Reserve’s (Fed) staff, recently cited lower productivity as the main reason for reducing their estimate of the economy’s potential output. This cut to the estimate suggests that the Fed needs to tighten more than they did before the adjustment.
A rapid expansion of money against a backdrop of weakening productivity set the stage for inflation. The roots of the inflation problem we are now experiencing are not new. We have seen this movie before.
What’s Happening Now
Since last spring, we are no longer seeing outsized additions to the money stock. Money supply growth has flattened out recently, and some parts of the supply chain are returning. Imports from China, for example, are up about 16% over a year ago. There is some reason, therefore, to expect the inflation curve to start to bend down.
To bring down the growth in the inflation rate, the Fed has been aggressively raising interest rates. When they meet this week, they are widely expected to increase rates by a further 0.75%. We now see the central bank as exercising a “restrictive” monetary policy. As policy tightens, the odds of an outright recession grow.
A favorite early indicator of recession is the “yield curve.” A favorite measure of the changing yield curve is seen below (Chart C below). The graph shows the difference between the 3-month U.S. Treasury bill and the 10-year U.S. Treasury bond. Typically, longer-term rates are higher than shorter-term rates as investors demand greater compensation for taking on the risk of a longer-term investment. Investors would accept lower rates for the greater risk of owning longer-term bonds because they expect the economy to falter. In most cases that bond the bond market made this bet in recent years, recession followed.
Chart C Yield Curve Turns Negative
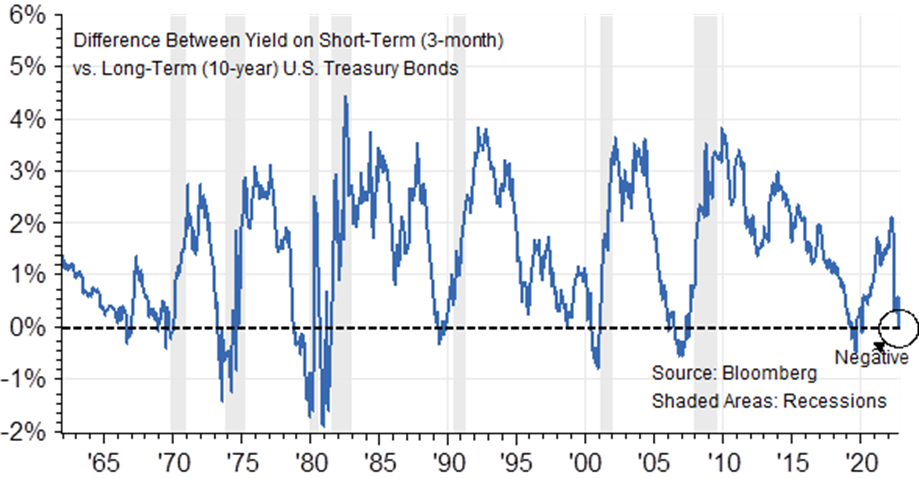
Since the start of the summer, we see that the yield curve is again worried about a recession. Last week, the curve fell below zero, a situation that preceded several previous recessions. Concurrently, we are seeing other signs of a slowdown. The Institute for Supply Management’s Purchasing Manager’s Index (PMI) is dropping. Through October, the index fell to just above 50 from over 60 in 2021. Similarly, the Conference Board’s Leading Economic Index fell each month from March through September.
Changing Leadership
The performance of different types of companies leading the market is also interesting. From mid-2020 through mid-2022, when inflation was on the upswing, lower-quality stocks generally beat high-quality. When inflation was accelerating, low-quality stock returns clearly exceeded high-quality stock returns. Now, we are starting to see an opposite pattern. The market is beginning to favor higher quality (more defensive) stocks over lower quality (riskier) stocks. We define quality based on debt, asset profitability, and profit consistency.
Since early summer, when markets began to focus on recession dynamics, leadership shifted to higher quality. The WCA High Quality index of companies is roughly flat from June through October, while the WCA Low Quality index is down 7%. In our view, this divergence in quality performance is consistent with evolving data trends and market perception of risks.
What’s Next
We cannot know for sure what comes next. The cycle is evolving rapidly from a focus on inflation and an overheating economy to a concern about weakness. S&P 500 earnings forecasts are up about 7% from a year ago, but that growth is falling fast. For several months, the growth rate has been declining by about 1-2% per month. If the economic outlook continues to darken, earnings growth continues to slip, and interest rates continue to press higher, the bullish case for stocks will be tougher to make.
Ultimately, we expect the current problems to resolve and give way to growth and positive returns, as we have seen in the past. Whether that turning point arrives soon or further off, we continue to recommend a focus on high-quality companies. If it turns out that inflation fades, the recession is avoided, and markets rally, we see no reason why higher-quality companies would not participate in a rally. On the other hand, if troubles continue or deepen from here, the market is likely to look for durable, flexible, and predictable companies.
Disclosures:
WCA Barometer – We regularly assess changes in fundamental conditions to help guide near-term asset allocation decisions. Analysis incorporates approximately 30 forward-looking indicators in categories ranging from Credit and Capital Markets to U.S. Economic Conditions and Foreign Conditions. From each category of data, we create three diffusion-style sub-indices that measure the trends in the underlying data. Sustained improvement that is spread across a wide variety of observations will produce index readings above 50 (potentially favoring stocks), while readings below 50 would indicate potential deterioration (potentially favoring bonds). The WCA Fundamental Conditions Index combines the three underlying categories into a single summary measure. This measure can be thought of as a “barometer” for changes in fundamental conditions.
Standard & Poor’s 500 Index (S&P 500) is a capitalization-weighted index that is generally considered representative of the U.S. large capitalization market.
S&P Global (SPGI) is a leading American provider of financial information, analytics, and credit ratings, headquartered in New York, NY. It operates major divisions including S&P Global Ratings, S&P Global Market Intelligence, S&P Global Commodity Insights, S&P Global Mobility, and S&P Dow Jones Indices.
The ICE BofA U.S. High Yield Index is an unmanaged index that tracks the performance of U.S. dollar denominated, below investment-grade rated corporate debt publicly issued in the U.S. domestic market.
The S&P 500 Growth measures constituents from the S&P 500 that are classified as growth stocks based on three factors: sales growth, the ratio of earnings change to price, and momentum.
The S&P 500 Value Index measures constituents from the S&P 500 that are classified as value stocks based on three factors: the ratios of book value, earnings and sales to price.
The S&P 500 Equal Weight Index is the equal-weight version of the widely regarded Standard & Poor’s 500 Index, which is generally considered representative of the U.S. large capitalization market. The index has the same constituents as the capitalization-weighted S&P 500, but each company in the index is allocated a fixed weight of 0.20% at each quarterly rebalancing.
The WCA Rising Dividend Custom Benchmark is a rules-based benchmark constructed by Washington Crossing Advisors to represent a universe of large capitalization U.S. companies that meet certain quality and dividend growth criteria, including proprietary screens for profitability, earnings consistency, and balance sheet strength, along with minimum market capitalization and dividend growth requirements. The benchmark is reconstituted and rebalanced quarterly and is intended to serve as a style-appropriate benchmark for the WCA Rising Dividend strategy.
The Washington Crossing Advisors’ High Quality Index and Low Quality Index are objective, quantitative measures designed to identify quality in the top 1,000 U.S. companies. Ranked by fundamental factors, WCA grades companies from “A” (top quintile) to “F” (bottom quintile). Factors include debt relative to equity, asset profitability, and consistency in performance. Companies with lower debt, higher profitability, and greater consistency earn higher grades. These indices are reconstituted annually and rebalanced daily. For informational purposes only, and WCA Quality Grade indices do not reflect the performance of any WCA investment strategy.
The risk of loss in trading commodities and futures can be substantial. You should therefore carefully consider whether such trading is suitable for you in light of your financial condition. The high degree of leverage that is often obtainable in commodity trading can work against you as well as for you. The use of leverage can lead to large losses as well as gains.
The information contained herein has been prepared from sources believed to be reliable but is not guaranteed by us and is not a complete summary or statement of all available data, nor is it considered an offer to buy or sell any securities referred to herein. Opinions expressed are subject to change without notice and do not take into account the particular investment objectives, financial situation, or needs of individual investors. There is no guarantee that the figures or opinions forecast in this report will be realized or achieved. Employees of Stifel, Nicolaus & Company, Incorporated or its affiliates may, at times, release written or oral commentary, technical analysis, or trading strategies that differ from the opinions expressed within. Past performance is no guarantee of future results. Indices are unmanaged, and you cannot invest directly in an index.
Asset allocation and diversification do not ensure a profit and may not protect against loss. There are special considerations associated with international investing, including the risk of currency fluctuations and political and economic events. Changes in market conditions or a company’s financial condition may impact a company’s ability to continue to pay dividends, and companies may also choose to discontinue dividend payments. Investing in emerging markets may involve greater risk and volatility than investing in more developed countries. Due to their narrow focus, sector-based investments typically exhibit greater volatility. Small-company stocks are typically more volatile and carry additional risks since smaller companies generally are not as well established as larger companies. Property values can fall due to environmental, economic, or other reasons, and changes in interest rates can negatively impact the performance of real estate companies. When investing in bonds, it is important to note that as interest rates rise, bond prices will fall. High-yield bonds have greater credit risk than higher-quality bonds. Bond laddering does not assure a profit or protect against loss in a declining market. The risk of loss in trading commodities and futures can be substantial. You should therefore carefully consider whether such trading is suitable for you in light of your financial condition. The high degree of leverage that is often obtainable in commodity trading can work against you as well as for you. The use of leverage can lead to large losses as well as gains. Changes in market conditions or a company’s financial condition may impact a company’s ability to continue to pay dividends, and companies may also choose to discontinue dividend payments.
All investments involve risk, including loss of principal, and there is no guarantee that investment objectives will be met. It is important to review your investment objectives, risk tolerance, and liquidity needs before choosing an investment style or manager. Equity investments are subject generally to market, market sector, market liquidity, issuer, and investment style risks, among other factors to varying degrees. Fixed Income investments are subject to market, market liquidity, issuer, investment style, interest rate, credit quality, and call risks, among other factors to varying degrees.
Beta is a measure of the volatility, or systematic risk, of a security or a portfolio relative to the market as a whole. A beta of one is considered as risky as the benchmark and is therefore likely to provide expected returns approximate to those of the benchmark during both up and down periods. A portfolio with a beta of two would move approximately twice as much as the benchmark.
Standard deviation is a measure of the volatility of a security’s or portfolio’s returns in relation to the mean return. The larger the standard deviation, the greater the volatility of return in relation to the mean return.
Changes in market conditions or a company’s financial condition may impact a company’s ability to continue to pay dividends, and companies may also choose to discontinue dividend payments
This commentary often expresses opinions about the direction of market, investment sector, and other trends. The opinions should not be considered predictions of future results. The information contained in this report is based on sources believed to be reliable, but is not guaranteed and not necessarily complete.
The securities discussed in this material were selected due to recent changes in the strategies. This selection criterion is not based on any measurement of performance of the underlying security.
Washington Crossing Advisors, LLC is a wholly-owned subsidiary and affiliated SEC Registered Investment Adviser of Stifel Financial Corp (NYSE: SF). Registration with the SEC implies no level of sophistication in investment management.


