What Matters Most
Growth matters more than any other contributor to return for stock investors. Although this may seem strange to say for a “value” manager like us, it is an undeniable fact. We know this because, in the fullness of time, economic growth is the primary driver of profits which, in turn, drive long-run stock values. The faster the potential growth rate for an economy, the faster the potential growth rate for-profits, and the greater the potential return for the stock market. So, we feel compelled to remember the dominant role of economic growth in shaping the long-run outlook for stocks.
To put a finer point on this, we can decompose the return of a stock market into four parts:
1) growth in sales;
2) growth in profit margins;
3) growth in the multiple investors pay for those profits;
4) dividends received
The first three of the above points are limited over time. Sales cannot grow faster than the economy forever, else corporate sales will eventually exceed the size of the whole economy. Profits cannot rise more quickly than sales forever; otherwise, workers’ wages would decrease toward zero. Nor can stock valuations rise without limit, because investors will not pay ever more irrational prices for a unit of future earnings. Equally important, we know sales, margins, and multiples cannot contract ceaselessly for reasons opposite those just mentioned.
Carrying this logic further, we find sales and dividend growth (by extension economic growth) are the things that overwhelmingly matter most to long-run equity market returns. While margins and valuations can matter over short horizons, growth in either tends toward zero over the long-term, making them less important in the end. Yet, given the tendency for large year-to-year swings in margins and valuations, they can have an outsized influence on short-term returns.
The Evidence (1991-2021)
The past 30 years delivered strong returns to stock investors, and the table below decomposes the source of the returns (Table A). From the third quarter of 1991 through the third quarter of 2021, the price of the S&P 500 rose at an 8.5% annualized rate. If we add dividends, the total return increases 10.6%, implying a 1.9% dividend return. Of the 8.5% return, we attribute 3.7% sales growth; 3.7% to margin expansion; and 0.9% to raising multiples. We also see the “pieces” of the return are very different in terms of volatility and predictability. While sales growth tends to have low volatility (more durable), margins and multiples have very high volatility (more fickle). Volatility can be clearly seen in the final column of the table below.
Table A
Decomposing 30 Years of S&P 500 Returns
(Third Quarter 1991 – Third Quarter 2021)
| 1991Q3 | 2021Q3 | Annual Return (Growth) | Volatility (Standard Deviation) | |
|---|---|---|---|---|
| Sales | 481.1 | 1,444.6 | 3.7% | 1.6% |
| Profit Margin | 3.8% | 11.1% | 3.7% | 22.3% |
| Multiple (Price/Earnings) | 21.2x | 27.6x | 0.9% | 22.5% |
| ===== | ||||
| S&P 500 Price Return | 385 | 4,421 | 8.5% | |
| Plus: Dividend Return | 1.9% | |||
| ===== | ||||
| Equals: Total Return | 10.6% |
Source: WCA; Bloomberg
1. Volatility is annualized standard deviation, a measure of the amount of variation or dispersion of a set of values. A lower standard deviation indicates lower observed volatility.
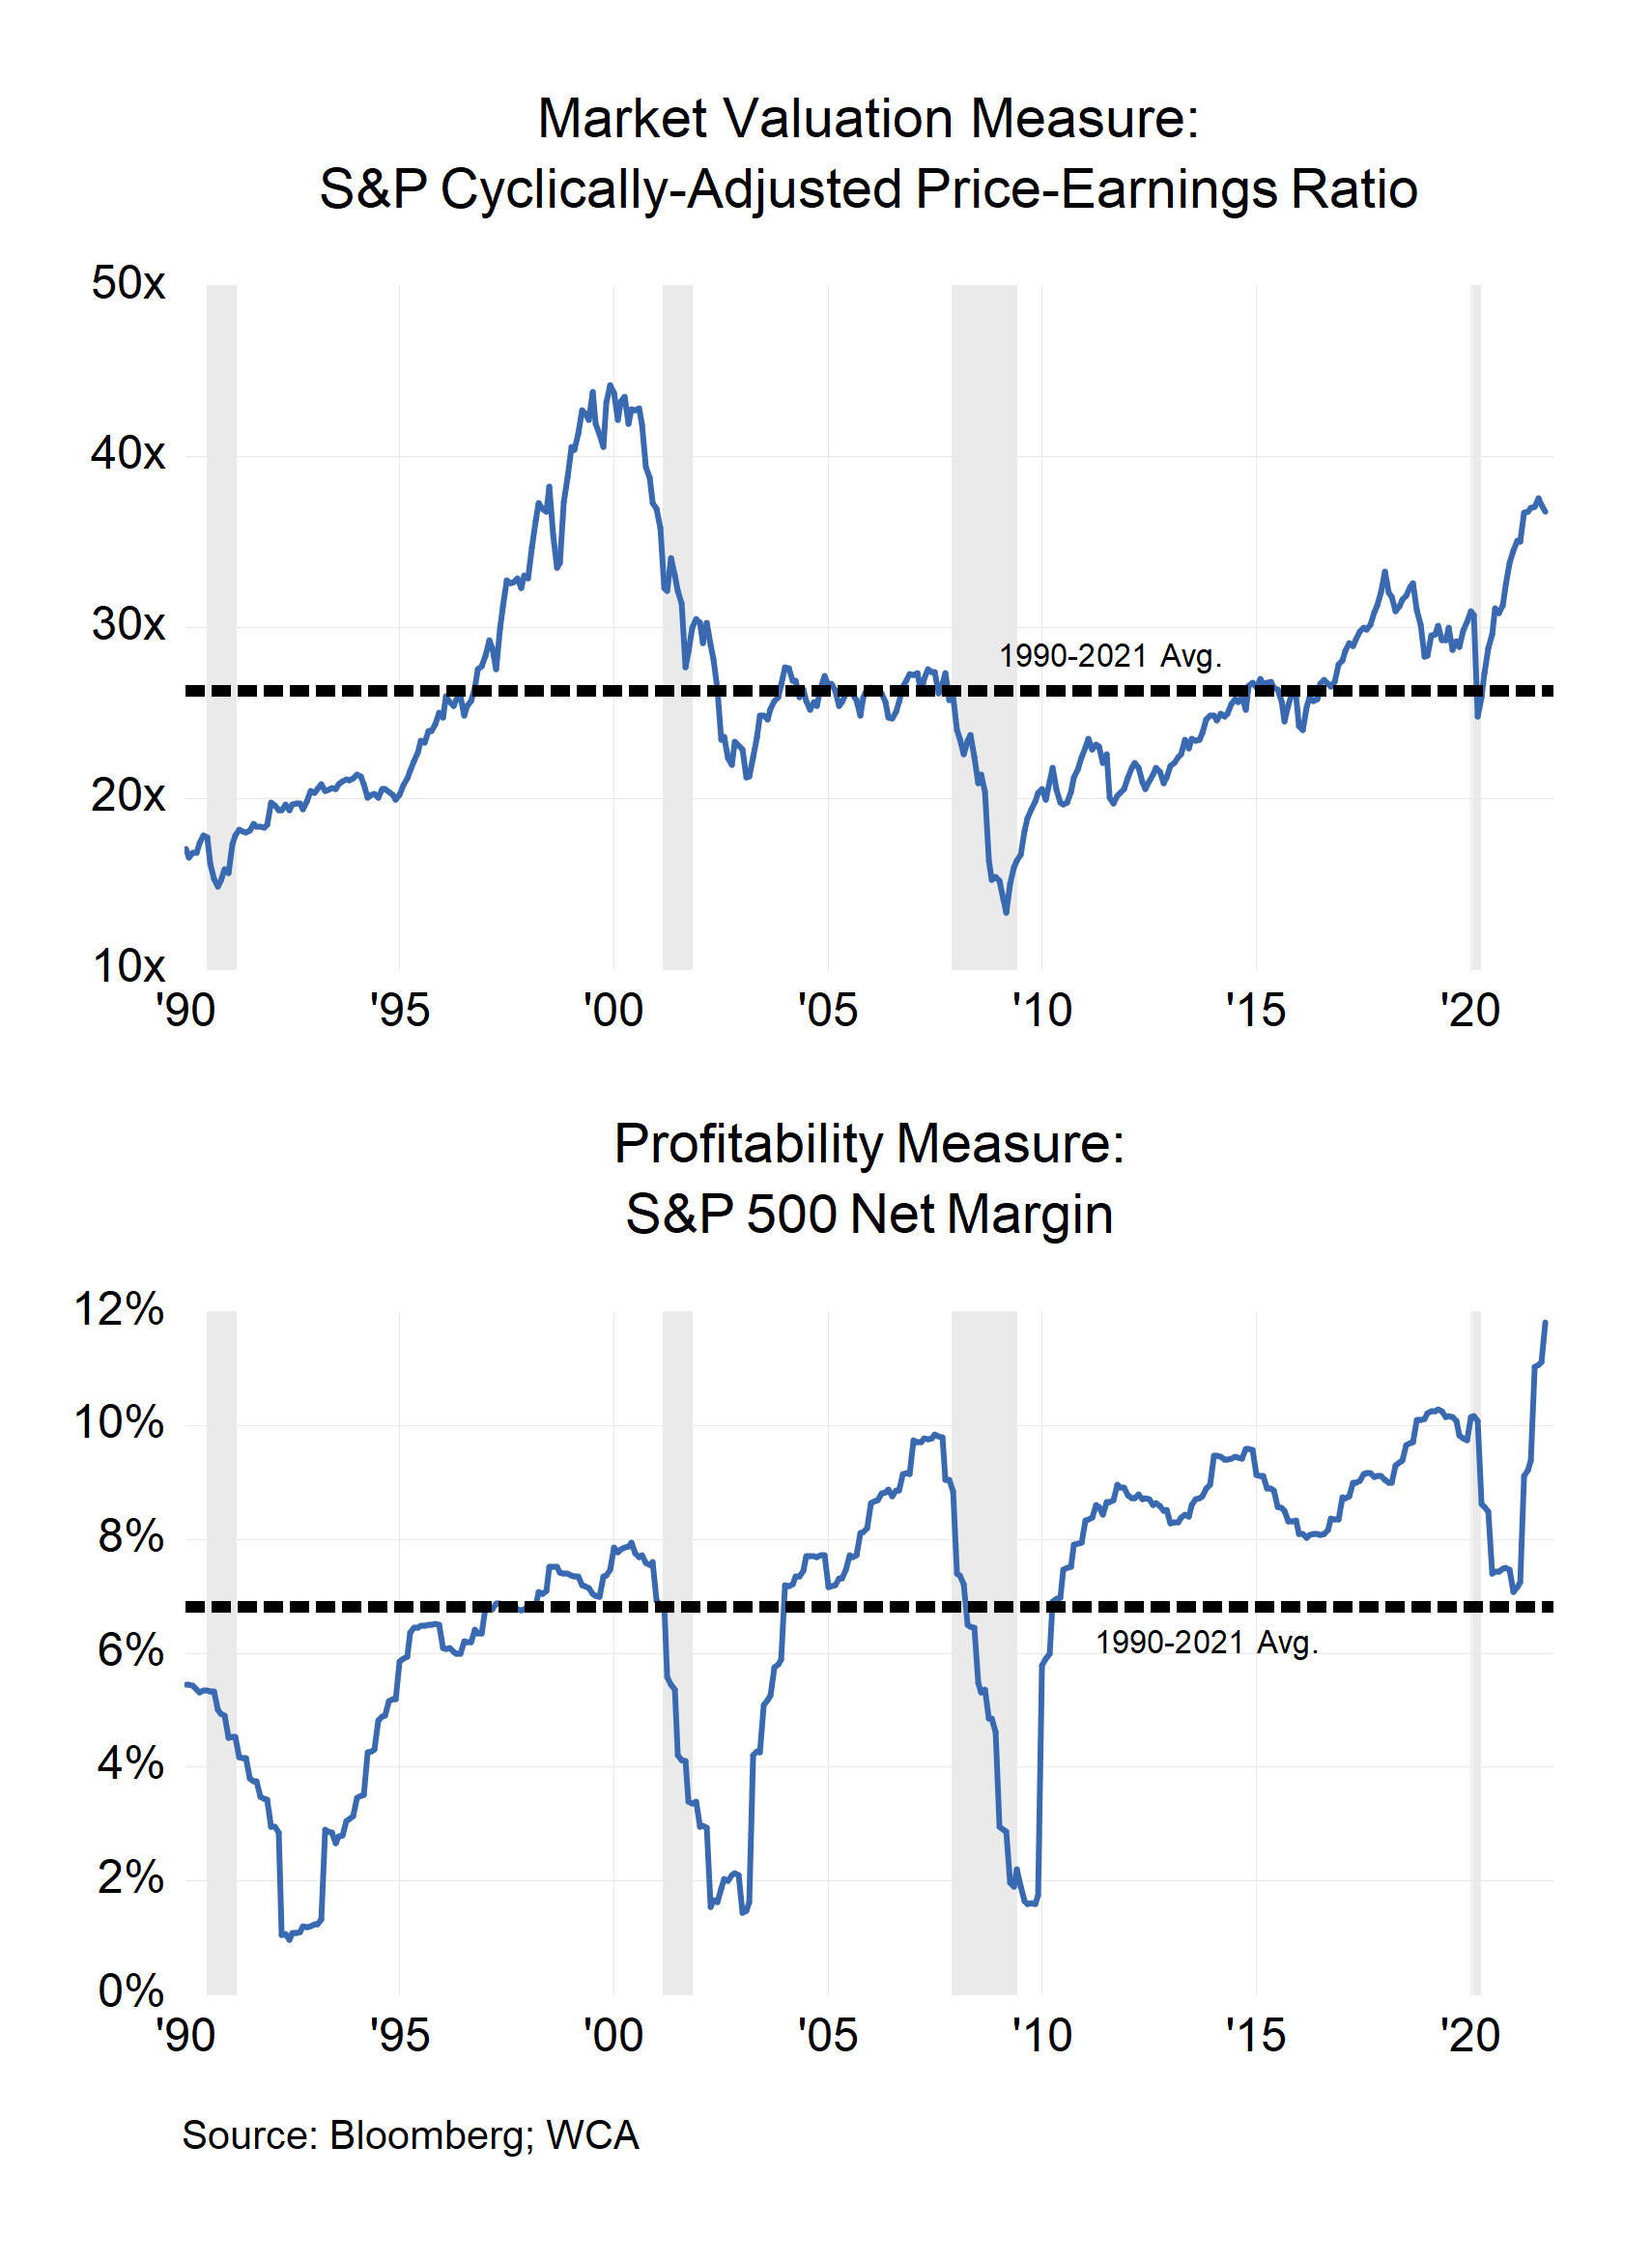
A Look at Multiples & Profits
Stock market price-to-earnings multiples are above the long-run, cyclically-adjusted average (Chart A, Top). Today, we see the market trading at 37x versus a 26x historical average based on ten-year cyclically-adjusted earnings. This 40% premium, if spread out over a ten-year forecast period, reduces return expectations by 4% in our base case (40% premium / 10 years = -4% per year). To assume otherwise would be to assume that stocks are now valued at a new permanently high valuation plateau.
Profit margins stand at all-time highs (Chart A, Bottom). S&P 500 profit margins (profits/sales) ranged from about 1-11% of GDP from 1947-2008 and are near 11% today. Margins were in the 8-10% range for most of the past decade, excluding recessions. Globalization, technological change, eroding union power, availability of inexpensive financing, changes in business size and scale, and other factors all combined to lift profit margins through the years. The surge in post-pandemic activity is also boosting profits above trend. As we expect margins to “revert to the mean” post-pandemic, we expect some drag on profits and long-run return (roughly 1-2% per year) in our base case.
Chart A
Conclusion
The rise in multiples and margins above trend in recent years helped drive indices to records. We do not think margins and valuations are at a new, permanent high. Mean reversion is still part of our base case forecast. We believe that such reversion will likely detract a few percentage points from long-run equity returns.
Disclosures:
WCA Barometer – We regularly assess changes in fundamental conditions to help guide near-term asset allocation decisions. Analysis incorporates approximately 30 forward-looking indicators in categories ranging from Credit and Capital Markets to U.S. Economic Conditions and Foreign Conditions. From each category of data, we create three diffusion-style sub-indices that measure the trends in the underlying data. Sustained improvement that is spread across a wide variety of observations will produce index readings above 50 (potentially favoring stocks), while readings below 50 would indicate potential deterioration (potentially favoring bonds). The WCA Fundamental Conditions Index combines the three underlying categories into a single summary measure. This measure can be thought of as a “barometer” for changes in fundamental conditions.
Standard & Poor’s 500 Index (S&P 500) is a capitalization-weighted index that is generally considered representative of the U.S. large capitalization market.
S&P Global (SPGI) is a leading American provider of financial information, analytics, and credit ratings, headquartered in New York, NY. It operates major divisions including S&P Global Ratings, S&P Global Market Intelligence, S&P Global Commodity Insights, S&P Global Mobility, and S&P Dow Jones Indices.
The ICE BofA U.S. High Yield Index is an unmanaged index that tracks the performance of U.S. dollar denominated, below investment-grade rated corporate debt publicly issued in the U.S. domestic market.
The S&P 500 Growth measures constituents from the S&P 500 that are classified as growth stocks based on three factors: sales growth, the ratio of earnings change to price, and momentum.
The S&P 500 Value Index measures constituents from the S&P 500 that are classified as value stocks based on three factors: the ratios of book value, earnings and sales to price.
The S&P 500 Equal Weight Index is the equal-weight version of the widely regarded Standard & Poor’s 500 Index, which is generally considered representative of the U.S. large capitalization market. The index has the same constituents as the capitalization-weighted S&P 500, but each company in the index is allocated a fixed weight of 0.20% at each quarterly rebalancing.
The WCA Rising Dividend Custom Benchmark is a rules-based benchmark constructed by Washington Crossing Advisors to represent a universe of large capitalization U.S. companies that meet certain quality and dividend growth criteria, including proprietary screens for profitability, earnings consistency, and balance sheet strength, along with minimum market capitalization and dividend growth requirements. The benchmark is reconstituted and rebalanced quarterly and is intended to serve as a style-appropriate benchmark for the WCA Rising Dividend strategy.
The Washington Crossing Advisors’ High Quality Index and Low Quality Index are objective, quantitative measures designed to identify quality in the top 1,000 U.S. companies. Ranked by fundamental factors, WCA grades companies from “A” (top quintile) to “F” (bottom quintile). Factors include debt relative to equity, asset profitability, and consistency in performance. Companies with lower debt, higher profitability, and greater consistency earn higher grades. These indices are reconstituted annually and rebalanced daily. For informational purposes only, and WCA Quality Grade indices do not reflect the performance of any WCA investment strategy.
The risk of loss in trading commodities and futures can be substantial. You should therefore carefully consider whether such trading is suitable for you in light of your financial condition. The high degree of leverage that is often obtainable in commodity trading can work against you as well as for you. The use of leverage can lead to large losses as well as gains.
The information contained herein has been prepared from sources believed to be reliable but is not guaranteed by us and is not a complete summary or statement of all available data, nor is it considered an offer to buy or sell any securities referred to herein. Opinions expressed are subject to change without notice and do not take into account the particular investment objectives, financial situation, or needs of individual investors. There is no guarantee that the figures or opinions forecast in this report will be realized or achieved. Employees of Stifel, Nicolaus & Company, Incorporated or its affiliates may, at times, release written or oral commentary, technical analysis, or trading strategies that differ from the opinions expressed within. Past performance is no guarantee of future results. Indices are unmanaged, and you cannot invest directly in an index.
Asset allocation and diversification do not ensure a profit and may not protect against loss. There are special considerations associated with international investing, including the risk of currency fluctuations and political and economic events. Changes in market conditions or a company’s financial condition may impact a company’s ability to continue to pay dividends, and companies may also choose to discontinue dividend payments. Investing in emerging markets may involve greater risk and volatility than investing in more developed countries. Due to their narrow focus, sector-based investments typically exhibit greater volatility. Small-company stocks are typically more volatile and carry additional risks since smaller companies generally are not as well established as larger companies. Property values can fall due to environmental, economic, or other reasons, and changes in interest rates can negatively impact the performance of real estate companies. When investing in bonds, it is important to note that as interest rates rise, bond prices will fall. High-yield bonds have greater credit risk than higher-quality bonds. Bond laddering does not assure a profit or protect against loss in a declining market. The risk of loss in trading commodities and futures can be substantial. You should therefore carefully consider whether such trading is suitable for you in light of your financial condition. The high degree of leverage that is often obtainable in commodity trading can work against you as well as for you. The use of leverage can lead to large losses as well as gains. Changes in market conditions or a company’s financial condition may impact a company’s ability to continue to pay dividends, and companies may also choose to discontinue dividend payments.
All investments involve risk, including loss of principal, and there is no guarantee that investment objectives will be met. It is important to review your investment objectives, risk tolerance, and liquidity needs before choosing an investment style or manager. Equity investments are subject generally to market, market sector, market liquidity, issuer, and investment style risks, among other factors to varying degrees. Fixed Income investments are subject to market, market liquidity, issuer, investment style, interest rate, credit quality, and call risks, among other factors to varying degrees.
Beta is a measure of the volatility, or systematic risk, of a security or a portfolio relative to the market as a whole. A beta of one is considered as risky as the benchmark and is therefore likely to provide expected returns approximate to those of the benchmark during both up and down periods. A portfolio with a beta of two would move approximately twice as much as the benchmark.
Standard deviation is a measure of the volatility of a security’s or portfolio’s returns in relation to the mean return. The larger the standard deviation, the greater the volatility of return in relation to the mean return.
Changes in market conditions or a company’s financial condition may impact a company’s ability to continue to pay dividends, and companies may also choose to discontinue dividend payments
This commentary often expresses opinions about the direction of market, investment sector, and other trends. The opinions should not be considered predictions of future results. The information contained in this report is based on sources believed to be reliable, but is not guaranteed and not necessarily complete.
The securities discussed in this material were selected due to recent changes in the strategies. This selection criterion is not based on any measurement of performance of the underlying security.
Washington Crossing Advisors, LLC is a wholly-owned subsidiary and affiliated SEC Registered Investment Adviser of Stifel Financial Corp (NYSE: SF). Registration with the SEC implies no level of sophistication in investment management.


