What a Quarter
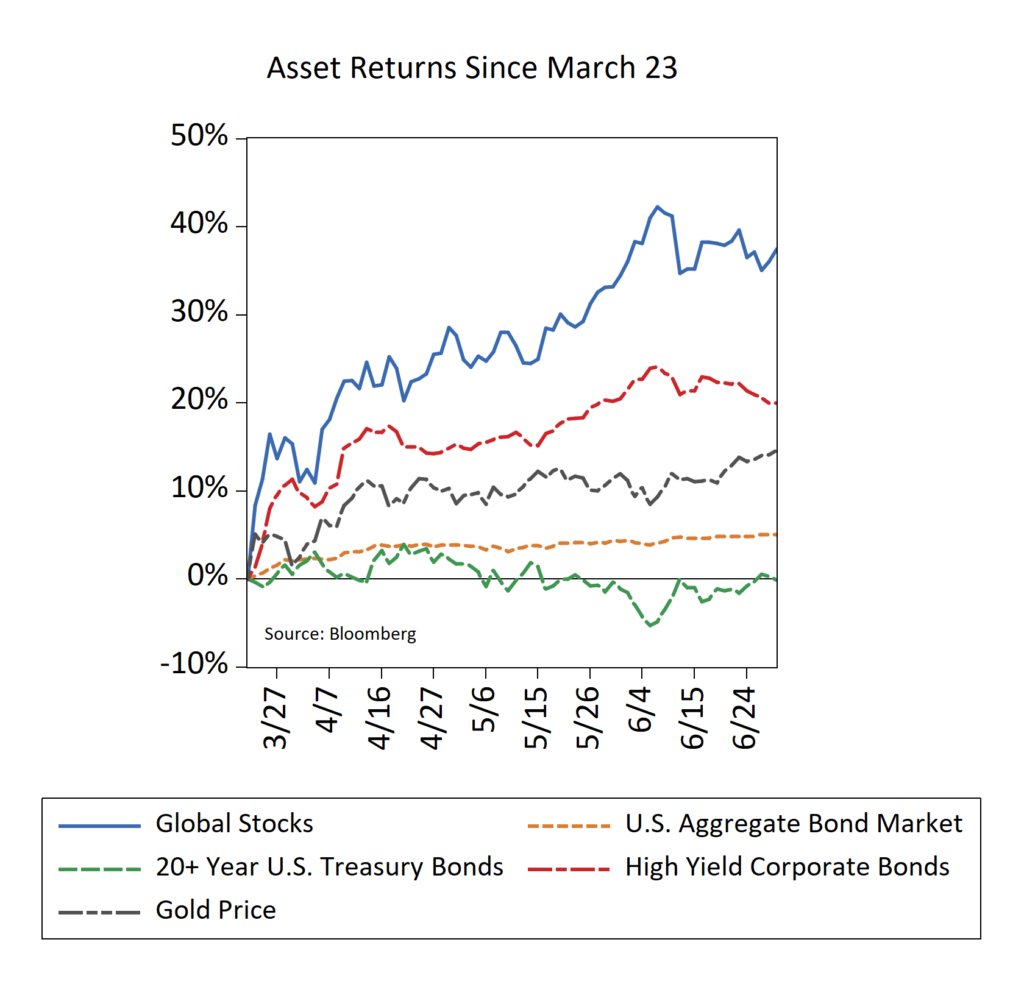
The second quarter saw stocks roar back from March losses. Global shares rose 38%, and high yield corporate bonds rose 20%. Long-term Treasury bonds were flat, and gold was up 15% (chart, below). The rally began after global stocks fell by one third from February 19 through March 23 as COVID-19 spread outside China, and shutdowns began. Since March 23, markets focused on measures taken to deal with the pandemic and its effects on the economy. A $2.2 trillion stimulus package and extraordinary central bank actions triumphed over fear and uncertainty. Volatility reigned throughout the first half of this year.
But as the rally unfolded on stimulus measures, the economy entered a severe downturn. Growth plunged, and the Federal Reserve Bank of Atlanta’s GDP Now model indicated the economy was contracting by more than 50% by early June, measured at an annualized pace. Some improvement is now evident following a partial reopening of the economy, and the rate of estimated decline now stands closer to 35%.
Yields Plunge
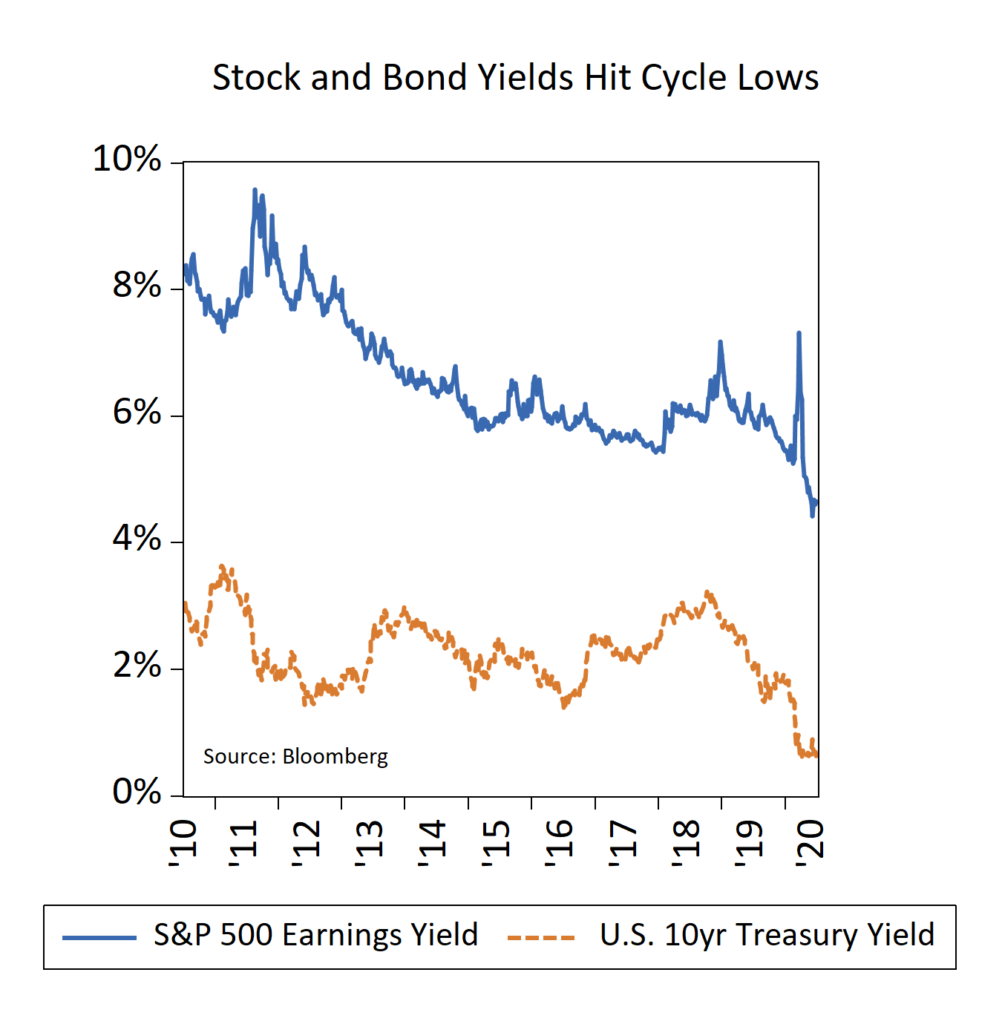
Closely mirroring the slide in the economy is the slide in corporate profit expectations and Treasury yields. Rising stock prices and a weakening profit outlook drove the earnings yield for stocks off a cliff (chart, below), following right alongside a similar dive in Treasury yields. With both of these yield measures at record lows, it is reasonable to expect lower portfolio returns ahead.
Mixed Messages
The market for safe U.S. Treasuries seems to be pointing to weakness and accommodation ahead, given the ultra-low and ultra-flat yield curve. In contrast to bonds, the stock market’s second-quarter run-up appears to point to strength and growth. The tension between these opposing views should resolve in the coming months as the crisis continues to play out. Critically, progress toward a vaccine or therapy for COVID-19, along with continued safe “reopening” measures, will strongly influence which view prevails. Upcoming elections will also play an essential factor.
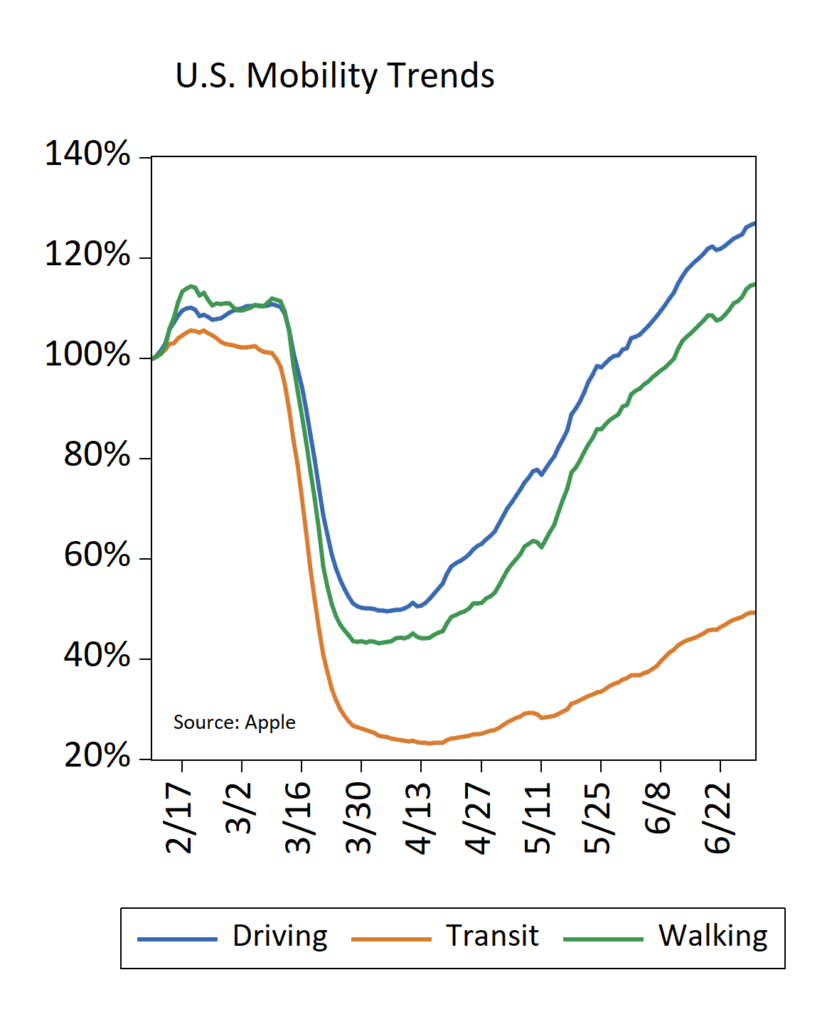
To help track the data, we look to higher frequency indicators alongside our regular monthly data review. The Federal Reserve Bank of New York’s Weekly Economic Index (WEI), for example, tracks several weekly signs of real economic activity such as steel production, retail sales, and electricity demand. The WEI plunged from mid-March through early May, but trends have been on a gradual rise since. We also track mobility data on driving, riding, and walking activity nationwide (chart, below). These trends are even climbing.
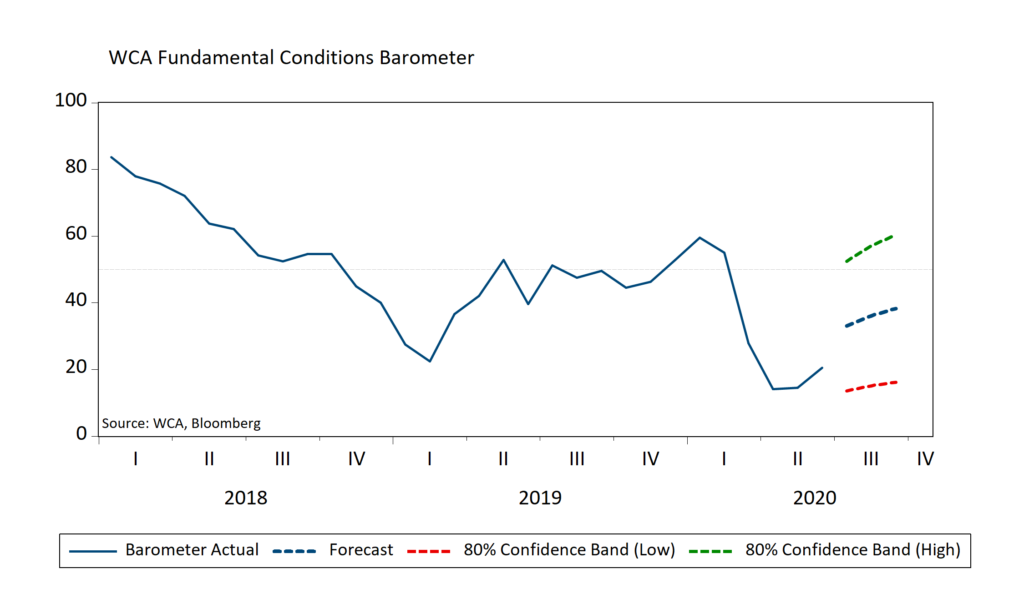
The high-frequency data follows the broad contour of our monthly WCA Fundamental Conditions Index (chart, below). Following recent trends, our three-month ahead forecast envisions continued gradual improvement.
Fluid Situation
Events of the last few months are without any easy precedent. The bond market seems to be taking a more circumspect view of growth from here while stocks are, for now, seeing a more positive outcome. We are looking to trends in the data to lead our conclusions as the situation remains fluid. We believe a tactical approach to evolving conditions remains warranted.
Disclosures:
WCA Barometer – We regularly assess changes in fundamental conditions to help guide near-term asset allocation decisions. Analysis incorporates approximately 30 forward-looking indicators in categories ranging from Credit and Capital Markets to U.S. Economic Conditions and Foreign Conditions. From each category of data, we create three diffusion-style sub-indices that measure the trends in the underlying data. Sustained improvement that is spread across a wide variety of observations will produce index readings above 50 (potentially favoring stocks), while readings below 50 would indicate potential deterioration (potentially favoring bonds). The WCA Fundamental Conditions Index combines the three underlying categories into a single summary measure. This measure can be thought of as a “barometer” for changes in fundamental conditions.
Standard & Poor’s 500 Index (S&P 500) is a capitalization-weighted index that is generally considered representative of the U.S. large capitalization market.
S&P Global (SPGI) is a leading American provider of financial information, analytics, and credit ratings, headquartered in New York, NY. It operates major divisions including S&P Global Ratings, S&P Global Market Intelligence, S&P Global Commodity Insights, S&P Global Mobility, and S&P Dow Jones Indices.
The ICE BofA U.S. High Yield Index is an unmanaged index that tracks the performance of U.S. dollar denominated, below investment-grade rated corporate debt publicly issued in the U.S. domestic market.
The S&P 500 Growth measures constituents from the S&P 500 that are classified as growth stocks based on three factors: sales growth, the ratio of earnings change to price, and momentum.
The S&P 500 Value Index measures constituents from the S&P 500 that are classified as value stocks based on three factors: the ratios of book value, earnings and sales to price.
The S&P 500 Equal Weight Index is the equal-weight version of the widely regarded Standard & Poor’s 500 Index, which is generally considered representative of the U.S. large capitalization market. The index has the same constituents as the capitalization-weighted S&P 500, but each company in the index is allocated a fixed weight of 0.20% at each quarterly rebalancing.
The WCA Rising Dividend Custom Benchmark is a rules-based benchmark constructed by Washington Crossing Advisors to represent a universe of large capitalization U.S. companies that meet certain quality and dividend growth criteria, including proprietary screens for profitability, earnings consistency, and balance sheet strength, along with minimum market capitalization and dividend growth requirements. The benchmark is reconstituted and rebalanced quarterly and is intended to serve as a style-appropriate benchmark for the WCA Rising Dividend strategy.
The Washington Crossing Advisors’ High Quality Index and Low Quality Index are objective, quantitative measures designed to identify quality in the top 1,000 U.S. companies. Ranked by fundamental factors, WCA grades companies from “A” (top quintile) to “F” (bottom quintile). Factors include debt relative to equity, asset profitability, and consistency in performance. Companies with lower debt, higher profitability, and greater consistency earn higher grades. These indices are reconstituted annually and rebalanced daily. For informational purposes only, and WCA Quality Grade indices do not reflect the performance of any WCA investment strategy.
The risk of loss in trading commodities and futures can be substantial. You should therefore carefully consider whether such trading is suitable for you in light of your financial condition. The high degree of leverage that is often obtainable in commodity trading can work against you as well as for you. The use of leverage can lead to large losses as well as gains.
The information contained herein has been prepared from sources believed to be reliable but is not guaranteed by us and is not a complete summary or statement of all available data, nor is it considered an offer to buy or sell any securities referred to herein. Opinions expressed are subject to change without notice and do not take into account the particular investment objectives, financial situation, or needs of individual investors. There is no guarantee that the figures or opinions forecast in this report will be realized or achieved. Employees of Stifel, Nicolaus & Company, Incorporated or its affiliates may, at times, release written or oral commentary, technical analysis, or trading strategies that differ from the opinions expressed within. Past performance is no guarantee of future results. Indices are unmanaged, and you cannot invest directly in an index.
Asset allocation and diversification do not ensure a profit and may not protect against loss. There are special considerations associated with international investing, including the risk of currency fluctuations and political and economic events. Changes in market conditions or a company’s financial condition may impact a company’s ability to continue to pay dividends, and companies may also choose to discontinue dividend payments. Investing in emerging markets may involve greater risk and volatility than investing in more developed countries. Due to their narrow focus, sector-based investments typically exhibit greater volatility. Small-company stocks are typically more volatile and carry additional risks since smaller companies generally are not as well established as larger companies. Property values can fall due to environmental, economic, or other reasons, and changes in interest rates can negatively impact the performance of real estate companies. When investing in bonds, it is important to note that as interest rates rise, bond prices will fall. High-yield bonds have greater credit risk than higher-quality bonds. Bond laddering does not assure a profit or protect against loss in a declining market. The risk of loss in trading commodities and futures can be substantial. You should therefore carefully consider whether such trading is suitable for you in light of your financial condition. The high degree of leverage that is often obtainable in commodity trading can work against you as well as for you. The use of leverage can lead to large losses as well as gains. Changes in market conditions or a company’s financial condition may impact a company’s ability to continue to pay dividends, and companies may also choose to discontinue dividend payments.
All investments involve risk, including loss of principal, and there is no guarantee that investment objectives will be met. It is important to review your investment objectives, risk tolerance, and liquidity needs before choosing an investment style or manager. Equity investments are subject generally to market, market sector, market liquidity, issuer, and investment style risks, among other factors to varying degrees. Fixed Income investments are subject to market, market liquidity, issuer, investment style, interest rate, credit quality, and call risks, among other factors to varying degrees.
Beta is a measure of the volatility, or systematic risk, of a security or a portfolio relative to the market as a whole. A beta of one is considered as risky as the benchmark and is therefore likely to provide expected returns approximate to those of the benchmark during both up and down periods. A portfolio with a beta of two would move approximately twice as much as the benchmark.
Standard deviation is a measure of the volatility of a security’s or portfolio’s returns in relation to the mean return. The larger the standard deviation, the greater the volatility of return in relation to the mean return.
Changes in market conditions or a company’s financial condition may impact a company’s ability to continue to pay dividends, and companies may also choose to discontinue dividend payments
This commentary often expresses opinions about the direction of market, investment sector, and other trends. The opinions should not be considered predictions of future results. The information contained in this report is based on sources believed to be reliable, but is not guaranteed and not necessarily complete.
The securities discussed in this material were selected due to recent changes in the strategies. This selection criterion is not based on any measurement of performance of the underlying security.
Washington Crossing Advisors, LLC is a wholly-owned subsidiary and affiliated SEC Registered Investment Adviser of Stifel Financial Corp (NYSE: SF). Registration with the SEC implies no level of sophistication in investment management.


