Valuations, Revisited
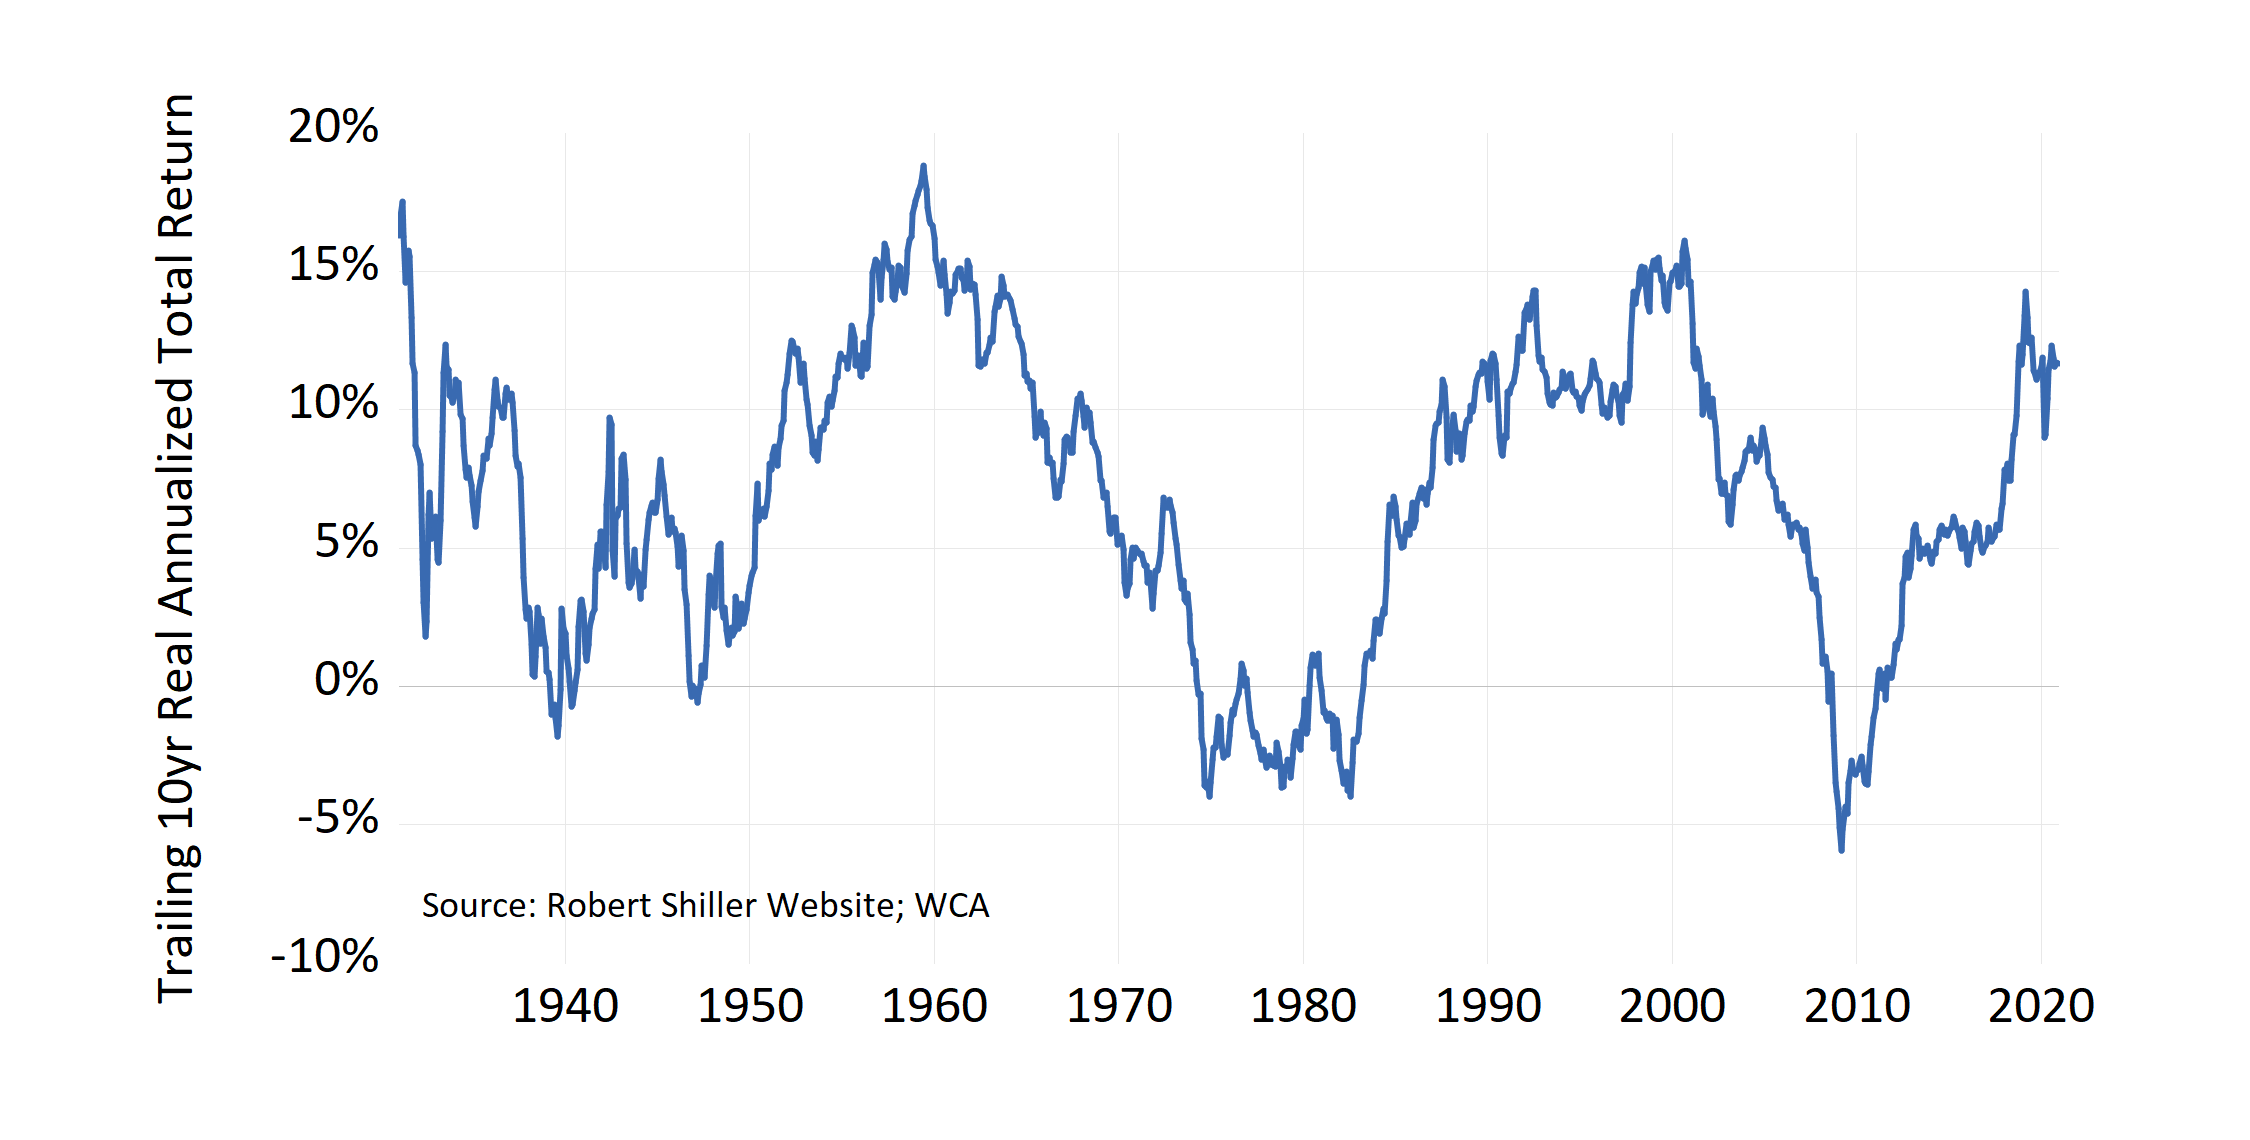
The stock market is on a historic run, with U.S. stocks eclipsing $42 trillion in value for the first time ever last week. The broad market, measured by the S&P 500, continues a decade of strong returns with the rolling 10-year real return for the market above 10% (Chart A, below).
Chart A
S&P 500 Trailing 10yr Real Annualized Return
Market of Stocks
Many of this year’s “stay at home” themes are playing out and the technology sector is on a tear. Yet, this year reminds us it is not so much a “stock market” as a “market of stocks.” Even though the S&P 500 is up 17.1% year-to-date, consider the following:
- 8.5% percentage points of that return came from technology. Excluding that sector, the S&P 500 is up just 6.7%.
- Just ten stocks accounted for a full 12 percentage points of the 17% S&P 500 return.
- The median return of the 500 stocks in the S&P 500 is near 0%.
- And more than 200 of the 500 stocks in the S&P 500 are down for the year, with an average return of -20% in that group.
Beneath the surface, there is quite a lot going on here. At some point, value-oriented investors are likely to notice a growing gulf between a handful of highly-priced popular stocks and the rest of the market.
Lessons of the Past
It pays to remember lessons of the past. So let us look back twenty years when technology was also enjoying a bull run. At the start of the New Millenium, Microsoft was the most valuable company ever by market capitalization with a value of over $600 billion. The stock traded near 80 times earnings, with earnings growth of 40% per year posted throughout the 1990s. The future seemed bright, indeed.
A year later, in late 2000, General Electric (GE) grabbed the top perch as the most valuable company in America. GE was a venerable industrial juggernaut, and earnings had grown steadily by over 10% annually throughout the 1990s. The stock’s value reached 45 times earnings by 2000, a massive multiple for such a mature business. Yet investors who eagerly bought and held either stock began a long period of regret. Subsequent performance failed to meet and exceed the lofty expectations of the early 2000s. Microsoft investors endured a 50% decline (-4.5% annually) from 2000-2010, and General Electric investors suffered a 78% decline (-4.5% annually) from 2001 to today.
The lesson of the 2000 bear market was not the only one. During the 1960s, a group of companies called the “Nifty Fifty” saw a robust rise. These conglomerates were popular household names and had a similar story of uninterrupted growth. But the prolonged bear market of the 1970s caused valuations of the “Nifty Fifty” to fall to low levels along with the rest of the market, with most of these stocks under-performing the broader market averages. Unrealistic investor expectations and excessive starting valuations created the conditions that led to the sharp losses in these otherwise well-known household names.
Lesson 1: Be careful of high valuations, multiples meaningfully above 50 or 60 times earnings can reflect unrealistic expectations that are hard to achieve.
Lesson 2: When valuations stop making sense, breaking with the herd can sometimes pay big dividends.
The Big Picture: A Century of Valuations
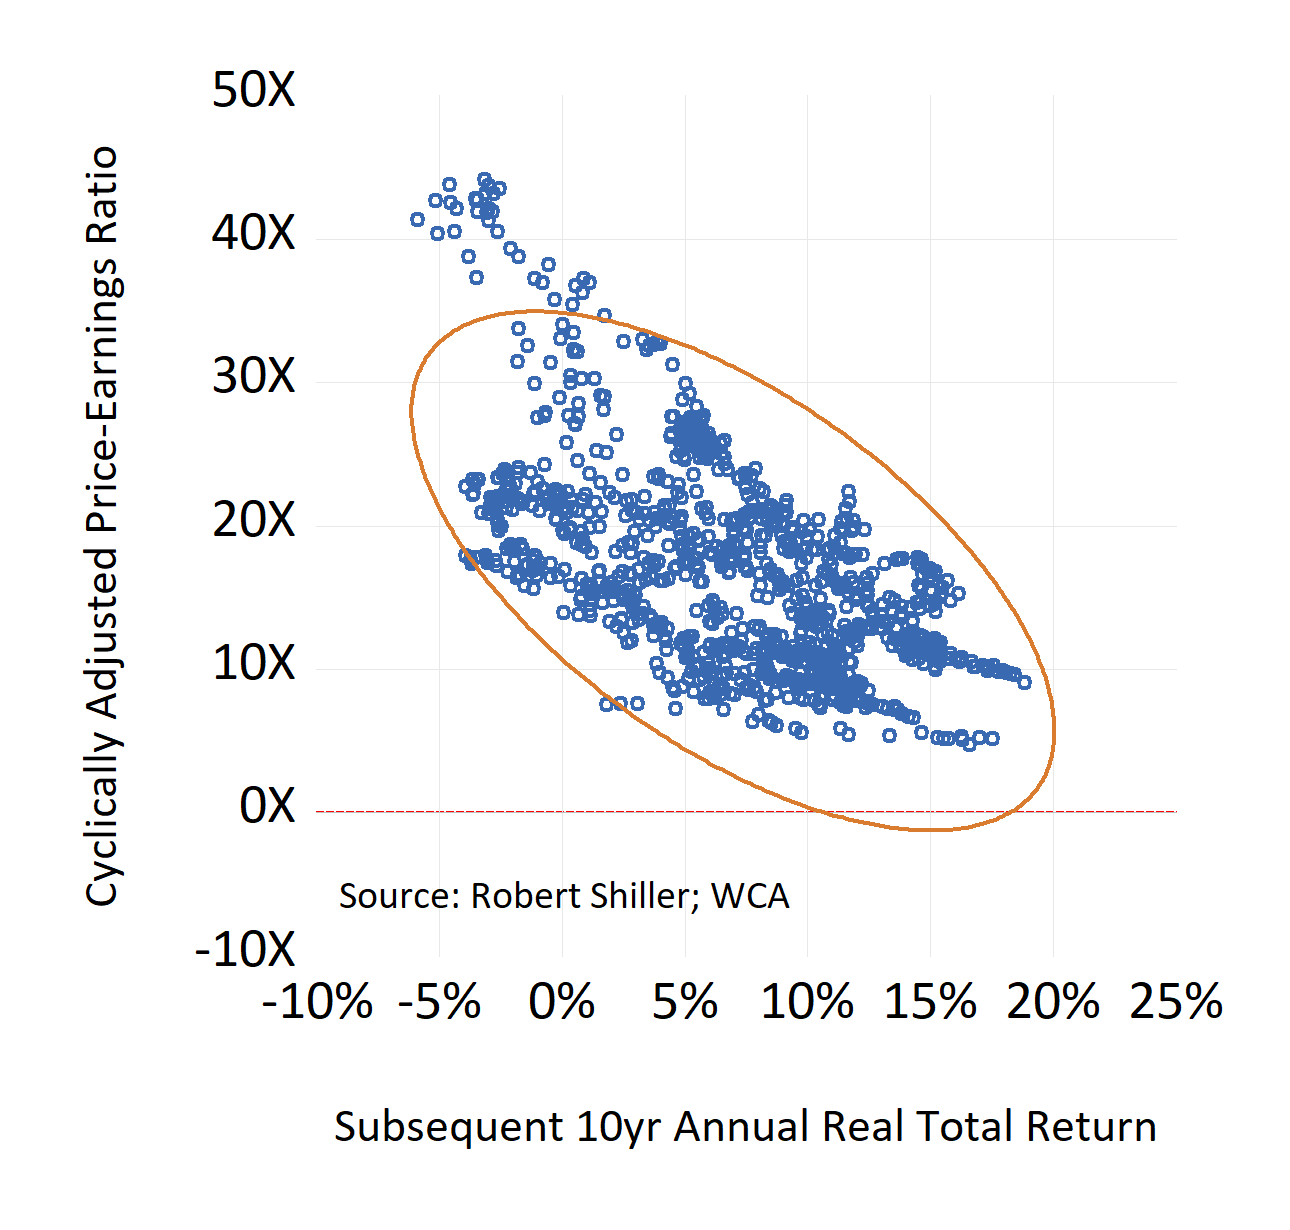
In most times, valuations tend to have little near-term predictive power. A measure of long-run valuation that adjusts for cyclical swings in earnings is called the Cyclically Adjusted Price to Earnings, or CAPE, ratio (Chart B, below). This ratio was popularized and made available by Professor Robert Shiller of Yale. As you can see, the ratio has risen in recent years as stock prices ran ahead of normalized earnings. The bottom chart (Chart C, below) shows the relationship between CAPE valuation levels (vertical axis) and subsequent ten year real annualized returns (bottom axis). As you can see, there is a negative, albeit imperfect, relationship between valuation and return most of the time. Today’s above-average CAPE multiple of 33 suggests that future returns could be harder to come by, making prudent valuation and stock selection even more critical now than in the past.
Chart B
Cyclically Adjusted Price to Earnings Ratio (CAPE)
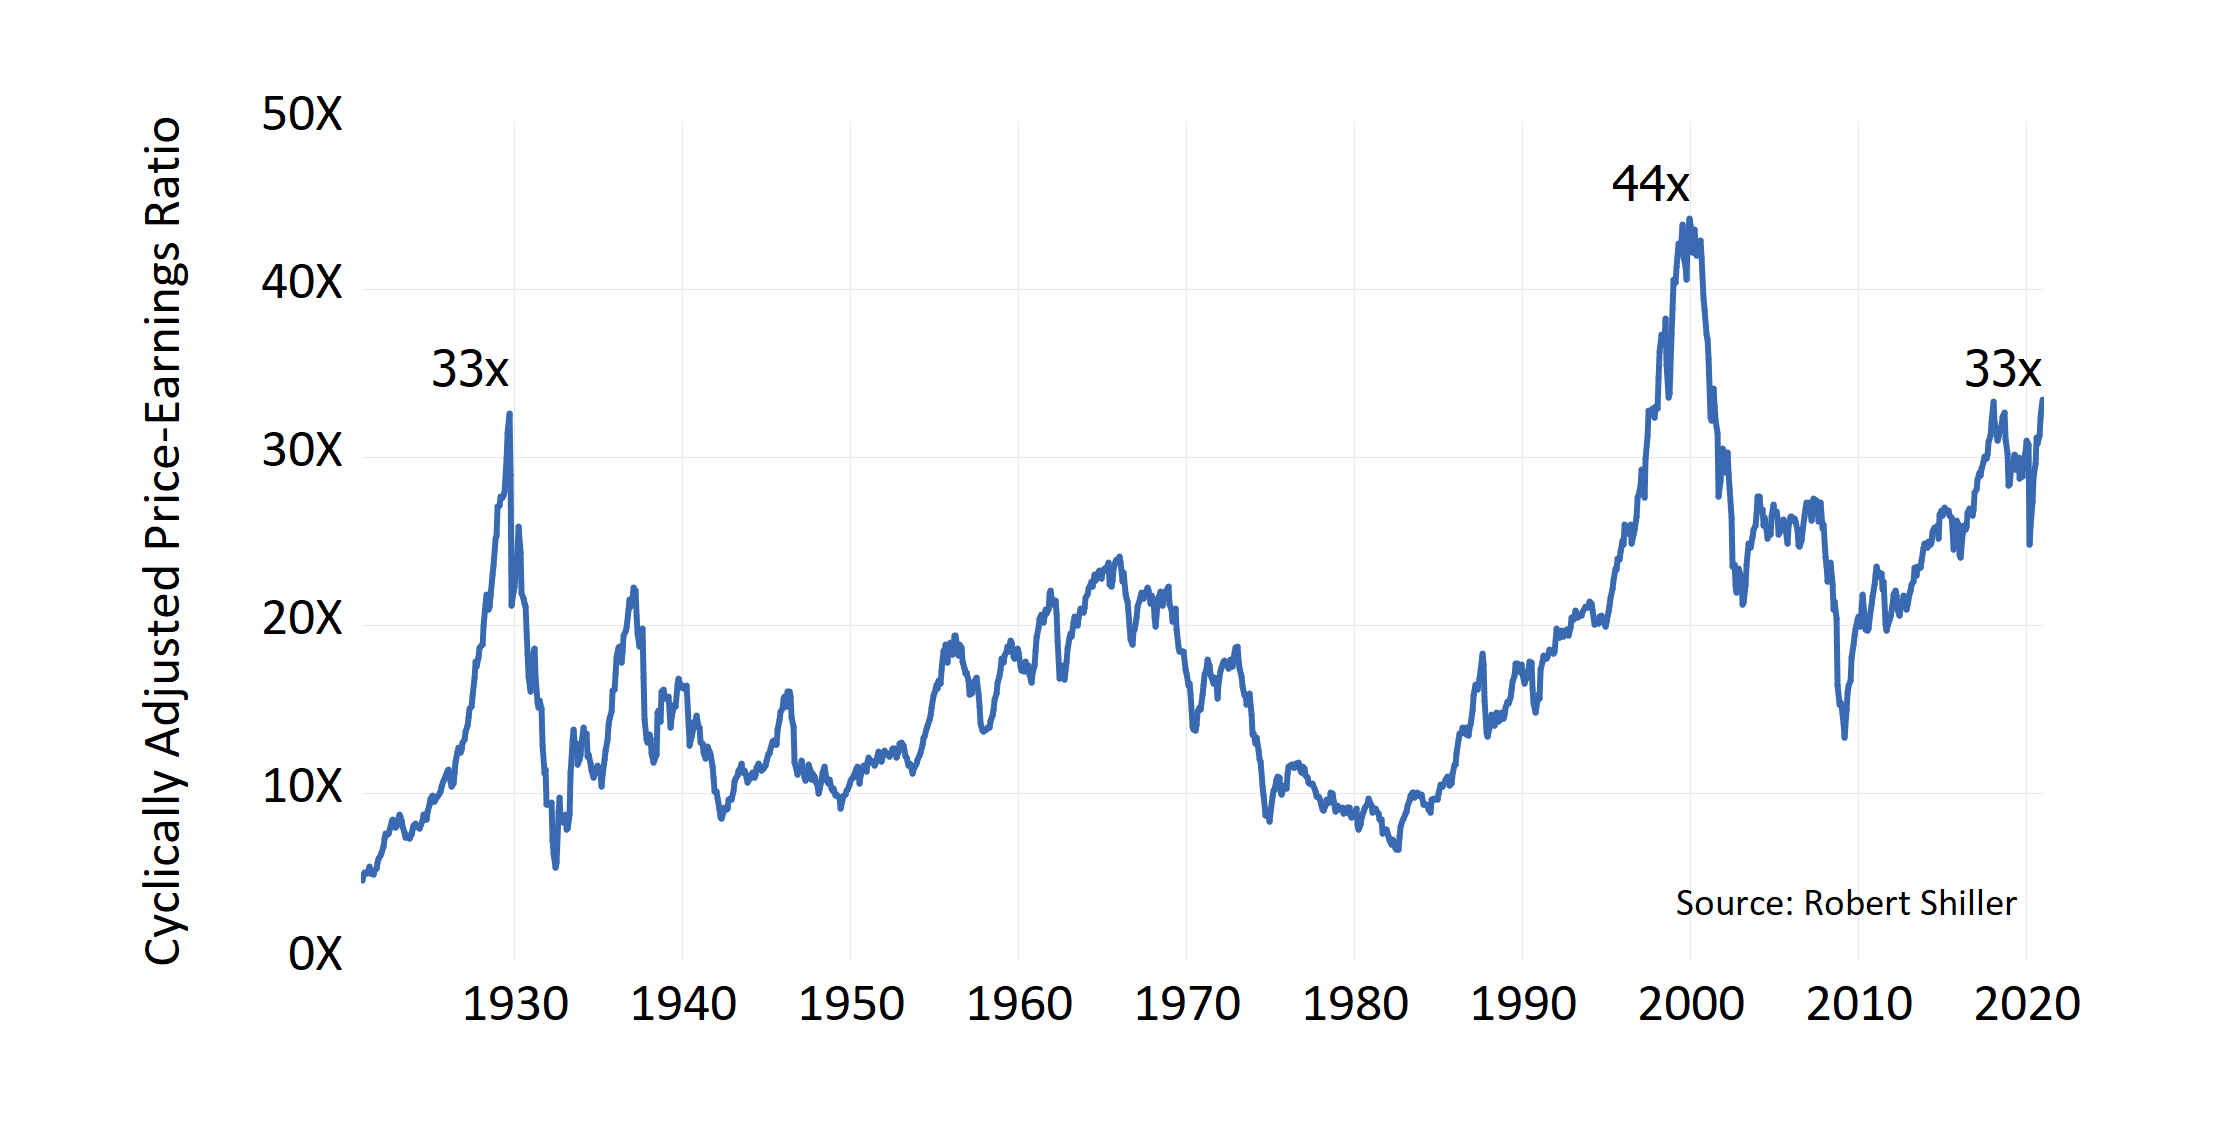
Chart C
CAPE and Subsequent Returns
Lessons for Today
This year’s wild ride drove investors toward thematic and growth-oriented firms. Emerging technology and high-growth companies became the popular answer for many traders during 2020. But now, we see several stocks with market values at or near $2 trillion, implying lofty expectations in some areas. Many of today’s high-growth darlings trade with earnings multiples well above 50 — a warning level of past trouble.
Even if earnings rebound next year and bond yields remain low, there are pockets of extreme valuations and aggregate market valuations appear full. Although trends remain positive for now, it makes sense to focus on balancing quality with value as we go forward from here. High starting valuations suggest that a more tactical posture and/or stock-picking skill will be required to outperform.
Disclosures:
WCA Barometer – We regularly assess changes in fundamental conditions to help guide near-term asset allocation decisions. Analysis incorporates approximately 30 forward-looking indicators in categories ranging from Credit and Capital Markets to U.S. Economic Conditions and Foreign Conditions. From each category of data, we create three diffusion-style sub-indices that measure the trends in the underlying data. Sustained improvement that is spread across a wide variety of observations will produce index readings above 50 (potentially favoring stocks), while readings below 50 would indicate potential deterioration (potentially favoring bonds). The WCA Fundamental Conditions Index combines the three underlying categories into a single summary measure. This measure can be thought of as a “barometer” for changes in fundamental conditions.
Standard & Poor’s 500 Index (S&P 500) is a capitalization-weighted index that is generally considered representative of the U.S. large capitalization market.
S&P Global (SPGI) is a leading American provider of financial information, analytics, and credit ratings, headquartered in New York, NY. It operates major divisions including S&P Global Ratings, S&P Global Market Intelligence, S&P Global Commodity Insights, S&P Global Mobility, and S&P Dow Jones Indices.
The ICE BofA U.S. High Yield Index is an unmanaged index that tracks the performance of U.S. dollar denominated, below investment-grade rated corporate debt publicly issued in the U.S. domestic market.
The S&P 500 Growth measures constituents from the S&P 500 that are classified as growth stocks based on three factors: sales growth, the ratio of earnings change to price, and momentum.
The S&P 500 Value Index measures constituents from the S&P 500 that are classified as value stocks based on three factors: the ratios of book value, earnings and sales to price.
The S&P 500 Equal Weight Index is the equal-weight version of the widely regarded Standard & Poor’s 500 Index, which is generally considered representative of the U.S. large capitalization market. The index has the same constituents as the capitalization-weighted S&P 500, but each company in the index is allocated a fixed weight of 0.20% at each quarterly rebalancing.
The WCA Rising Dividend Custom Benchmark is a rules-based benchmark constructed by Washington Crossing Advisors to represent a universe of large capitalization U.S. companies that meet certain quality and dividend growth criteria, including proprietary screens for profitability, earnings consistency, and balance sheet strength, along with minimum market capitalization and dividend growth requirements. The benchmark is reconstituted and rebalanced quarterly and is intended to serve as a style-appropriate benchmark for the WCA Rising Dividend strategy.
The Washington Crossing Advisors’ High Quality Index and Low Quality Index are objective, quantitative measures designed to identify quality in the top 1,000 U.S. companies. Ranked by fundamental factors, WCA grades companies from “A” (top quintile) to “F” (bottom quintile). Factors include debt relative to equity, asset profitability, and consistency in performance. Companies with lower debt, higher profitability, and greater consistency earn higher grades. These indices are reconstituted annually and rebalanced daily. For informational purposes only, and WCA Quality Grade indices do not reflect the performance of any WCA investment strategy.
The risk of loss in trading commodities and futures can be substantial. You should therefore carefully consider whether such trading is suitable for you in light of your financial condition. The high degree of leverage that is often obtainable in commodity trading can work against you as well as for you. The use of leverage can lead to large losses as well as gains.
The information contained herein has been prepared from sources believed to be reliable but is not guaranteed by us and is not a complete summary or statement of all available data, nor is it considered an offer to buy or sell any securities referred to herein. Opinions expressed are subject to change without notice and do not take into account the particular investment objectives, financial situation, or needs of individual investors. There is no guarantee that the figures or opinions forecast in this report will be realized or achieved. Employees of Stifel, Nicolaus & Company, Incorporated or its affiliates may, at times, release written or oral commentary, technical analysis, or trading strategies that differ from the opinions expressed within. Past performance is no guarantee of future results. Indices are unmanaged, and you cannot invest directly in an index.
Asset allocation and diversification do not ensure a profit and may not protect against loss. There are special considerations associated with international investing, including the risk of currency fluctuations and political and economic events. Changes in market conditions or a company’s financial condition may impact a company’s ability to continue to pay dividends, and companies may also choose to discontinue dividend payments. Investing in emerging markets may involve greater risk and volatility than investing in more developed countries. Due to their narrow focus, sector-based investments typically exhibit greater volatility. Small-company stocks are typically more volatile and carry additional risks since smaller companies generally are not as well established as larger companies. Property values can fall due to environmental, economic, or other reasons, and changes in interest rates can negatively impact the performance of real estate companies. When investing in bonds, it is important to note that as interest rates rise, bond prices will fall. High-yield bonds have greater credit risk than higher-quality bonds. Bond laddering does not assure a profit or protect against loss in a declining market. The risk of loss in trading commodities and futures can be substantial. You should therefore carefully consider whether such trading is suitable for you in light of your financial condition. The high degree of leverage that is often obtainable in commodity trading can work against you as well as for you. The use of leverage can lead to large losses as well as gains. Changes in market conditions or a company’s financial condition may impact a company’s ability to continue to pay dividends, and companies may also choose to discontinue dividend payments.
All investments involve risk, including loss of principal, and there is no guarantee that investment objectives will be met. It is important to review your investment objectives, risk tolerance, and liquidity needs before choosing an investment style or manager. Equity investments are subject generally to market, market sector, market liquidity, issuer, and investment style risks, among other factors to varying degrees. Fixed Income investments are subject to market, market liquidity, issuer, investment style, interest rate, credit quality, and call risks, among other factors to varying degrees.
Beta is a measure of the volatility, or systematic risk, of a security or a portfolio relative to the market as a whole. A beta of one is considered as risky as the benchmark and is therefore likely to provide expected returns approximate to those of the benchmark during both up and down periods. A portfolio with a beta of two would move approximately twice as much as the benchmark.
Standard deviation is a measure of the volatility of a security’s or portfolio’s returns in relation to the mean return. The larger the standard deviation, the greater the volatility of return in relation to the mean return.
Changes in market conditions or a company’s financial condition may impact a company’s ability to continue to pay dividends, and companies may also choose to discontinue dividend payments
This commentary often expresses opinions about the direction of market, investment sector, and other trends. The opinions should not be considered predictions of future results. The information contained in this report is based on sources believed to be reliable, but is not guaranteed and not necessarily complete.
The securities discussed in this material were selected due to recent changes in the strategies. This selection criterion is not based on any measurement of performance of the underlying security.
Washington Crossing Advisors, LLC is a wholly-owned subsidiary and affiliated SEC Registered Investment Adviser of Stifel Financial Corp (NYSE: SF). Registration with the SEC implies no level of sophistication in investment management.


