The Week Ahead: May 16, 2016
This week’s data includes a look at consumer prices and industrial production on Tuesday. Each is relevant given recent below trend growth in fundamental data.
MACRO VIEW
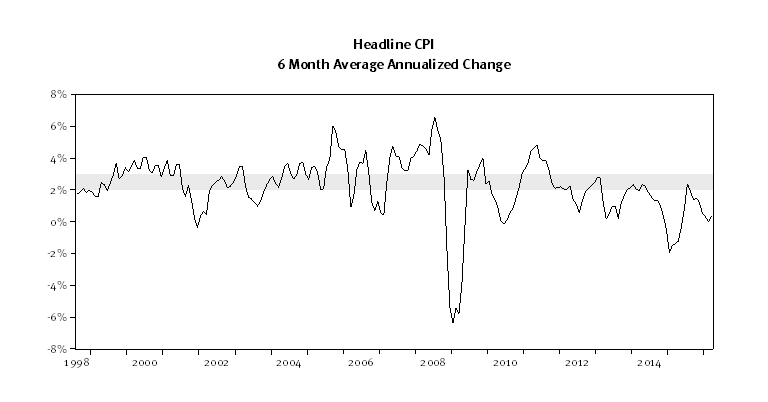
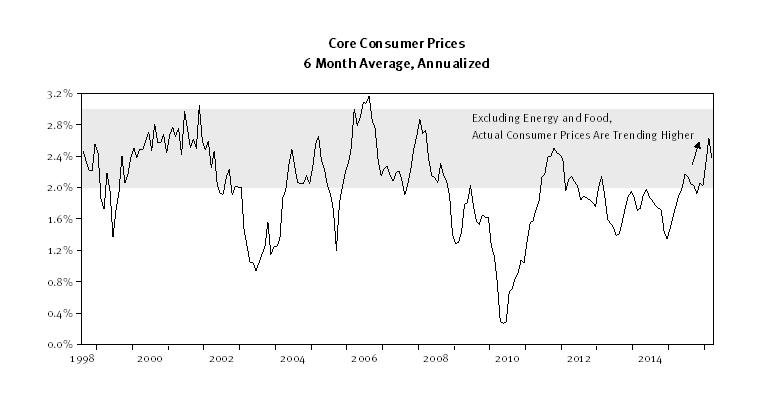
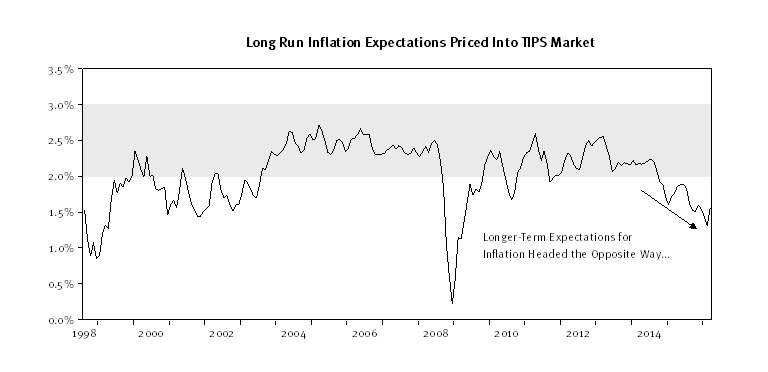
Headline consumer prices (CPI) in the last year were pressured by a sharp decline in the energy component of the index. Stripping out energy (and food), core underlying inflation trends appears stronger (second chart, below). The core inflation numbers tend to be the ones emphasized most by policy makers, however. The rise in current core inflation trends stand at odds with overall inflation and future expectations for falling headline inflation (bottom chart, below).
There is currently no expectation for a Federal Reserve (Fed) rate hike in June, nor is there much of an expectation for a hike through the remainder of the year (maybe another 25bps by year-end, based on futures). Still, the pickup in non-energy, core consumer prices, and increased voicing of concern by various Fed members underscores a disconnect. Last week, two Federal Reserve presidents, Boston Fed President Eric Rosengren and the Kansas City Fed’s Esther George, both commented over the need for the Fed to gradually normalize interest rates. Rosengren and George tend toward opposite spectrums of the Hawk-Dove scale, with Rosengren tending more toward the “dove” side of the spectrum (more in favor of accommodative policy). Rosengren identified improvement in the jobs market and inflation as key to normalization, while George’s comments seemed to focus on the tendency for easy money to promote cycles of disruptive overleveraging and unwinding. The Fed continues to speak for the need for removing accommodation, the bond market seems not as sure. The yield curve is the most flat since the beginning of expansion. The current spread between the 3-month T-Bill and 10-year Treasury Bond yield is 140 basis points, as the 10-year yield traded to a 1.7% yield last week.
On Wednesday, we will get some more insight into what the Fed saw in assessing their April 26-27 decision on Wednesday.
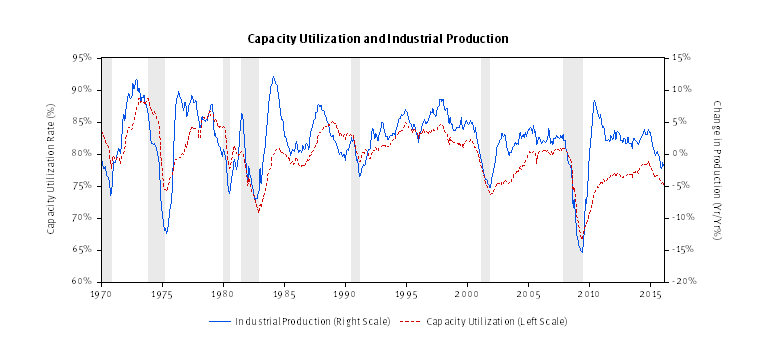
Beyond inflation, we will also get a look at industrial production and capacity utilization (chart below). Industrial production and GDP tend to be highly correlated (see below). Industrial production is a useful indicator for measuring economic growth because it tends to lead overall changes in GDP slightly and is available on a more frequent basis. Last month (March), industrial production fell by -0.6%. Over the last six months industrial production averaged a -0.3% monthly change. This is the worst stretch of growth for industrial production growth since the start of expansion. A positive number this week would break the trend and remove some of the concern regarding weakening growth. The consensus forecast calls for a +0.3% figure on industrial production for April and a move higher in capacity utilization.
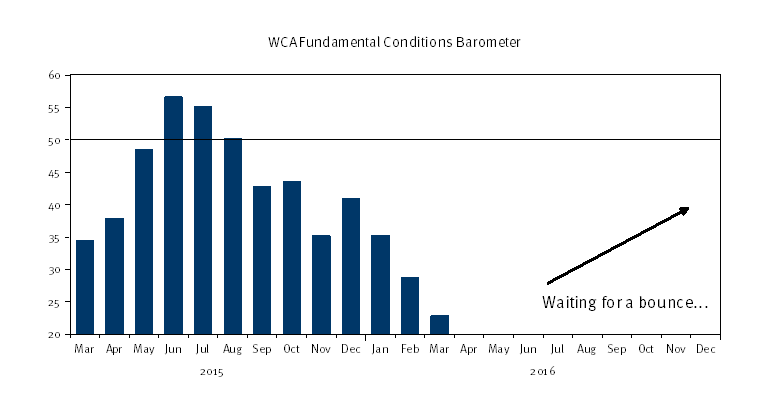
Last week’s retail sales figures surprised on the upside, providing some signs that consumers are still shopping (chart, below). Steady final demand is an important condition for a second-half pickup. While sales growth of just over 1% is not strong by historic standards, it is consistent with the slow-but-steady pace of consumption growth seen in recent years. So far, the overall trends in the data are not yet pronounced enough to produce a turn in the WCA Fundamental Conditions Barometer, which weakened again through March (chart, bottom). We use this input to guide tactical allocation decisions and to guide the path of our long-run forecasts, blending near-term outlook with longer-term equilibrium expected returns. Allocations remain tilted toward bonds from stocks and blended forward-looking long run returns are skewed toward the lower end of the expectation spectrum as the result of continued weakness in data that guide our near-term outlook and sub-asset class factor model inputs. Accordingly, we’ve adjusted risk exposure down to accommodate a more uncertain environment. We assumed this posture in late 2014 and maintain a cautious posture today, in keeping with our observations and expectations.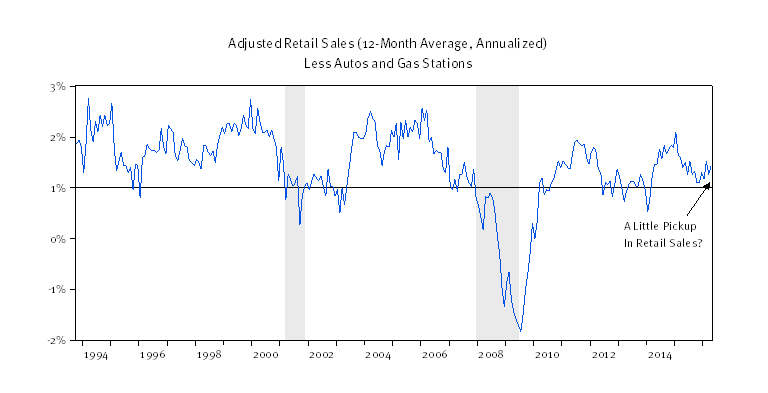
ECONOMIC RELEASES THIS WEEK
| Date | Report | Period | Survey | Prior |
| Monday, May 16: | Empire State Mfg Survey | May | 7.00 | 9.56 |
| Housing Market Index | May | 59 | 58 | |
| Treasury International Capital | Mar | — | $72.0 B | |
| Tuesday, May 17: | CPI – M/M change | April | 0.4% | 0.1% |
| CPI – Y/Y change | April | 1.1% | 0.9% | |
| CPI less food & energy – M/M | April | 0.2% | 0.1% | |
| CPI less food & energy – Y/Y | April | 2.1% | 2.2% | |
| Housing Starts M/M | April | 2.9% | -8.8% | |
| Building Permits M/M | April | 4.8% | -7.7% | |
| Industrial Production M/M | April | 0.3% | -0.6% | |
| Manufacturing Production M/M | April | 0.3% | -0.3% | |
| Capacity Utilization | April | 75.0% | 74.8% | |
| Wednesday, May 18: | April FOMC Meeting Minutes | |||
| Thursday, May 19: | Weekly Jobless Claims | May 14 | — | 294 K |
| Philadelphia Fed Business Outlook Survey | May | 3.5 | -1.6 | |
| Friday, May 20: | Existing Home Sales – M/M | April | 1.1% | 5.1% |
| Existing Home Sales – Y/Y | April | — | 1.5% |
ASSET ALLOCATION PORTFOLIO POSTURE
LONG-RUN STRATEGIC POSTURE: Our macro outlook is for slow growth and stubbornly low inflation. The start of policy normalization following years of zero interest rate policy in the United States comes at a time of weakening global growth and mixed signals from the domestic economy. We continue to view the United States economy as best positioned to weather the overall weak global environment that resurfaced in 2015.
The information contained herein has been prepared from sources believed to be reliable but is not guaranteed by us and is not a complete summary or statement of all available data, nor is it considered an offer to buy or sell any securities referred to herein. Opinions expressed are subject to change without notice and do not take into account the particular investment objectives, financial situation, or needs of individual investors. There is no guarantee that the figures or opinions forecasted in this report will be realized or achieved. Employees of Stifel, Nicolaus & Company, Incorporated or its affiliates may, at times, release written or oral commentary, technical analysis, or trading strategies that differ from the opinions expressed within. Past performance is no guarantee of future results. Indices are unmanaged, and you cannot invest directly in an index.
Asset allocation and diversification do not ensure a profit and may not protect against loss. There are special considerations associated with international investing, including the risk of currency fluctuations and political and economic events. Investing in emerging markets may involve greater risk and volatility than investing in more developed countries. Due to their narrow focus, sector-based investments typically exhibit greater volatility. Small company stocks are typically more volatile and carry additional risks, since smaller companies generally are not as well established as larger companies. Property values can fall due to environmental, economic, or other reasons, and changes in interest rates can negatively impact the performance of real estate companies. When investing in bonds, it is important to note that as interest rates rise, bond prices will fall. High-yield bonds have greater credit risk than higher quality bonds. The risk of loss in trading commodities and futures can be substantial. You should therefore carefully consider whether such trading is suitable for you in light of your financial condition. The high degree of leverage that is often obtainable in commodity trading can work against you as well as for you. The use of leverage can lead to large losses as well as gains.
The WCA Fundamental Conditions Barometer measures the breadth of changes to a wide variety of fundamental data. The barometer measures the proportion of indicators under review that are moving up or down together. A barometer reading above 50 generally indicates a more bullish environment for the economy and equities, and a lower reading implies the opposite. Quantifying changes this way helps us incorporate new facts into our near-term outlook in an objective and unbiased way. More information on the barometer is found in our latest quarterly report, available at www.washingtoncrossingadvisors.com/insights.html.
Kevin Caron, Portfolio Manager
Chad Morganlander, Portfolio Manager
Matthew Battipaglia, Analyst
Suzanne Ashley, Junior Analyst