The Role of Capital In The AI Boom
Artificial intelligence will be a major technology for the next generation and likely to shape our future. Effects on business automation, medicine, science, education, security, consumer services, and software could be far-reaching. Changes to come are very likely to be as important as the rise of personal computers or the internet. We do not view AI as a fad, but the current surge in AI capital spending is still a cycle.
The current AI boom is being expressed first through a massive infrastructure buildout. Data centers, semiconductors, and networking gear are expanding fast. Related infrastructure, including power and cooling systems, are also growing quickly. Research and development of software tools and cloud platforms are seeing rapid growth, too. McKinsey estimates that global data centers may need $6.7 trillion in capital by 2030 [1]. This includes $5.2 trillion for AI workloads. Goldman Sachs predicts that annual AI spending could hit about $765 billion in 2026 and $1.6 trillion by 2031 [2]. The incredible scale of all this is what is grabbing investors’ attention despite limited visibility into how such massive investments will generate sufficient profit.
Great Expectations
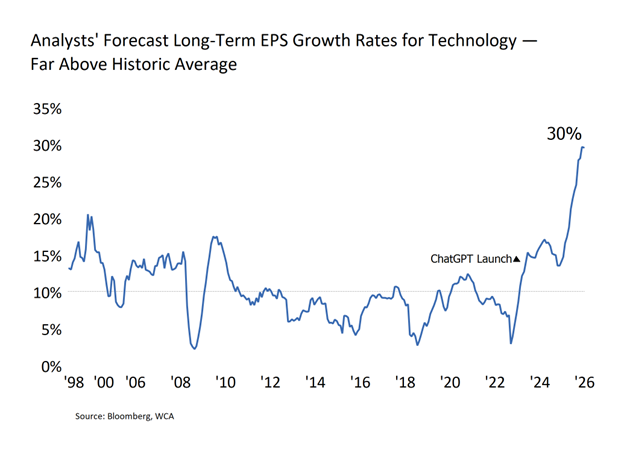
The market’s enthusiasm for AI is understandable, but the role of expectations in valuation cannot be overlooked. The multiples that most investors are looking at to justify today’s valuations depend heavily on discounting extraordinary growth in future earnings. In many cases, share prices are supported by high hopes for massive profit growth, but history shows that times of high expectations can amplify swings in both directions – up swings and down swings. Today, the S&P 500 technology sector trades at 6,728 which is 23 times the next 12-month earnings estimate of $289. This sounds very reasonable. However, that $289 estimate is up nearly 70% from a year ago, and more heady growth is expected, which is carrying all the weight in justifying valuations. In fact, the long-run earnings growth rate, which measures expected earnings growth by analysts over the next several years, has hit an astounding 30%, according to Bloomberg estimates (Chart A, below).
Chart A: S&P 500 Technology Sector Growth Rate Estimates
Why Investment Spending Creates Profits
Capital spending for AI and AI infrastructure has already become a powerful support for reported profits. In short, capital spending by firms comes back to firms as profit and juices up growth for a time. A hyperscaler’s (massive cloud service providers that offer highly scalable computing, networking and storage services) data center investment budget, for example, creates sales for chip makers, networking firms, and electrical equipment suppliers. It also benefits engineering firms, utilities, and construction contractors. The AI investment spending boom gets multiplied throughout the economy, feeds back into profits, and is the main reason why equity market earnings expectations are now as high as they are.
We include a granular discussion of the macroeconomic formula in an end note to this commentary, but for now it suffices to say that rising investment will increase business profits (savings) all else being equal.
Demand For AI Or Demand For AI Investments?
Increasingly, the AI buildout is also becoming a capital-markets phenomenon. Specialized investment vehicles and private credit funds help buy AI infrastructure, and vendor-supported financing also supports these purchases. These structures can help users adopt AI by lowering initial costs, but this kind of financing should not be seen as “business as usual.” The need for AI infrastructure now depends on two things: the demand for AI services and how eager investors are to invest for good returns.
This distinction may prove important as the cycle evolves. Capital is flowing not just because businesses need computing power. The flow of capital is also because investors think AI will bring amazing returns. A question that may become increasingly relevant over time is this: Are AI hardware providers selling chips and other equipment because the world needs this much AI, or because investors are seeking high returns from AI? Today, the answer is likely both.
The next phase of the cycle may further illustrate this dynamic. Several of the most valuable private companies associated with AI, including OpenAI, Anthropic, and SpaceX, are widely expected to eventually access public markets. While the timing and structure of any future offerings remain uncertain, the potential size of these businesses suggests that the supply of AI-related investment opportunities is set to expand. In that sense, the AI boom is not simply driving demand for chips, data centers, and power infrastructure; it is also creating demand for investment vehicles through which investors can seek exposure to the theme.
As long as user demand and investor interest support each other, the cycle can stay very strong (Chart B, below). Strong demand encourages investment. Investment supports revenues and profits. Rising profits reinforce confidence. Confidence attracts additional capital. Additional capital supports further investment. History has shown that capital cycles eventually hit an inflection point. From that inflection point on, investors focused on earning a return on capital invested.
Chart B: The Self-Reinforcing Capital Spending Cycle

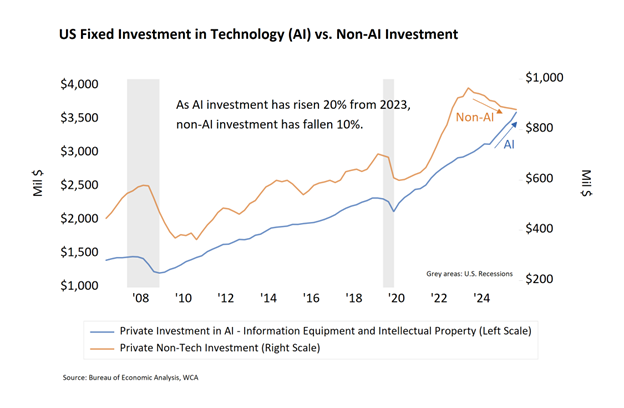
This self-reinforcing cycle can shape dynamics within an economy and among different firms’ ability to compete for capital and investor attention. For example, today’s capital spending growth is focused heavily on business investment in equipment and intellectual property, largely related to AI. Conversely, investment outside of AI is contracting (Chart C, below). An increasingly large share of corporate investment, financing activity, and earnings growth is being tied to a single theme: AI. Capital investment is now narrowly concentrated around the AI thematic just as S&P 500 market capitalization, earnings growth expectations, and stock performance have all become concentrated around artificial intelligence.
Chart C: AI vs Non-AI Investment
The Return-on-Capital Test
The question is what happens when the cycle matures. Will end-user demand for AI services ultimately prove large enough to justify the extraordinary amount of capital being deployed today, or will profits fall short?
The likely long-term winners will be companies that can run a marathon, not a sprint. They need strong balance sheets. Durable profits are important, too. They must fund innovation without relying on always favorable capital markets and they must also get through the cooling-off periods. During these times, investors will almost certainly want more proof of returns on their capital than what they are asking for today.
In our view, the correct posture is to recognize AI as the big technological change that it is, but remain diligent in our strategy of owning quality at a reasonable price. This is why we are invested in AI through a variety of portfolio companies from data centers, to capital equipment providers, to supportive plant, energy, and infrastructure. At the same time, we recognize that today’s boom in capital spending, profit growth, and investor excitement is also subject to the dynamics of past capital spending cycles. For this reason, now is not the time to throw in the towel on maintaining a strong defense.
The long-term success of the cycle depends on demand for AI services. It needs to grow enough to justify the trillions of dollars of capital now being invested in anticipation of AI-related returns. Investing math tells us that when prices are high, all else being equal, future return expectations should be lower, not higher.
What It Means For Our Investors
The investment opportunity may improve as the cycle matures. Disappointments can lead to chances to buy strong innovators at better prices. The goal is to stay invested in strong businesses while avoiding overpaying for unrealistic expectations and remaining flexible enough to invest when the market shifts from excitement to discipline.
We will look for proof that businesses may be able to generate returns on today’s capital investments as we will look to choose quality companies at fair prices.
——————————————————–
[1] Jesse Noffsinger, Mark Patel, and Pankaj Sachdeva, The Cost of Compute: A $7 Trillion Race to Scale Data Centers, McKinsey & Company, April 28, 2025.
[2] George Lee and Lucas Greenbaum, Tracking Trillions: The Assumptions Shaping the Scale of the AI Build-Out, Goldman Sachs Global Institute, May 1, 2026.
Note on Macroeconomic Accounting and Relation to Profits: The starting point for a macroeconomic profit identity is the familiar macroeconomic formula for gross domestic product (GDP). Gross domestic product (GDP) is equal to Consumption (C) + Investment (I) + Government Spending (G) + Exports (X) – Imports (M). GDP is also approximately equal to gross domestic income (GDI), which can be expressed as income that is consumed (C), saved (S), or paid in taxes (T). Setting GDP = GDI and substituting in the constituents for each, we get GDP = C + I + G + (X – M) = C + S + T. We can further divide savings into two parts: household savings (SH) and business savings (SB). Business savings represent the portion of corporate earnings retained within the firm or distributed as dividends to shareholders. We can now solve for business savings using basic algebra. Rearranging the formula yields: SB = (I – SH) + (G – T) + (X – M). In other words, business savings are equal to investment minus household savings plus the government fiscal deficit plus net exports. All else being equal, increases in investment, government spending, or exports and decreases in household savings, taxes, or imports will raise business savings, and vice-versa. Macroeconomics shows us that, holding all else constant, if businesses collectively decide to spend more on factories, software, data centers, equipment, or inventories, that spending creates income somewhere else in the corporate sector, some of which ultimately appears as profits, retained earnings, or dividends. This accounting relationship helps explain why periods of heavy capital spending are frequently associated with rising aggregate profits in the short run. The implication is that large investment booms can support corporate profits even before the underlying projects prove economically successful. The spending itself becomes income somewhere else in the economy.
Kevin R. Caron, CFA
Senior Portfolio Manager
973-549-4051
Chad Morganlander
Senior Portfolio Manager
973-549-4052
Steve Lerit, CFA
Head of Portfolio Risk
973-549-4028
Eric Needham
External Sales and Marketing
312-771-6010
Matthew Battipaglia
Portfolio Manager
973-549-4047
Jeffrey Battipaglia
Client Portfolio Manager
973-549-4031
Suzanne Ashley
Internal Relationship Manager
973-549-4168
Disclosures:
WCA Barometer – We regularly assess changes in fundamental conditions to help guide near-term asset allocation decisions. Analysis incorporates approximately 30 forward-looking indicators in categories ranging from Credit and Capital Markets to U.S. Economic Conditions and Foreign Conditions. From each category of data, we create three diffusion-style sub-indices that measure the trends in the underlying data. Sustained improvement that is spread across a wide variety of observations will produce index readings above 50 (potentially favoring stocks), while readings below 50 would indicate potential deterioration (potentially favoring bonds). The WCA Fundamental Conditions Index combines the three underlying categories into a single summary measure. This measure can be thought of as a “barometer” for changes in fundamental conditions.
Standard & Poor’s 500 Index (S&P 500) is a capitalization-weighted index that is generally considered representative of the U.S. large capitalization market.
The S&P 500® Information Technology comprises those companies included in the S&P 500 that are classified as members of the GICS® information technology sector.
S&P Global (SPGI) is a leading American provider of financial information, analytics, and credit ratings, headquartered in New York, NY. It operates major divisions including S&P Global Ratings, S&P Global Market Intelligence, S&P Global Commodity Insights, S&P Global Mobility, and S&P Dow Jones Indices.
The ICE BofA U.S. High Yield Index is an unmanaged index that tracks the performance of U.S. dollar denominated, below investment-grade rated corporate debt publicly issued in the U.S. domestic market.
The S&P 500 Growth measures constituents from the S&P 500 that are classified as growth stocks based on three factors: sales growth, the ratio of earnings change to price, and momentum.
The S&P 500 Value Index measures constituents from the S&P 500 that are classified as value stocks based on three factors: the ratios of book value, earnings and sales to price.
The S&P 500 Equal Weight Index is the equal-weight version of the widely regarded Standard & Poor’s 500 Index, which is generally considered representative of the U.S. large capitalization market. The index has the same constituents as the capitalization-weighted S&P 500, but each company in the index is allocated a fixed weight of 0.20% at each quarterly rebalancing.
The WCA Rising Dividend Custom Benchmark is a rules-based benchmark constructed by Washington Crossing Advisors to represent a universe of large capitalization U.S. companies that meet certain quality and dividend growth criteria, including proprietary screens for profitability, earnings consistency, and balance sheet strength, along with minimum market capitalization and dividend growth requirements. The benchmark is reconstituted and rebalanced quarterly and is intended to serve as a style-appropriate benchmark for the WCA Rising Dividend strategy.
The Washington Crossing Advisors’ High Quality Index and Low Quality Index are objective, quantitative measures designed to identify quality in the top 1,000 U.S. companies. Ranked by fundamental factors, WCA grades companies from “A” (top quintile) to “F” (bottom quintile). Factors include debt relative to equity, asset profitability, and consistency in performance. Companies with lower debt, higher profitability, and greater consistency earn higher grades. These indices are reconstituted annually and rebalanced daily. For informational purposes only, and WCA Quality Grade indices do not reflect the performance of any WCA investment strategy.
The risk of loss in trading commodities and futures can be substantial. You should therefore carefully consider whether such trading is suitable for you in light of your financial condition. The high degree of leverage that is often obtainable in commodity trading can work against you as well as for you. The use of leverage can lead to large losses as well as gains.
The information contained herein has been prepared from sources believed to be reliable but is not guaranteed by us and is not a complete summary or statement of all available data, nor is it considered an offer to buy or sell any securities referred to herein. Opinions expressed are subject to change without notice and do not take into account the particular investment objectives, financial situation, or needs of individual investors. There is no guarantee that the figures or opinions forecast in this report will be realized or achieved. Employees of Stifel, Nicolaus & Company, Incorporated or its affiliates may, at times, release written or oral commentary, technical analysis, or trading strategies that differ from the opinions expressed within. Past performance is no guarantee of future results. Indices are unmanaged, and you cannot invest directly in an index.
Asset allocation and diversification do not ensure a profit and may not protect against loss. There are special considerations associated with international investing, including the risk of currency fluctuations and political and economic events. Changes in market conditions or a company’s financial condition may impact a company’s ability to continue to pay dividends, and companies may also choose to discontinue dividend payments. Investing in emerging markets may involve greater risk and volatility than investing in more developed countries. Due to their narrow focus, sector-based investments typically exhibit greater volatility. Small-company stocks are typically more volatile and carry additional risks since smaller companies generally are not as well established as larger companies. Property values can fall due to environmental, economic, or other reasons, and changes in interest rates can negatively impact the performance of real estate companies. When investing in bonds, it is important to note that as interest rates rise, bond prices will fall. High-yield bonds have greater credit risk than higher-quality bonds. Bond laddering does not assure a profit or protect against loss in a declining market. The risk of loss in trading commodities and futures can be substantial. You should therefore carefully consider whether such trading is suitable for you in light of your financial condition. The high degree of leverage that is often obtainable in commodity trading can work against you as well as for you. The use of leverage can lead to large losses as well as gains. Changes in market conditions or a company’s financial condition may impact a company’s ability to continue to pay dividends, and companies may also choose to discontinue dividend payments.
All investments involve risk, including loss of principal, and there is no guarantee that investment objectives will be met. It is important to review your investment objectives, risk tolerance, and liquidity needs before choosing an investment style or manager. Equity investments are subject generally to market, market sector, market liquidity, issuer, and investment style risks, among other factors to varying degrees. Fixed Income investments are subject to market, market liquidity, issuer, investment style, interest rate, credit quality, and call risks, among other factors to varying degrees.
Beta is a measure of the volatility, or systematic risk, of a security or a portfolio relative to the market as a whole. A beta of one is considered as risky as the benchmark and is therefore likely to provide expected returns approximate to those of the benchmark during both up and down periods. A portfolio with a beta of two would move approximately twice as much as the benchmark.
Standard deviation is a measure of the volatility of a security’s or portfolio’s returns in relation to the mean return. The larger the standard deviation, the greater the volatility of return in relation to the mean return.
Changes in market conditions or a company’s financial condition may impact a company’s ability to continue to pay dividends, and companies may also choose to discontinue dividend payments
This commentary often expresses opinions about the direction of market, investment sector, and other trends. The opinions should not be considered predictions of future results. The information contained in this report is based on sources believed to be reliable, but is not guaranteed and not necessarily complete.
The securities discussed in this material were selected due to recent changes in the strategies. This selection criterion is not based on any measurement of performance of the underlying security.
Washington Crossing Advisors, LLC is a wholly-owned subsidiary and affiliated SEC Registered Investment Adviser of Stifel Financial Corp (NYSE: SF). Registration with the SEC implies no level of sophistication in investment management.