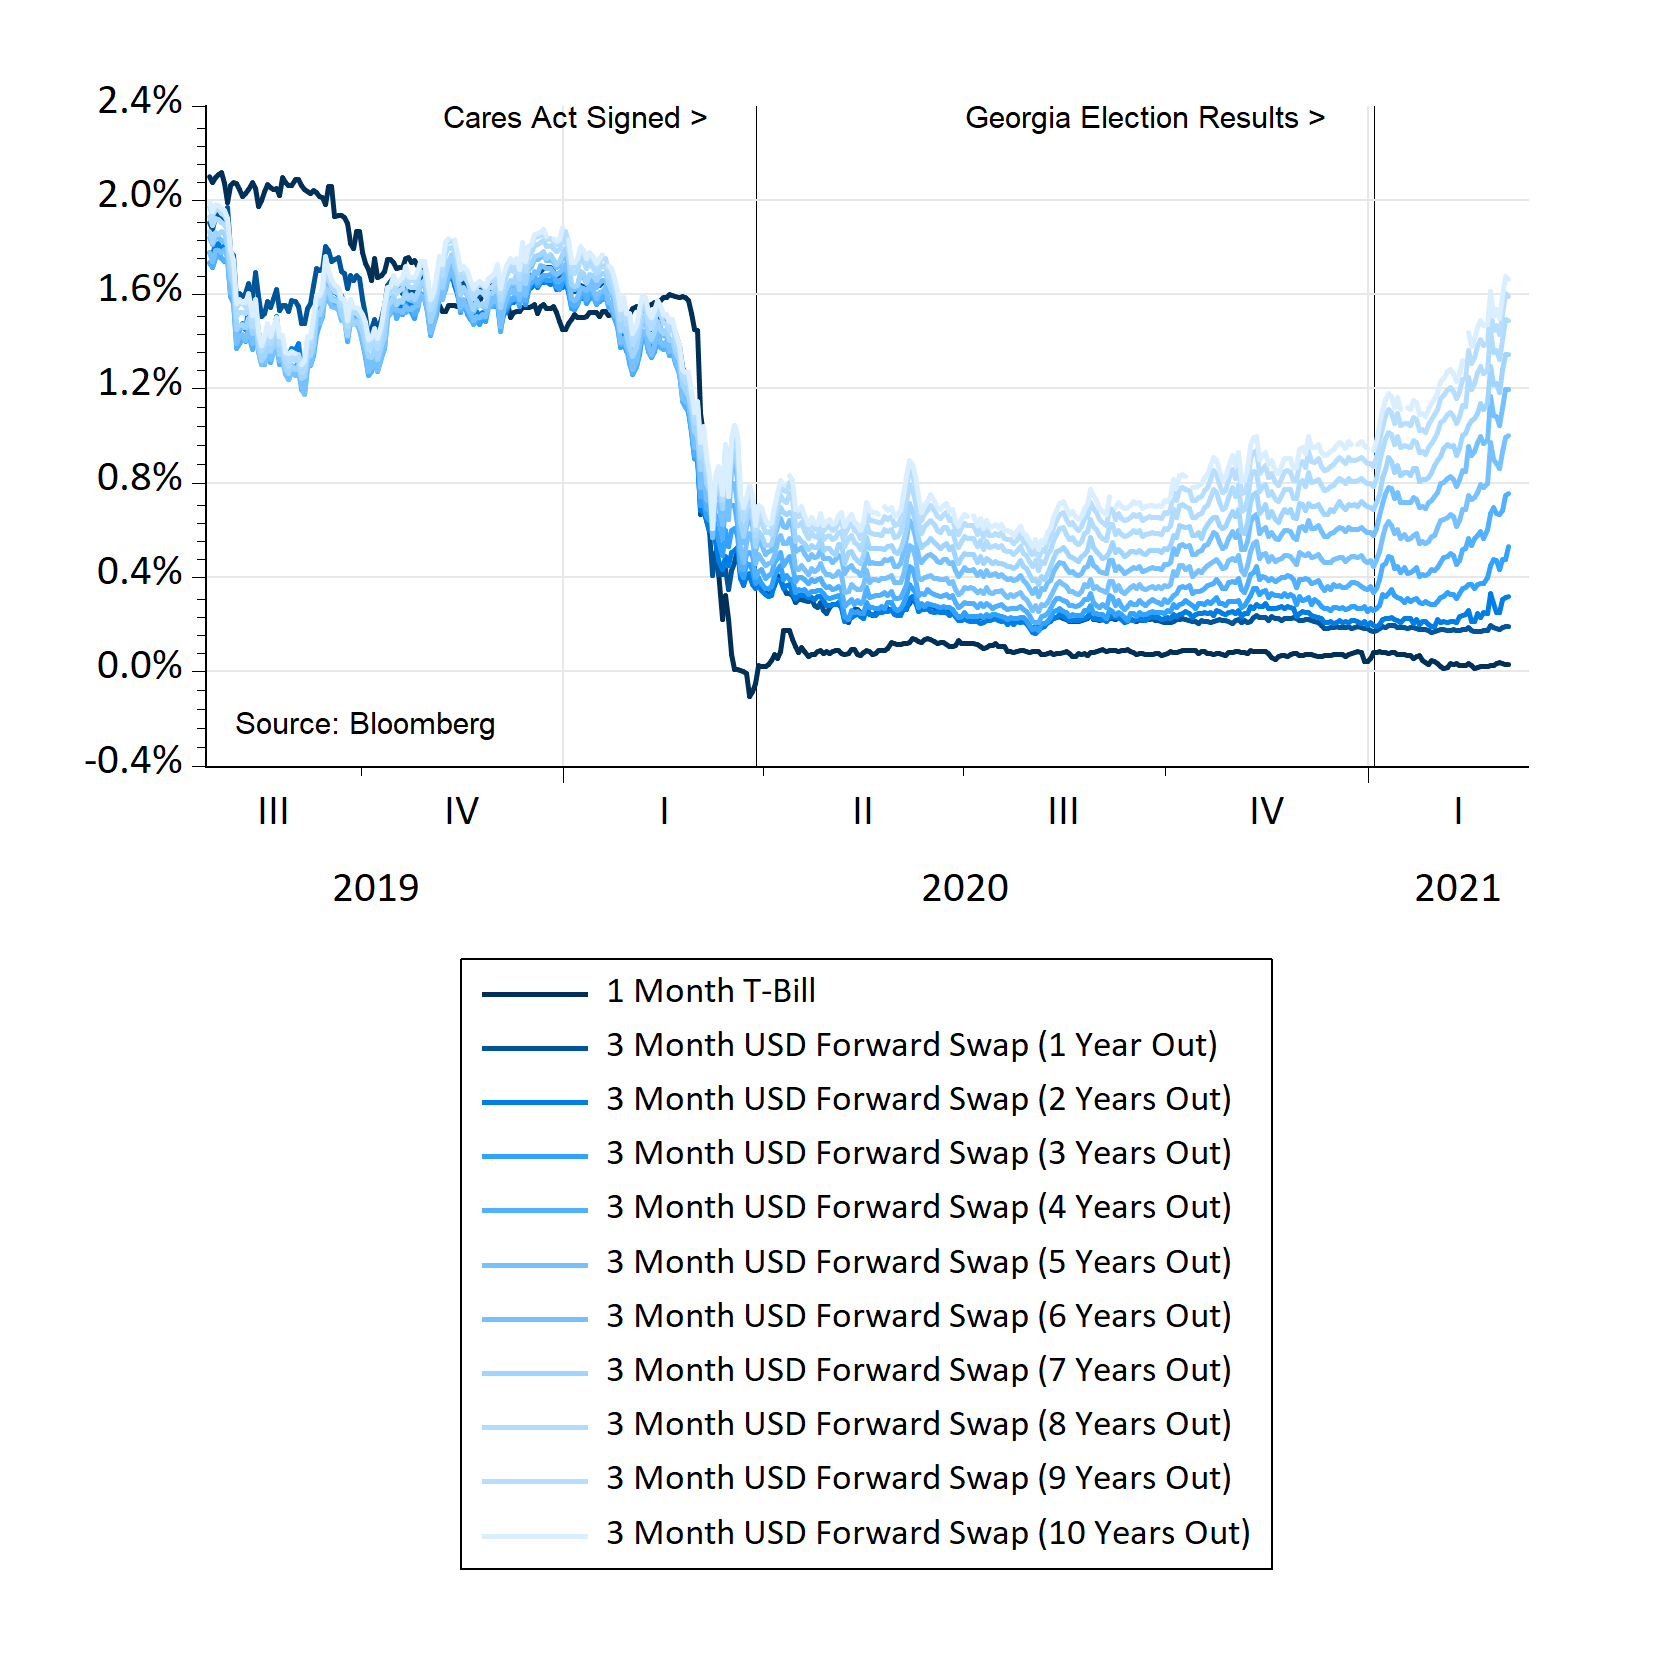
The Rate Conundrum
Since the Georgia Senate races went to Democrats on January 5, forward expectations of short-term rates have moved up sharply (Chart A, below). With nearly $2 trillion of anticipated deficit-financed spending now in the pipeline, long-term U.S. Treasury bonds are also selling off, causing long-term yields to rise too. Investors worry that massive new COVID-19 spending, happening when financial markets are already flashing “risk-on” signals, may be problematic. Typically, such large stimulus occurs only when an uncertain economic outlook is rattling markets.
Chart A
Forwards Markets Start to Envision Higher Rates
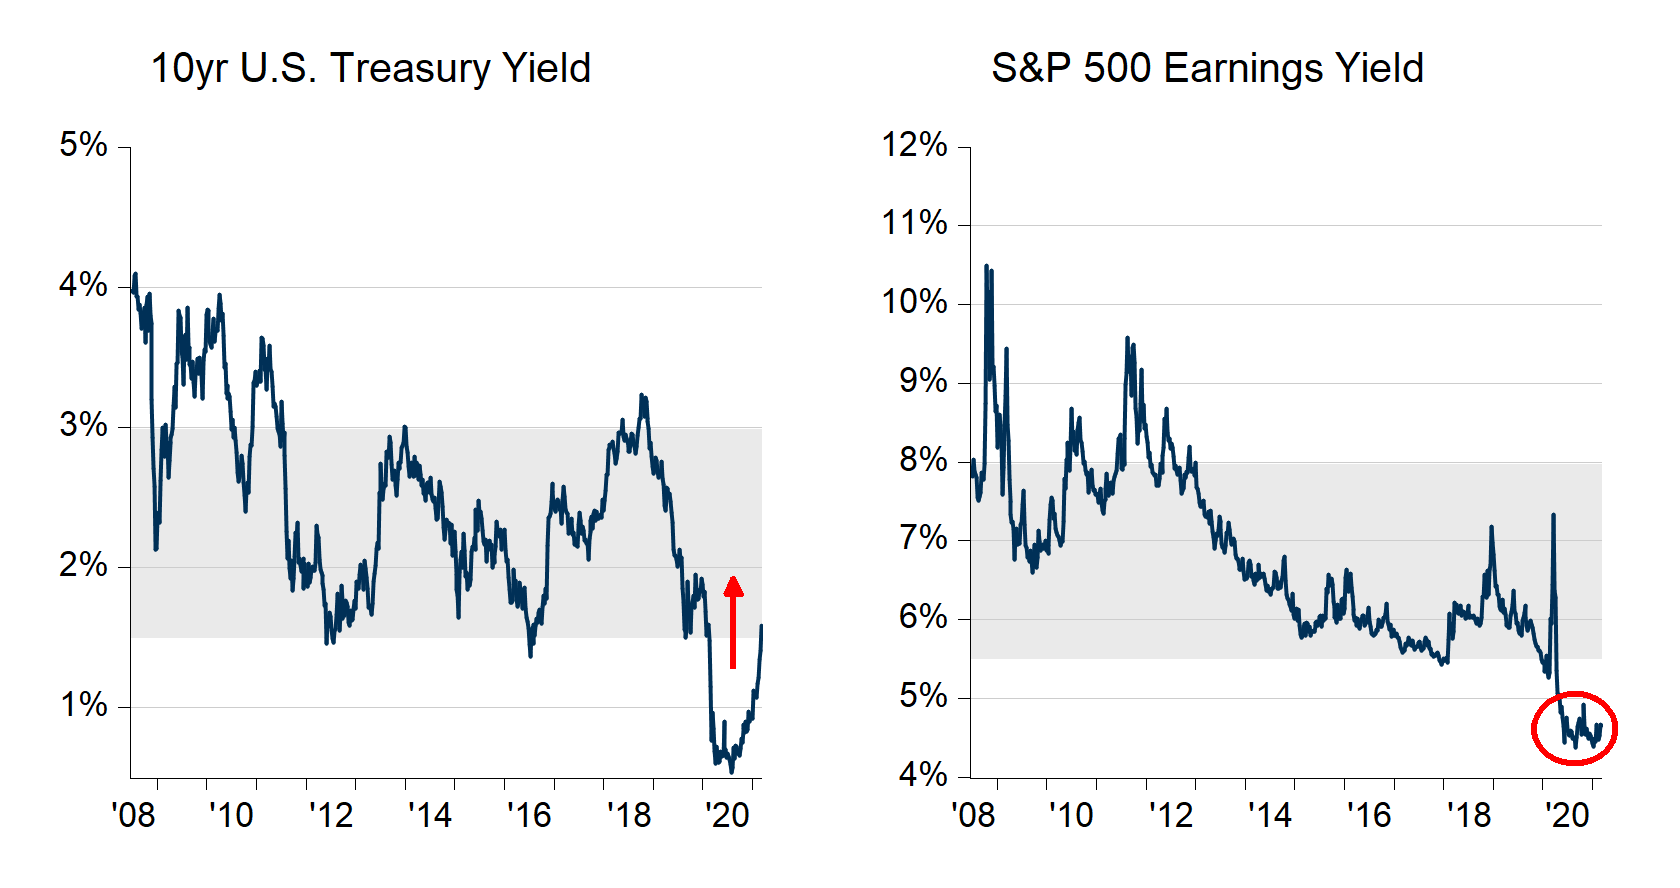
A High Bar
But fear is not really the prevailing mood of today’s market. Record stock prices, tight credit spreads, and firming inflation all point to high hopes and fair expectations. Such thinking pushes down stocks’ forward earnings yield, which remains near cycle lows despite rising interest rates (Chart B, below). Key questions are whether the anticipated stimulus is the primary driver of expectations, or whether markets are more focused on a defeat of COVID-19? Either way, the bar has been set high for growth, and now that growth must be delivered without upsetting the policy applecart.
Chart B
Treasury Bond Yields Rise as Equity Market “Earnings Yield” Remains Low
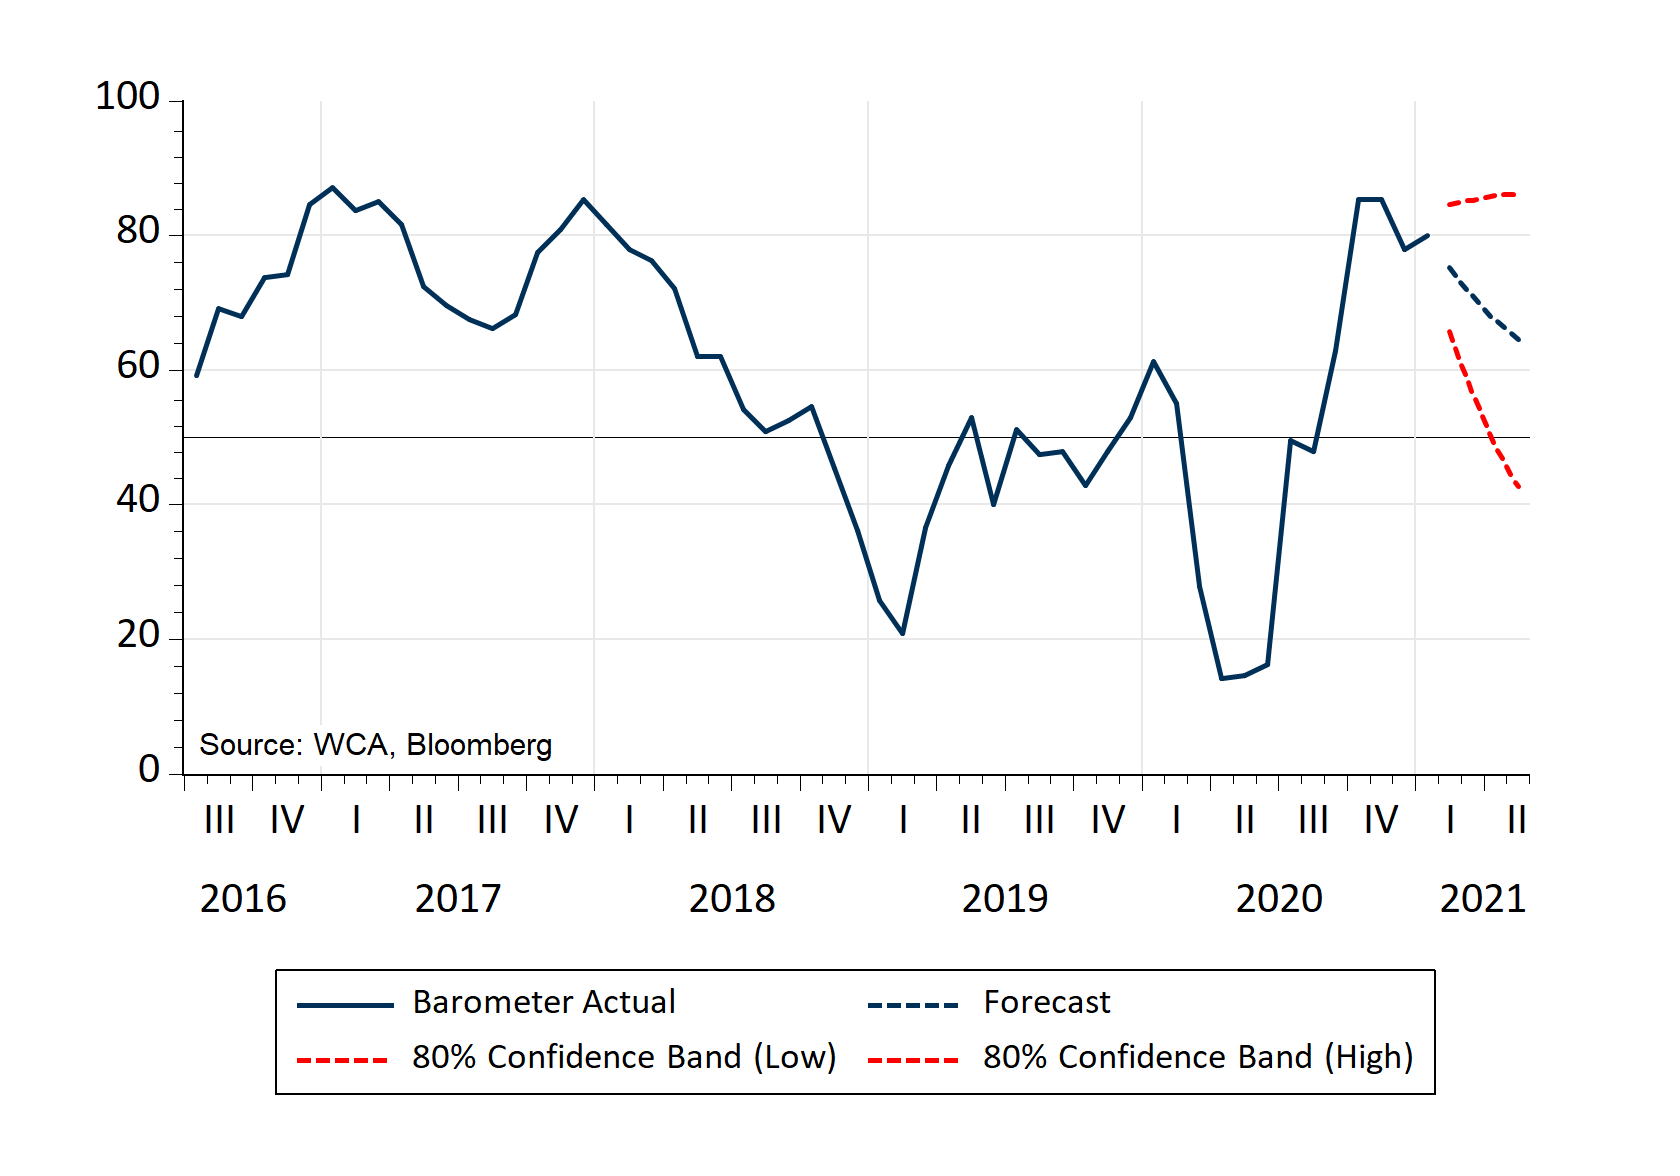
Positive Trends, But Risks Exist
Fortunately, most of the data we examine is trending in a growth-friendly way. Our monthly update of the WCA Fundamental Conditions Barometer remains solidly above 50, but we expect some cooling ahead (Chart C, below). For this reason, we remain overweight stocks in tactical portfolios, having already cut equity exposure a month ago.
Chart C
WCA Conditions “Barometer”
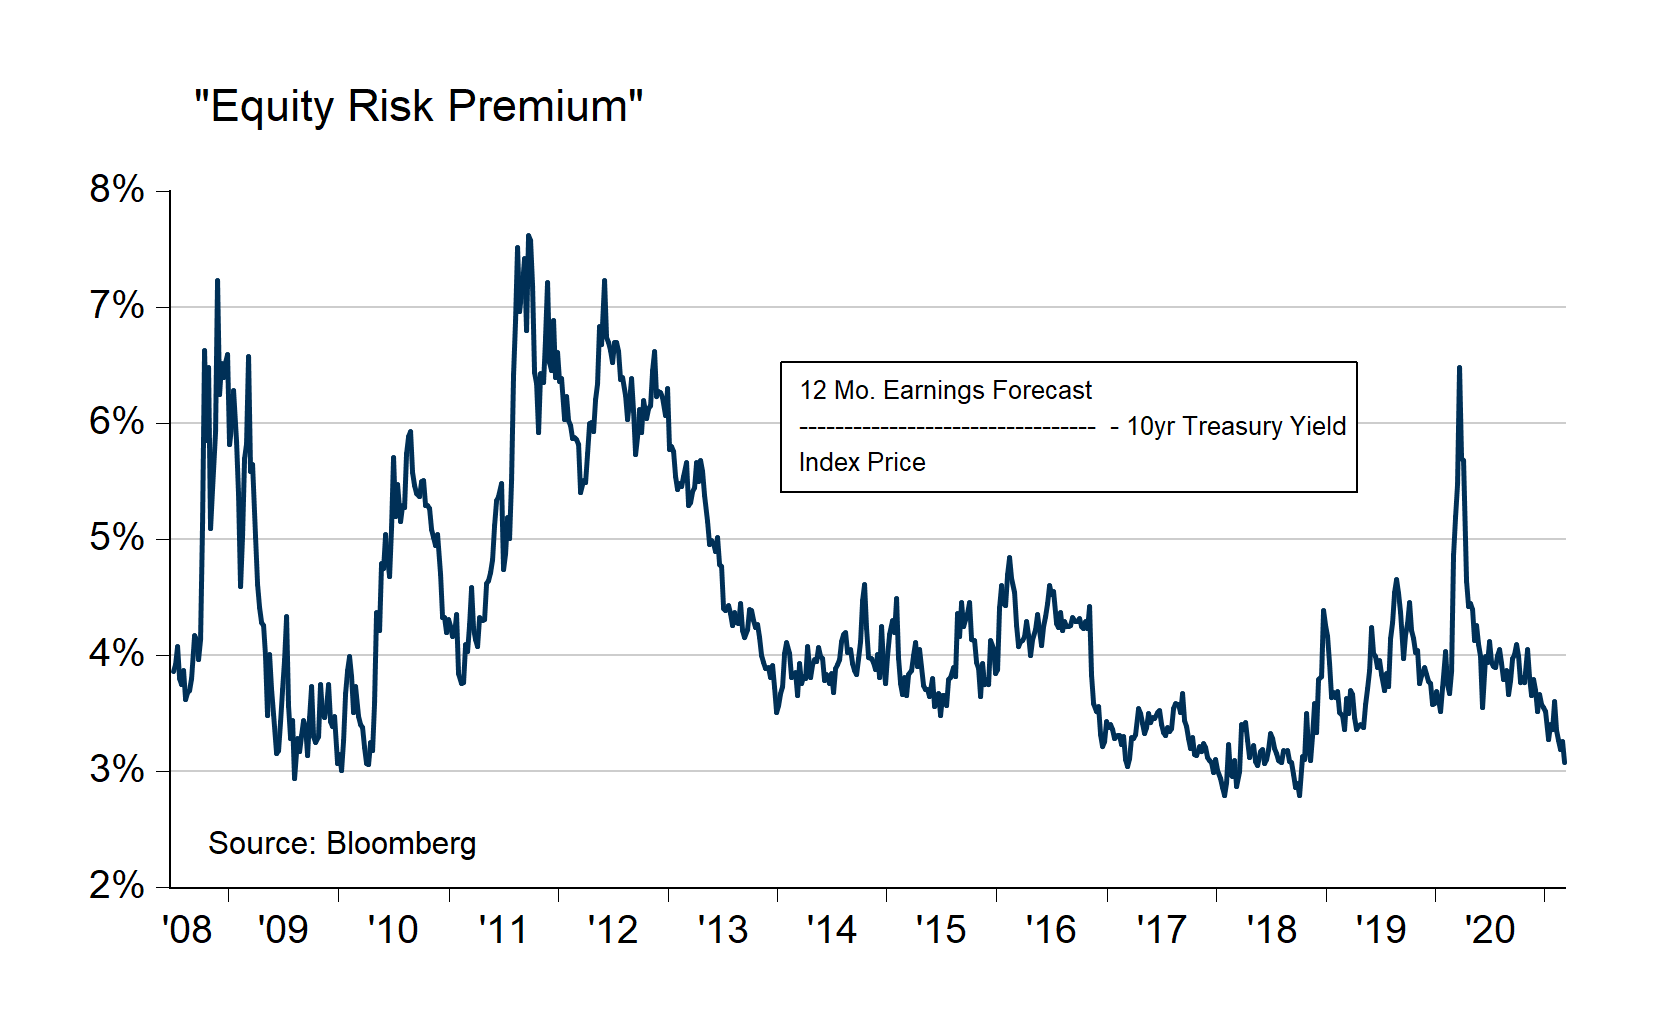
An Important Potential Risk
At the same time, we must acknowledge an important potential risk. That risk is borne of the fact that, in total, valuations for U.S. stocks are high relative to earnings. This can be seen by looking at the forward “earnings yield” for the equity market. The “earnings yield” on the market (inverse of price-to-earnings ratio) now stands near just 4.5%. In recent years the “normal range” was closer to 5.5% to 8. Compared to the long-term U.S. Treasury yield, we see only a small 3% yield advantage. This “reward” for taking on greater risk is near the cycle’s low-end (Chart D, below). Should growth stall or rates push meaningfully higher, the investing public could begin to question whether compensation for the risk taken is adequate. If so, a correction would become all the more likely.
Chart D
U.S. Equity Market “Risk Premium” Near Cycle Lows
Following Data and Facts
For now, we follow where the data and facts lead us. At present, data trends seem to lean more in favor of an optimistic assessment of conditions (WCA Barometer, above). It must be emphasized that the reopening of the modern global economy following an unprecedented shutdown would be a most significant and unqualified success. A ratcheting up of forecasts, especially for the hardest-hit businesses, would likely follow as life begins to return to pre-pandemic “normal.”
To the extent that higher rates are troubling, it is important to keep recent moves in perspective. Specifically, we should note that the past two months’ slide in U.S. Treasury prices (and rise in yields) is quite large by historic standards. It would be very unusual to see yields push higher and higher month after month after month. At some point, investors are likely to take another look at bonds, potentially forestalling an intractable upward march in rates (which would be troubling).
Tactical Posture
For now, we continue to stay overweight stocks, given above-50 readings in our barometer forecast. Still, we are mindful that returns from here could be harder to come by, given already high growth expectations and starting valuations. Later this month, we will revisit our core tactical positioning, which includes tilts toward foreign over domestic, value over growth, short-over-long duration, and high-over-low credit quality.
WCA Fundamental Conditions Barometer:
We regularly assess changes in fundamental conditions to help guide near-term asset allocation decisions. The analysis incorporates approximately 30 forward-looking indicators in categories ranging from Credit and Capital Markets to U.S. Economic Conditions and Foreign Conditions. From each category of data, we create three diffusion-style sub-indices that measure the trends in the underlying data. Sustained improvement that is spread across a wide variety of observations will produce index readings above 50 (potentially favoring stocks), while readings below 50 would indicate potential deterioration (potentially favoring bonds). The WCA Fundamental Conditions Index combines the three underlying categories into a single summary measure. This measure can be thought of as a “barometer” for changes in fundamental conditions.
Disclosures:
WCA Barometer – We regularly assess changes in fundamental conditions to help guide near-term asset allocation decisions. Analysis incorporates approximately 30 forward-looking indicators in categories ranging from Credit and Capital Markets to U.S. Economic Conditions and Foreign Conditions. From each category of data, we create three diffusion-style sub-indices that measure the trends in the underlying data. Sustained improvement that is spread across a wide variety of observations will produce index readings above 50 (potentially favoring stocks), while readings below 50 would indicate potential deterioration (potentially favoring bonds). The WCA Fundamental Conditions Index combines the three underlying categories into a single summary measure. This measure can be thought of as a “barometer” for changes in fundamental conditions.
Standard & Poor’s 500 Index (S&P 500) is a capitalization-weighted index that is generally considered representative of the U.S. large capitalization market.
S&P Global (SPGI) is a leading American provider of financial information, analytics, and credit ratings, headquartered in New York, NY. It operates major divisions including S&P Global Ratings, S&P Global Market Intelligence, S&P Global Commodity Insights, S&P Global Mobility, and S&P Dow Jones Indices.
The ICE BofA U.S. High Yield Index is an unmanaged index that tracks the performance of U.S. dollar denominated, below investment-grade rated corporate debt publicly issued in the U.S. domestic market.
The S&P 500 Growth measures constituents from the S&P 500 that are classified as growth stocks based on three factors: sales growth, the ratio of earnings change to price, and momentum.
The S&P 500 Value Index measures constituents from the S&P 500 that are classified as value stocks based on three factors: the ratios of book value, earnings and sales to price.
The S&P 500 Equal Weight Index is the equal-weight version of the widely regarded Standard & Poor’s 500 Index, which is generally considered representative of the U.S. large capitalization market. The index has the same constituents as the capitalization-weighted S&P 500, but each company in the index is allocated a fixed weight of 0.20% at each quarterly rebalancing.
The WCA Rising Dividend Custom Benchmark is a rules-based benchmark constructed by Washington Crossing Advisors to represent a universe of large capitalization U.S. companies that meet certain quality and dividend growth criteria, including proprietary screens for profitability, earnings consistency, and balance sheet strength, along with minimum market capitalization and dividend growth requirements. The benchmark is reconstituted and rebalanced quarterly and is intended to serve as a style-appropriate benchmark for the WCA Rising Dividend strategy.
The Washington Crossing Advisors’ High Quality Index and Low Quality Index are objective, quantitative measures designed to identify quality in the top 1,000 U.S. companies. Ranked by fundamental factors, WCA grades companies from “A” (top quintile) to “F” (bottom quintile). Factors include debt relative to equity, asset profitability, and consistency in performance. Companies with lower debt, higher profitability, and greater consistency earn higher grades. These indices are reconstituted annually and rebalanced daily. For informational purposes only, and WCA Quality Grade indices do not reflect the performance of any WCA investment strategy.
The risk of loss in trading commodities and futures can be substantial. You should therefore carefully consider whether such trading is suitable for you in light of your financial condition. The high degree of leverage that is often obtainable in commodity trading can work against you as well as for you. The use of leverage can lead to large losses as well as gains.
The information contained herein has been prepared from sources believed to be reliable but is not guaranteed by us and is not a complete summary or statement of all available data, nor is it considered an offer to buy or sell any securities referred to herein. Opinions expressed are subject to change without notice and do not take into account the particular investment objectives, financial situation, or needs of individual investors. There is no guarantee that the figures or opinions forecast in this report will be realized or achieved. Employees of Stifel, Nicolaus & Company, Incorporated or its affiliates may, at times, release written or oral commentary, technical analysis, or trading strategies that differ from the opinions expressed within. Past performance is no guarantee of future results. Indices are unmanaged, and you cannot invest directly in an index.
Asset allocation and diversification do not ensure a profit and may not protect against loss. There are special considerations associated with international investing, including the risk of currency fluctuations and political and economic events. Changes in market conditions or a company’s financial condition may impact a company’s ability to continue to pay dividends, and companies may also choose to discontinue dividend payments. Investing in emerging markets may involve greater risk and volatility than investing in more developed countries. Due to their narrow focus, sector-based investments typically exhibit greater volatility. Small-company stocks are typically more volatile and carry additional risks since smaller companies generally are not as well established as larger companies. Property values can fall due to environmental, economic, or other reasons, and changes in interest rates can negatively impact the performance of real estate companies. When investing in bonds, it is important to note that as interest rates rise, bond prices will fall. High-yield bonds have greater credit risk than higher-quality bonds. Bond laddering does not assure a profit or protect against loss in a declining market. The risk of loss in trading commodities and futures can be substantial. You should therefore carefully consider whether such trading is suitable for you in light of your financial condition. The high degree of leverage that is often obtainable in commodity trading can work against you as well as for you. The use of leverage can lead to large losses as well as gains. Changes in market conditions or a company’s financial condition may impact a company’s ability to continue to pay dividends, and companies may also choose to discontinue dividend payments.
All investments involve risk, including loss of principal, and there is no guarantee that investment objectives will be met. It is important to review your investment objectives, risk tolerance, and liquidity needs before choosing an investment style or manager. Equity investments are subject generally to market, market sector, market liquidity, issuer, and investment style risks, among other factors to varying degrees. Fixed Income investments are subject to market, market liquidity, issuer, investment style, interest rate, credit quality, and call risks, among other factors to varying degrees.
Beta is a measure of the volatility, or systematic risk, of a security or a portfolio relative to the market as a whole. A beta of one is considered as risky as the benchmark and is therefore likely to provide expected returns approximate to those of the benchmark during both up and down periods. A portfolio with a beta of two would move approximately twice as much as the benchmark.
Standard deviation is a measure of the volatility of a security’s or portfolio’s returns in relation to the mean return. The larger the standard deviation, the greater the volatility of return in relation to the mean return.
Changes in market conditions or a company’s financial condition may impact a company’s ability to continue to pay dividends, and companies may also choose to discontinue dividend payments
This commentary often expresses opinions about the direction of market, investment sector, and other trends. The opinions should not be considered predictions of future results. The information contained in this report is based on sources believed to be reliable, but is not guaranteed and not necessarily complete.
The securities discussed in this material were selected due to recent changes in the strategies. This selection criterion is not based on any measurement of performance of the underlying security.
Washington Crossing Advisors, LLC is a wholly-owned subsidiary and affiliated SEC Registered Investment Adviser of Stifel Financial Corp (NYSE: SF). Registration with the SEC implies no level of sophistication in investment management.


