The Muddled Middle (But Improving)
It is hard to conclude almost anything with certainty amid this pandemic. Are schools open? Or closed? Or half-open and half-closed? There seems to be less unanimity in Congress on policy issues. The size of continued supplemental unemployment benefits was at issue before this weekend’s executive order. Republicans favored a $200 additional benefit, and Democrats wanted $600. President Trump’s $400 figure falls neatly in the middle of the $200-$600 range, but questions over the order and funding for the order remain. The “muddled middle” will have to suffice for now, but, by comparison, today’s situation is far better than where we stood back in March.
The Story in the Data
After the spring shutdown, the main story of May-July was “reopening.” Shortages, bottlenecks, and empty shelves are mostly gone. Some restaurants have been able to reopen with modified service. Some students will return to school in the fall, while others will attend online. All of this is directionally good for a struggling economy, but a long way from “normal.” Let’s take a look at a handful of other data points we track.
Some Observations
- Automobile Sales — July’s automobile sales rose to 14.5 million units, up 11% from June’s 13.3 million unit pace;
- Jobless Claims — Weekly jobless claims averaged 1.4 million in July, down 700,000 a week from June;
- Manufacturing Orders — Orders rose faster than inventories for the second straight month in a row in July;
- Flights — Commercial flights exceeded 70,000 for the first time last week, far better than the 25,000 average last spring;
- Weekly Activity — The New York Federal Reserve’s Weekly Economic Index is now about halfway back to pre-pandemic levels.
Markets also continue to behave well. For example, the S&P 500 and Dow Jones Industrial Average are back to break even for the year, and participation is broad-based. Also, the advance-decline line for the New York Stock Exchange remained above the three-month average through July, a bullish trend. Moreover, default probabilities priced into corporate bonds appear to be falling based on trends in spreads between Baa-rated corporate bond yields and U.S. Treasuries. For example, the average credit spread was 290 basis points (2.9%) in July versus a 3-month average of 320 basis points (3.2%). Lastly, trends in stocks and corporate bonds signal improvement, likely reflecting a combination of supportive policies and less investor nervousness.
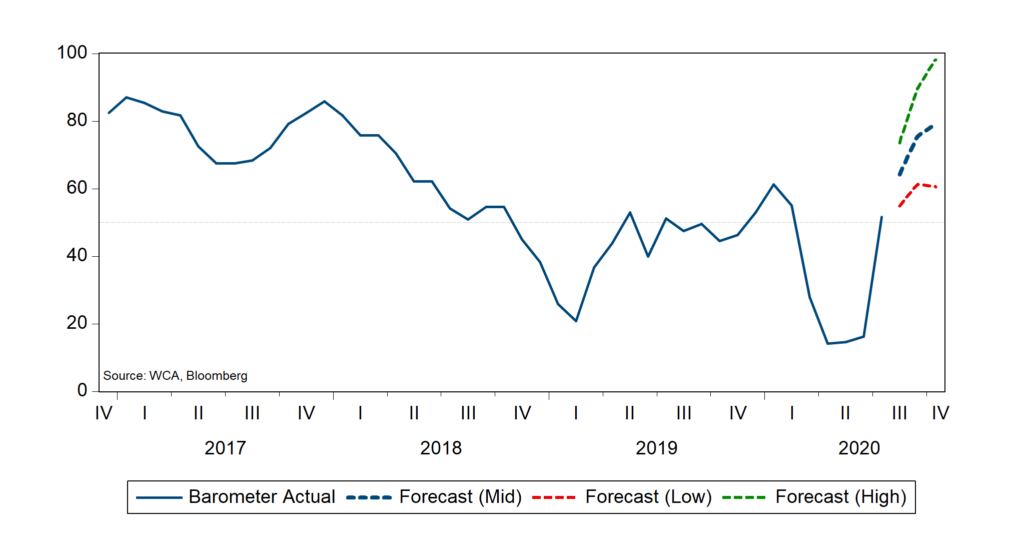
Our own WCA Fundamental Conditions Barometer (graph, below) returned to a neutral reading near 50 with expectations for further improvement into the fall. A bullish case could include continued policy supports, progress toward a COVID-19 vaccine or treatment, and absence of a significant spike in COVID-19 cases and deaths. Politics will also come into focus due to upcoming elections in the fall, potentially introducing some new uncertainties. For now, we must acknowledge that, while murky and imperfect, most of the data seems to be headed in the right direction after a most challenging spring.
Chart 1
WCA Fundamental Conditions Barometer
Portfolio Posture
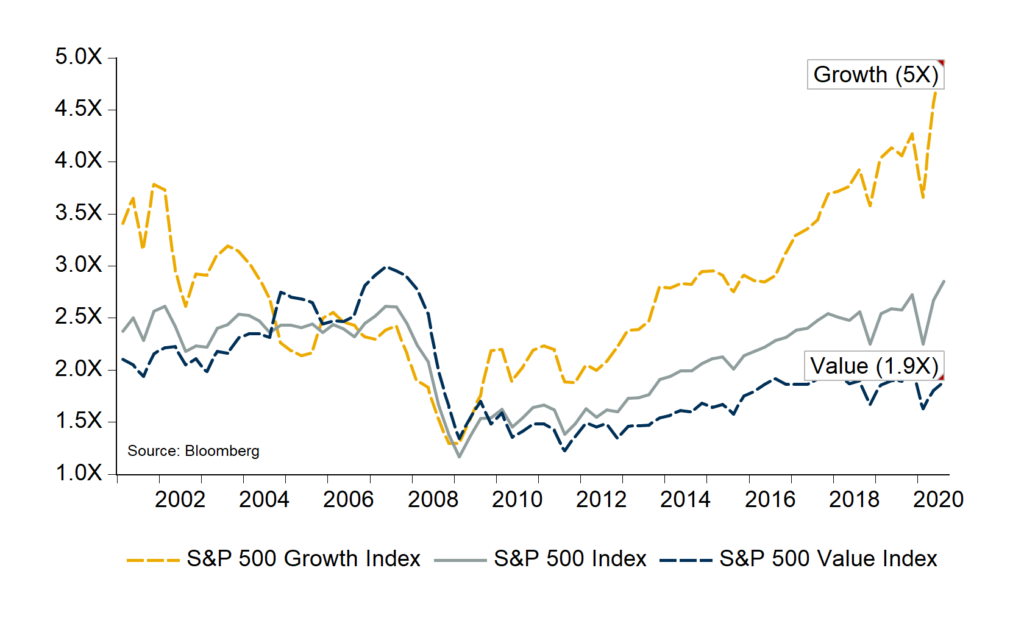
CONQUEST portfolios are tactically tilted toward stocks over bonds, given the forecast path for our barometer, above. A tilt toward gold exists in the core as the dollar weakens, and the Federal Reserve continues to grow its balance sheet amid mounting fiscal deficits. Portfolios are light on emerging markets as debt levels are high, and commodity prices are slow to recover. High relative valuations for growth compared to value (chart, below) leaves us with a tilt toward value in the core of CONQUEST portfolios.
Chart 2
Valuation: S&P Growth vs. Value
(Enterprise Value to Sales Ratio)
Conclusion
As you can see, we remain in the “muddled middle” — halfway between shutdown and recovery. For now, we are focusing on the trend “improvement” part of the equation.
WCA Fundamental Conditions Barometer:
We regularly assess changes in fundamental conditions to help guide near-term asset allocation decisions. The analysis incorporates approximately 30 forward-looking indicators in categories ranging from Credit and Capital Markets to U.S. Economic Conditions and Foreign Conditions. From each category of data, we create three diffusion-style sub-indices that measure the trends in the underlying data. Sustained improvement that is spread across a wide variety of observations will produce index readings above 50 (potentially favoring stocks), while readings below 50 would indicate potential deterioration (potentially favoring bonds). The WCA Fundamental Conditions Index combines the three underlying categories into a single summary measure. This measure can be thought of as a “barometer” for changes in fundamental conditions.
S&P 500 — The Standard & Poor’s 500 Index is a capitalization-weighted index that is generally considered representative of the U.S. large capitalization market.
Indices are unmanaged, and it is not possible to invest directly in an index. All benchmark returns presented are provided to represent the investment environment existing during the time periods shown. Actual investment performance will vary due to fees and expenses. For comparison purposes, the benchmarks include the reinvestment of income. The benchmarks are unmanaged and unavailable for direct investment.
The S&P 500 High Beta Index measures the performance of 100 constituents in the S&P 500 that are most sensitive to changes in the market. Constituents are weighted relative to their level of market sensitivity, with each stock assigned a weight proportional to its beta.
The S&P 500 Low Volatility Index measures performance of the 100 least volatile stocks in the S&P 500. The index benchmarks low volatility or low variance strategies for the U.S. stock market. Constituents are weighted relative to the inverse of their corresponding volatility, with the least volatile stocks receiving the highest weights.
Disclosures:
WCA Barometer – We regularly assess changes in fundamental conditions to help guide near-term asset allocation decisions. Analysis incorporates approximately 30 forward-looking indicators in categories ranging from Credit and Capital Markets to U.S. Economic Conditions and Foreign Conditions. From each category of data, we create three diffusion-style sub-indices that measure the trends in the underlying data. Sustained improvement that is spread across a wide variety of observations will produce index readings above 50 (potentially favoring stocks), while readings below 50 would indicate potential deterioration (potentially favoring bonds). The WCA Fundamental Conditions Index combines the three underlying categories into a single summary measure. This measure can be thought of as a “barometer” for changes in fundamental conditions.
Standard & Poor’s 500 Index (S&P 500) is a capitalization-weighted index that is generally considered representative of the U.S. large capitalization market.
S&P Global (SPGI) is a leading American provider of financial information, analytics, and credit ratings, headquartered in New York, NY. It operates major divisions including S&P Global Ratings, S&P Global Market Intelligence, S&P Global Commodity Insights, S&P Global Mobility, and S&P Dow Jones Indices.
The ICE BofA U.S. High Yield Index is an unmanaged index that tracks the performance of U.S. dollar denominated, below investment-grade rated corporate debt publicly issued in the U.S. domestic market.
The S&P 500 Growth measures constituents from the S&P 500 that are classified as growth stocks based on three factors: sales growth, the ratio of earnings change to price, and momentum.
The S&P 500 Value Index measures constituents from the S&P 500 that are classified as value stocks based on three factors: the ratios of book value, earnings and sales to price.
The S&P 500 Equal Weight Index is the equal-weight version of the widely regarded Standard & Poor’s 500 Index, which is generally considered representative of the U.S. large capitalization market. The index has the same constituents as the capitalization-weighted S&P 500, but each company in the index is allocated a fixed weight of 0.20% at each quarterly rebalancing.
The WCA Rising Dividend Custom Benchmark is a rules-based benchmark constructed by Washington Crossing Advisors to represent a universe of large capitalization U.S. companies that meet certain quality and dividend growth criteria, including proprietary screens for profitability, earnings consistency, and balance sheet strength, along with minimum market capitalization and dividend growth requirements. The benchmark is reconstituted and rebalanced quarterly and is intended to serve as a style-appropriate benchmark for the WCA Rising Dividend strategy.
The Washington Crossing Advisors’ High Quality Index and Low Quality Index are objective, quantitative measures designed to identify quality in the top 1,000 U.S. companies. Ranked by fundamental factors, WCA grades companies from “A” (top quintile) to “F” (bottom quintile). Factors include debt relative to equity, asset profitability, and consistency in performance. Companies with lower debt, higher profitability, and greater consistency earn higher grades. These indices are reconstituted annually and rebalanced daily. For informational purposes only, and WCA Quality Grade indices do not reflect the performance of any WCA investment strategy.
The risk of loss in trading commodities and futures can be substantial. You should therefore carefully consider whether such trading is suitable for you in light of your financial condition. The high degree of leverage that is often obtainable in commodity trading can work against you as well as for you. The use of leverage can lead to large losses as well as gains.
The information contained herein has been prepared from sources believed to be reliable but is not guaranteed by us and is not a complete summary or statement of all available data, nor is it considered an offer to buy or sell any securities referred to herein. Opinions expressed are subject to change without notice and do not take into account the particular investment objectives, financial situation, or needs of individual investors. There is no guarantee that the figures or opinions forecast in this report will be realized or achieved. Employees of Stifel, Nicolaus & Company, Incorporated or its affiliates may, at times, release written or oral commentary, technical analysis, or trading strategies that differ from the opinions expressed within. Past performance is no guarantee of future results. Indices are unmanaged, and you cannot invest directly in an index.
Asset allocation and diversification do not ensure a profit and may not protect against loss. There are special considerations associated with international investing, including the risk of currency fluctuations and political and economic events. Changes in market conditions or a company’s financial condition may impact a company’s ability to continue to pay dividends, and companies may also choose to discontinue dividend payments. Investing in emerging markets may involve greater risk and volatility than investing in more developed countries. Due to their narrow focus, sector-based investments typically exhibit greater volatility. Small-company stocks are typically more volatile and carry additional risks since smaller companies generally are not as well established as larger companies. Property values can fall due to environmental, economic, or other reasons, and changes in interest rates can negatively impact the performance of real estate companies. When investing in bonds, it is important to note that as interest rates rise, bond prices will fall. High-yield bonds have greater credit risk than higher-quality bonds. Bond laddering does not assure a profit or protect against loss in a declining market. The risk of loss in trading commodities and futures can be substantial. You should therefore carefully consider whether such trading is suitable for you in light of your financial condition. The high degree of leverage that is often obtainable in commodity trading can work against you as well as for you. The use of leverage can lead to large losses as well as gains. Changes in market conditions or a company’s financial condition may impact a company’s ability to continue to pay dividends, and companies may also choose to discontinue dividend payments.
All investments involve risk, including loss of principal, and there is no guarantee that investment objectives will be met. It is important to review your investment objectives, risk tolerance, and liquidity needs before choosing an investment style or manager. Equity investments are subject generally to market, market sector, market liquidity, issuer, and investment style risks, among other factors to varying degrees. Fixed Income investments are subject to market, market liquidity, issuer, investment style, interest rate, credit quality, and call risks, among other factors to varying degrees.
Beta is a measure of the volatility, or systematic risk, of a security or a portfolio relative to the market as a whole. A beta of one is considered as risky as the benchmark and is therefore likely to provide expected returns approximate to those of the benchmark during both up and down periods. A portfolio with a beta of two would move approximately twice as much as the benchmark.
Standard deviation is a measure of the volatility of a security’s or portfolio’s returns in relation to the mean return. The larger the standard deviation, the greater the volatility of return in relation to the mean return.
Changes in market conditions or a company’s financial condition may impact a company’s ability to continue to pay dividends, and companies may also choose to discontinue dividend payments
This commentary often expresses opinions about the direction of market, investment sector, and other trends. The opinions should not be considered predictions of future results. The information contained in this report is based on sources believed to be reliable, but is not guaranteed and not necessarily complete.
The securities discussed in this material were selected due to recent changes in the strategies. This selection criterion is not based on any measurement of performance of the underlying security.
Washington Crossing Advisors, LLC is a wholly-owned subsidiary and affiliated SEC Registered Investment Adviser of Stifel Financial Corp (NYSE: SF). Registration with the SEC implies no level of sophistication in investment management.


