The Most Dangerous Comparison in Investing
If you own a diversified, quality-oriented portfolio, the last year has likely been frustrating. Conservative strategies—including many dividend-focused portfolios—have lagged the S&P 500, even as markets have risen sharply.
That gap naturally raises questions. Why has your carefully constructed strategy trailed the S&P 500? And should you reconsider your approach?
Before answering, consider what happened the last time investors faced this choice.
In March 2000, a newly retired couple sat down with $1 million, a 4% withdrawal plan, and a portfolio full of the market’s biggest winners. Over the previous decade, technology stocks had made them millionaires. The future had never looked brighter.
Two and a half years later, 85% of it was gone.
The Nasdaq didn’t return to its March 2000 high until 2015. By then, the retiree would have been 85 years old—assuming anything remained after fifteen years of withdrawals from a decimated portfolio.
This is not ancient history. And the conditions that made it possible are forming again.
What’s Happening Right Now
The S&P 500 is the world’s most widely followed market index. Trillions of dollars are invested in or benchmarked to it. But beneath the surface, the character of its returns has changed in an important way.
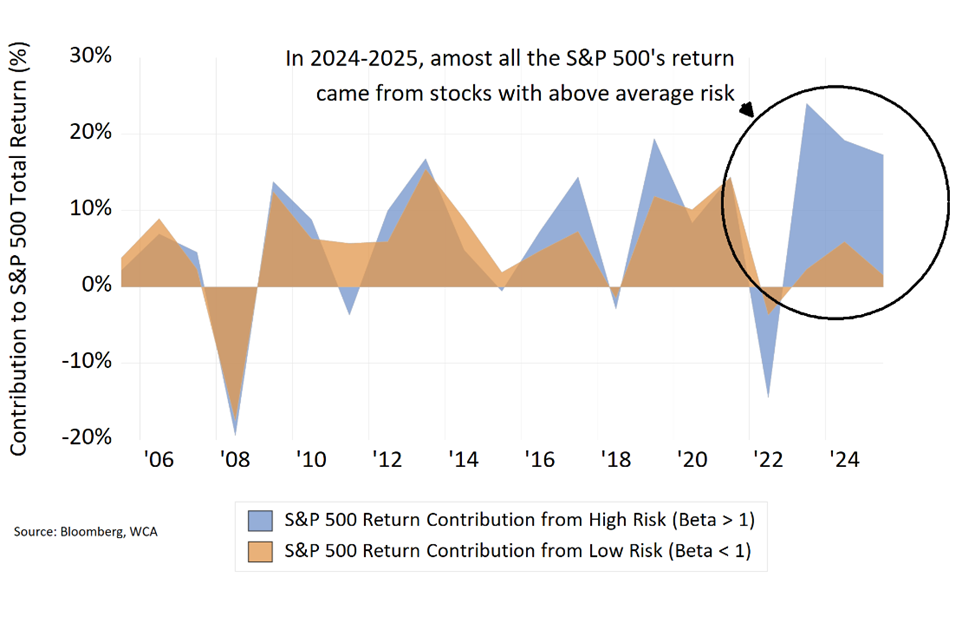
Over the past three years, 83% of the S&P 500’s gains have come from stocks with above-average risk (chart, below). This degree of concentration is highly unusual. Historically, returns have been shared more evenly between higher-risk and lower-risk stocks.
Where Are S&P 500 Returns Coming From?
Over the past two decades, higher-risk stocks have earned roughly 3 percentage points more per year before adjusting for risk. But they have also exhibited nearly double the volatility of lower-risk stocks. Once that additional volatility is taken into account, the apparent advantage disappears. In fact, on a risk-adjusted basis, lower-risk stocks have historically produced better outcomes, while higher-risk stocks have delivered inferior results.*
This distinction matters. Markets do not reward return in isolation—they reward return per unit of risk. When you ignore that risk, performance comparisons become misleading.
The chart accompanying this commentary illustrates the shift clearly. For most of the past twenty years, high-risk and low-risk stocks contributed together to market returns. That balance has broken down. Since 2023, nearly all of the index’s gains have come from the riskiest portion of the market. This helps explain why your portfolio has lagged—not because your strategy is flawed, but because the market is currently rewarding risk in an unusually concentrated way.
The Index That Doesn’t Know You’re Retired
Here’s an important distinction you may not have considered: the S&P 500 was designed to measure market performance—not to serve as an investment strategy.
According to its own published methodology, the index is not an investment advisor and makes no representation regarding the advisability of investing. It doesn’t consider your goals, your risk tolerance, your time horizon, or your income needs. It simply weights companies by market value, increasing exposure to stocks as their prices rise—regardless of valuation or risk.
This structure naturally embeds momentum. It works well during periods when rising prices feed on themselves. But it offers no mechanism designed toward managing risk, protecting your income, or adapting to your changing circumstances.
Your advisor helps you work through those things. Together, you’ve thought through full market cycles, balancing growth, income, liquidity, and risk. That distinction matters most during periods like this—when markets reward speculation and penalize patience.
Not a Strategy
No army goes to war without a plan for defense. The word strategy itself comes from the Greek stratigos—combining stratos (army) and agein (to lead). A general who marches into battle with no plan for when things go wrong isn’t employing a strategy. He’s just advancing and hoping.
We don’t know a single financial advisor who manages money this way. Advisors think carefully about risk, return, liquidity, time horizon, and tax implications. They build plans that accommodate the reality that conditions change—sometimes without warning. From your work with your advisor, a real strategy emerges that is designed to see you through your whole investing horizon, not just one kind of market environment.
The S&P 500 offers none of this. It cannot, because it was never designed to. And yet trillions of dollars are invested or benchmarked to it, as if it were.
Why Your Portfolio is Built Differently
Your portfolio is built for a purpose. That purpose is to deliver a steady stream of income from quality companies. Flexibility, durability, and predictability are the watchwords for the portfolio. The WCA Rising Dividend strategy wasn’t designed to capture every point of upside in a momentum-driven market. It was designed to help you stay invested through all market conditions—including the painful reversals that often follow speculative runs.
That means owning quality companies with durable businesses, consistent cash flows, and growing dividends. These aren’t the stocks that lead during speculative phases. But they are the stocks that have historically provided ballast when markets turn, income when you need it, and participation in long-term growth without the extreme volatility that can derail a retirement plan.
When you compare your portfolio to the S&P 500 right now, you’re comparing a strategy built for stability against an index that is currently dominated by its riskiest components. That’s not an apples-to-apples comparison. It’s one of the most dangerous comparisons in investing.
Why This Cannot Continue Indefinitely
Markets eventually correct excesses.
Many of today’s most popular stocks are priced for extremely high growth rates extending far into the future. But no company can sustainably outgrow the economy it operates in. At some point, expectations must converge with reality.
There is also the issue of crowding. Trillions of dollars have flowed into the same narrow group of stocks through index funds and retirement plans. Prices rise not solely because of fundamentals, but because capital continues to follow the same path. This momentum can persist—but when it reverses, it often does so abruptly.
History is filled with examples. The “Nifty Fifty” of the 1970s, the dot-com leaders of the late 1990s, and the financial stocks that dominated before 2008 all shared the same narrative: a belief that this time was different. Each time, leadership eventually changed, and investors who chased it paid a steep price.
What This Means for You
When you invest in a strategy that tracks the S&P 500, you’re not making a single investment. You’re holding two very different exposures—high-risk and low-risk stocks—blended together in proportions that shift dramatically over time without your input.
Today, nearly all of the index’s return is coming from the riskiest side of that mix.
That matters because risk and return are inseparable. The same high-beta stocks delivering outsized gains today were the ones that fell sharply in prior downturns. The index makes no distinction between a 30-year-old with decades to recover and you, if you’re drawing income or approaching retirement.
Your portfolio was designed with those realities in mind. It may lag during speculative phases, but it was built to endure across full cycles—not just the most aggressive ones.
Trust the Strategy You Built
Your investment strategy was not chosen casually. You and your advisor built it through thoughtful discussion about risk, time horizon, income needs, and long-term goals. It was designed to function in many market environments—including periods exactly like this one.
Now is not the time to abandon that discipline.
When market leadership eventually shifts—as it always has—the question will not be whether you captured every last point of upside. It will be whether your strategy preserved your capital, supported your income, and stayed aligned with your long-term purpose.
Key Takeaways
Over the past three years, 83% of the S&P 500’s gains have come from high-risk stocks—a historic concentration that cannot persist indefinitely.
Once you adjust for volatility, lower-risk stocks have historically outperformed on a risk-adjusted basis. You’re not missing out on “free” returns; you’re avoiding uncompensated risk.
The S&P 500 was never designed to be an investment strategy. It has no awareness of your goals, your timeline, or your need for stability.
Your portfolio was intentionally built to prioritize quality, income, and durability over momentum. That’s not a flaw—it’s the design working as intended.
Chasing the index now may mean abandoning a strategy built for the long term in favor of one that offers no downside protection.
Next Steps
If this commentary raises questions about your portfolio or how it fits your goals, that’s a conversation worth having. Reach out to your advisor to discuss what you’ve read here, review how your strategy is positioned, and make sure you’re comfortable with the plan you have in place.
The best time to reaffirm your strategy is before the market tests it—not after.
For anyone interested in a deeper dive into the breakdown of S&P 500 behavior by risk, please see our 20-year S&P 500 Risk & Attribution (2005-2025) study. The study is available under the Insights section at www.washingtoncrossingadvisors.com.
*Regression analysis of the S&P 500 for 2005-2025 of high risk companies (Beta>1) and low risk companies (Beta<1):
• High risk companies: implied Beta = 1.3, Alpha = -0.9%
• Low risk companies: implied Beta = 0.7, Alpha = +0.8%
Kevin R. Caron, CFA
Senior Portfolio Manager
973-549-4051
Chad Morganlander
Senior Portfolio Manager
973-549-4052
Steve Lerit, CFA
Head of Portfolio Risk
973-549-4028
Eric Needham
External Sales and Marketing
312-771-6010
Matthew Battipaglia
Portfolio Manager
973-549-4047
Jeffrey Battipaglia
Client Portfolio Manager
973-549-4031
Suzanne Ashley
Internal Relationship Manager
973-549-4168
Disclosures:
WCA Barometer – We regularly assess changes in fundamental conditions to help guide near-term asset allocation decisions. Analysis incorporates approximately 30 forward-looking indicators in categories ranging from Credit and Capital Markets to U.S. Economic Conditions and Foreign Conditions. From each category of data, we create three diffusion-style sub-indices that measure the trends in the underlying data. Sustained improvement that is spread across a wide variety of observations will produce index readings above 50 (potentially favoring stocks), while readings below 50 would indicate potential deterioration (potentially favoring bonds). The WCA Fundamental Conditions Index combines the three underlying categories into a single summary measure. This measure can be thought of as a “barometer” for changes in fundamental conditions.
Standard & Poor’s 500 Index (S&P 500) is a capitalization-weighted index that is generally considered representative of the U.S. large capitalization market.
S&P Global (SPGI) is a leading American provider of financial information, analytics, and credit ratings, headquartered in New York, NY. It operates major divisions including S&P Global Ratings, S&P Global Market Intelligence, S&P Global Commodity Insights, S&P Global Mobility, and S&P Dow Jones Indices.
The ICE BofA U.S. High Yield Index is an unmanaged index that tracks the performance of U.S. dollar denominated, below investment-grade rated corporate debt publicly issued in the U.S. domestic market.
The S&P 500 Growth measures constituents from the S&P 500 that are classified as growth stocks based on three factors: sales growth, the ratio of earnings change to price, and momentum.
The S&P 500 Value Index measures constituents from the S&P 500 that are classified as value stocks based on three factors: the ratios of book value, earnings and sales to price.
The S&P 500 Equal Weight Index is the equal-weight version of the widely regarded Standard & Poor’s 500 Index, which is generally considered representative of the U.S. large capitalization market. The index has the same constituents as the capitalization-weighted S&P 500, but each company in the index is allocated a fixed weight of 0.20% at each quarterly rebalancing.
The WCA Rising Dividend Custom Benchmark is a rules-based benchmark constructed by Washington Crossing Advisors to represent a universe of large capitalization U.S. companies that meet certain quality and dividend growth criteria, including proprietary screens for profitability, earnings consistency, and balance sheet strength, along with minimum market capitalization and dividend growth requirements. The benchmark is reconstituted and rebalanced quarterly and is intended to serve as a style-appropriate benchmark for the WCA Rising Dividend strategy.
The Washington Crossing Advisors’ High Quality Index and Low Quality Index are objective, quantitative measures designed to identify quality in the top 1,000 U.S. companies. Ranked by fundamental factors, WCA grades companies from “A” (top quintile) to “F” (bottom quintile). Factors include debt relative to equity, asset profitability, and consistency in performance. Companies with lower debt, higher profitability, and greater consistency earn higher grades. These indices are reconstituted annually and rebalanced daily. For informational purposes only, and WCA Quality Grade indices do not reflect the performance of any WCA investment strategy.
The risk of loss in trading commodities and futures can be substantial. You should therefore carefully consider whether such trading is suitable for you in light of your financial condition. The high degree of leverage that is often obtainable in commodity trading can work against you as well as for you. The use of leverage can lead to large losses as well as gains.
The information contained herein has been prepared from sources believed to be reliable but is not guaranteed by us and is not a complete summary or statement of all available data, nor is it considered an offer to buy or sell any securities referred to herein. Opinions expressed are subject to change without notice and do not take into account the particular investment objectives, financial situation, or needs of individual investors. There is no guarantee that the figures or opinions forecast in this report will be realized or achieved. Employees of Stifel, Nicolaus & Company, Incorporated or its affiliates may, at times, release written or oral commentary, technical analysis, or trading strategies that differ from the opinions expressed within. Past performance is no guarantee of future results. Indices are unmanaged, and you cannot invest directly in an index.
Asset allocation and diversification do not ensure a profit and may not protect against loss. There are special considerations associated with international investing, including the risk of currency fluctuations and political and economic events. Changes in market conditions or a company’s financial condition may impact a company’s ability to continue to pay dividends, and companies may also choose to discontinue dividend payments. Investing in emerging markets may involve greater risk and volatility than investing in more developed countries. Due to their narrow focus, sector-based investments typically exhibit greater volatility. Small-company stocks are typically more volatile and carry additional risks since smaller companies generally are not as well established as larger companies. Property values can fall due to environmental, economic, or other reasons, and changes in interest rates can negatively impact the performance of real estate companies. When investing in bonds, it is important to note that as interest rates rise, bond prices will fall. High-yield bonds have greater credit risk than higher-quality bonds. Bond laddering does not assure a profit or protect against loss in a declining market. The risk of loss in trading commodities and futures can be substantial. You should therefore carefully consider whether such trading is suitable for you in light of your financial condition. The high degree of leverage that is often obtainable in commodity trading can work against you as well as for you. The use of leverage can lead to large losses as well as gains. Changes in market conditions or a company’s financial condition may impact a company’s ability to continue to pay dividends, and companies may also choose to discontinue dividend payments.
All investments involve risk, including loss of principal, and there is no guarantee that investment objectives will be met. It is important to review your investment objectives, risk tolerance, and liquidity needs before choosing an investment style or manager. Equity investments are subject generally to market, market sector, market liquidity, issuer, and investment style risks, among other factors to varying degrees. Fixed Income investments are subject to market, market liquidity, issuer, investment style, interest rate, credit quality, and call risks, among other factors to varying degrees.
Beta is a measure of the volatility, or systematic risk, of a security or a portfolio relative to the market as a whole. A beta of one is considered as risky as the benchmark and is therefore likely to provide expected returns approximate to those of the benchmark during both up and down periods. A portfolio with a beta of two would move approximately twice as much as the benchmark.
Standard deviation is a measure of the volatility of a security’s or portfolio’s returns in relation to the mean return. The larger the standard deviation, the greater the volatility of return in relation to the mean return.
Changes in market conditions or a company’s financial condition may impact a company’s ability to continue to pay dividends, and companies may also choose to discontinue dividend payments
This commentary often expresses opinions about the direction of market, investment sector, and other trends. The opinions should not be considered predictions of future results. The information contained in this report is based on sources believed to be reliable, but is not guaranteed and not necessarily complete.
The securities discussed in this material were selected due to recent changes in the strategies. This selection criterion is not based on any measurement of performance of the underlying security.
Washington Crossing Advisors, LLC is a wholly-owned subsidiary and affiliated SEC Registered Investment Adviser of Stifel Financial Corp (NYSE: SF). Registration with the SEC implies no level of sophistication in investment management.


