The Limits of Traditional Risk Measures
Ask most investors what “risk” means and they’ll point to volatility — specifically, standard deviation, the familiar statistical measure of how much a portfolio’s returns fluctuate around their average. For decades, standard deviation has been the default language of investment risk. It appears in fund fact sheets, academic papers, and advisor presentations. It is the backbone of modern portfolio theory. And it is, in important ways, an incomplete picture.
Standard deviation treats upside and downside fluctuations as equally “risky.” A month in which your portfolio gains 8% is counted the same as a month in which it loses 8% in the eyes of standard deviation. But no investor calls their advisor when returns are too high. When returns surprise to the downside, however, it is another story. The asymmetry of lived market experience and how real people experience financial loss is what ultimately matters. Risk is directional, but a volatility metric like standard deviation does not recognize this fact.
More fundamentally, standard deviation assumes that investment returns follow a normal, bell-shaped distribution. They do not. Equity markets exhibit “fat tails” — extreme events that occur far more often and are of a greater magnitude than what a normal distribution would predict. The crashes of 2000–2002, 2008–2009, and 2020 are examples that were outside what most models predicted ahead of time. These “flukes of statistics” turn out to be recurring features of the financial landscape, and any risk framework that fails to account for them is working from an incomplete map.
The main point is that standard deviation counts good surprises and bad ones equally — but people experience them very differently. A measure of risk that ignores this asymmetry is measuring the wrong thing.
The Psychology Of Loss: Why Pain Matters
Behavioral finance has documented something investors have known intuitively for a long time: the pain of a financial loss is roughly twice as powerful as the pleasure of an equivalent gain. This is not irrational. It reflects how human beings actually experience uncertainty and regret.
What this means in practice is that risk is not symmetric in its emotional consequences. Not only does a 50% drawdown require more than a 50% recovery to break even — it also inflicts real psychological damage along the way. People who experience steep losses are more likely to sell at the worst moment, permanently impairing their outcomes. The sequence of returns matters enormously, especially for those who are drawing income from their portfolios.
Given this reality, a risk measure that captures the actual experience of loss is far more relevant to real investors than one that treats all return variation as equivalent.
A Better Lens: The Return-To-Drawdown Ratio
Drawdown captures something standard deviation can’t: the actual experience of loss. It measures investor pain more accurately than standard deviation — and such pain determines whether we as humans are able to stay the course or abandon a strategy at precisely the wrong moment (See Dalbar study here).
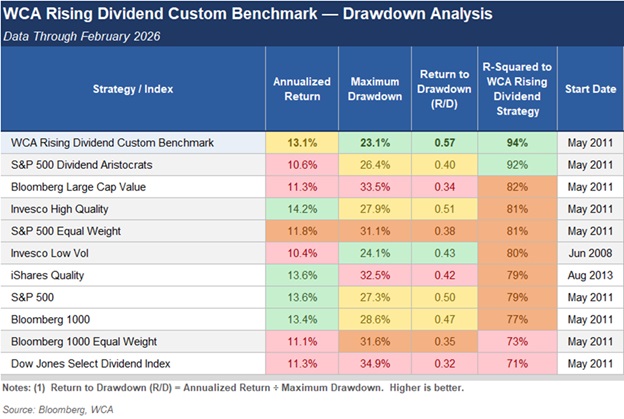
At Washington Crossing Advisors, we think about drawdown risk through a simple but powerful lens: the Return-to-Drawdown ratio, or R/D. It is calculated as:
Return-to-Drawdown (R/D) = Annualized Return ÷ Maximum Drawdown
A higher R/D ratio means more return is being earned for each unit of maximum drawdown endured. It rewards strategies that generate solid returns without exposing investors to ruinous declines. It captures the roller-coaster risk that smoother statistical measures hide.
When we apply this measure across a range of popular strategies and benchmarks, quality focused strategies like the WCA Rising Dividend strategy stand out with a relatively high return per unit of maximum drawdown of any index in our comparison (Table, below). We don’t think this is an accident. It is the direct result of building a portfolio around high-quality companies with consistent and growing dividends: businesses that are durable, flexible, and predictable. While these companies may lack excitement in good times (rapid growth, exciting story) this lack of excitement is more than made up for in difficult times. It is also interesting to note that the Dow Jones Select Dividend Index, which represents the most widely traded of the market’s highest-yielding stocks, ranks low with regard to return-to-drawdown and performs least like the WCA Rising Dividend Custom Benchmark.
Where Markets Stand Today: Little Margin For Error
The case for defense is especially urgent today.
According to the Census Bureau, there are a record 100+ million Americans that are either transitioning into retirement (ages 62-70), in active retirement (ages 70-80), or in late retirement (ages 80+)*. And drawdown risk for those heading from their peak accumulation years (ages 50-62) into these retirement stages is potentially the most financially damaging and behaviorally dangerous. As a society, we have never before had so many people at such an advanced age confronted by a market so little concerned about risk.
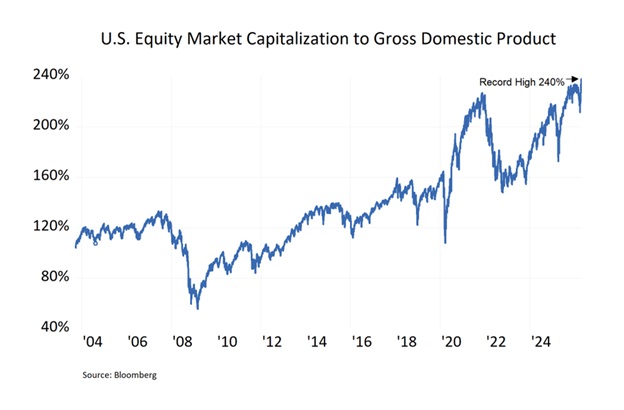
U.S. equity markets have recently set a new record: the total value of publicly traded American stocks now stands at approximately $75 trillion — roughly 240% of GDP (Chart, below). This ratio, often called the Buffett Indicator after Warren Buffett’s description of it as “probably the best single measure of where valuations stand at any given moment,” is at the highest level in recorded history. For context, the ratio peaked near 140% before the dot-com crash and sat around 105% before the 2008 financial crisis. It should also be noted that this figure accounts for only the value of public equity value and ignores the value of private equity.
Consider the current landscape. Investors appear to have already looked past the ongoing conflict with Iran and its implications for global oil prices and supply chains. Credit markets remain calm, but calm credit markets have a history of turning sharply and often without warning. And while artificial intelligence has captured enormous investor enthusiasm — and attracted enormous capital — not every AI investment will generate the returns being anticipated and the impact AI has on employment trends is already starting to be felt. The gap between expectation and outcome, when it arrives, could be large and swift.
None of these risks are predictions. Markets can remain elevated for longer than skeptics expect. But a public equity market priced at 240% of GDP is a market with a thin margin of safety. It is a market in which the cost of being wrong is likely high, and the benefit of having a defensive plan is correspondingly greater. We offer quality and rising dividends as an answer to the defense question.
A Special Word For Investors Nearing Or In Retirement
For investors in the accumulation phase — those with decades of contributions ahead of them — a significant drawdown is painful but recoverable. Time is on your side. A 30% decline, given sufficient runway, can be absorbed and overcome.
But for investors who are nearing retirement or already drawing income from their portfolios, the calculus is fundamentally different. A large drawdown at the wrong moment — just as withdrawals begin — can permanently impair the sustainability of a portfolio. In 2000-2002 the Nasdaq fell over 80% and many investors’ retirement plans were suddenly and without warning upended. This is the sequence-of-returns risk that financial planners rightly emphasize, and it cannot be diversified away with time alone.
In these cases, defense is a necessity. The WCA Rising Dividend strategy was built with this defense in mind. By focusing on quality companies with growing dividends, we aim to deliver a portfolio that earns competitive returns over a full market cycle while genuinely addressing the downside. The Return-to-Drawdown data in the table above speaks directly to that objective.
The Bottom Line
Risk is not just volatility. It is the depth of loss, the psychological cost of watching a portfolio decline, and the behavioral mistakes that often follow. Risk measures like standard deviation, for all its intended mathematical elegance, does not capture these things.
Actual drawdown does. And in a market priced at record valuations, with real geopolitical and economic risks present, the investors best positioned for whatever comes next are those who have a genuine plan for the risk side of the investment equation.
Defense, as they say in sports, wins championships. In investing, it may well determine retirement security. A quality-focused portfolio of companies that tend to regularly increase dividends is one way to address both the offense and defense side of the game.
*https://www.census.gov/library/stories/2025/12/older-workers.html
Kevin R. Caron, CFA
Senior Portfolio Manager
973-549-4051
Chad Morganlander
Senior Portfolio Manager
973-549-4052
Steve Lerit, CFA
Head of Portfolio Risk
973-549-4028
Eric Needham
External Sales and Marketing
312-771-6010
Matthew Battipaglia
Portfolio Manager
973-549-4047
Jeffrey Battipaglia
Client Portfolio Manager
973-549-4031
Suzanne Ashley
Internal Relationship Manager
973-549-4168
Disclosures:
WCA Barometer – We regularly assess changes in fundamental conditions to help guide near-term asset allocation decisions. Analysis incorporates approximately 30 forward-looking indicators in categories ranging from Credit and Capital Markets to U.S. Economic Conditions and Foreign Conditions. From each category of data, we create three diffusion-style sub-indices that measure the trends in the underlying data. Sustained improvement that is spread across a wide variety of observations will produce index readings above 50 (potentially favoring stocks), while readings below 50 would indicate potential deterioration (potentially favoring bonds). The WCA Fundamental Conditions Index combines the three underlying categories into a single summary measure. This measure can be thought of as a “barometer” for changes in fundamental conditions.
Standard & Poor’s 500 Index (S&P 500) is a capitalization-weighted index that is generally considered representative of the U.S. large capitalization market.
The S&P 500® Information Technology comprises those companies included in the S&P 500 that are classified as members of the GICS® information technology sector.
S&P Global (SPGI) is a leading American provider of financial information, analytics, and credit ratings, headquartered in New York, NY. It operates major divisions including S&P Global Ratings, S&P Global Market Intelligence, S&P Global Commodity Insights, S&P Global Mobility, and S&P Dow Jones Indices.
The ICE BofA U.S. High Yield Index is an unmanaged index that tracks the performance of U.S. dollar denominated, below investment-grade rated corporate debt publicly issued in the U.S. domestic market.
The S&P 500 Growth measures constituents from the S&P 500 that are classified as growth stocks based on three factors: sales growth, the ratio of earnings change to price, and momentum.
The S&P 500 Value Index measures constituents from the S&P 500 that are classified as value stocks based on three factors: the ratios of book value, earnings and sales to price.
The S&P 500 Equal Weight Index is the equal-weight version of the widely regarded Standard & Poor’s 500 Index, which is generally considered representative of the U.S. large capitalization market. The index has the same constituents as the capitalization-weighted S&P 500, but each company in the index is allocated a fixed weight of 0.20% at each quarterly rebalancing.
The WCA Rising Dividend Custom Benchmark is a rules-based benchmark constructed by Washington Crossing Advisors to represent a universe of large capitalization U.S. companies that meet certain quality and dividend growth criteria, including proprietary screens for profitability, earnings consistency, and balance sheet strength, along with minimum market capitalization and dividend growth requirements. The benchmark is reconstituted and rebalanced quarterly and is intended to serve as a style-appropriate benchmark for the WCA Rising Dividend strategy.
The Washington Crossing Advisors’ High Quality Index and Low Quality Index are objective, quantitative measures designed to identify quality in the top 1,000 U.S. companies. Ranked by fundamental factors, WCA grades companies from “A” (top quintile) to “F” (bottom quintile). Factors include debt relative to equity, asset profitability, and consistency in performance. Companies with lower debt, higher profitability, and greater consistency earn higher grades. These indices are reconstituted annually and rebalanced daily. For informational purposes only, and WCA Quality Grade indices do not reflect the performance of any WCA investment strategy.
The risk of loss in trading commodities and futures can be substantial. You should therefore carefully consider whether such trading is suitable for you in light of your financial condition. The high degree of leverage that is often obtainable in commodity trading can work against you as well as for you. The use of leverage can lead to large losses as well as gains.
The information contained herein has been prepared from sources believed to be reliable but is not guaranteed by us and is not a complete summary or statement of all available data, nor is it considered an offer to buy or sell any securities referred to herein. Opinions expressed are subject to change without notice and do not take into account the particular investment objectives, financial situation, or needs of individual investors. There is no guarantee that the figures or opinions forecast in this report will be realized or achieved. Employees of Stifel, Nicolaus & Company, Incorporated or its affiliates may, at times, release written or oral commentary, technical analysis, or trading strategies that differ from the opinions expressed within. Past performance is no guarantee of future results. Indices are unmanaged, and you cannot invest directly in an index.
Asset allocation and diversification do not ensure a profit and may not protect against loss. There are special considerations associated with international investing, including the risk of currency fluctuations and political and economic events. Changes in market conditions or a company’s financial condition may impact a company’s ability to continue to pay dividends, and companies may also choose to discontinue dividend payments. Investing in emerging markets may involve greater risk and volatility than investing in more developed countries. Due to their narrow focus, sector-based investments typically exhibit greater volatility. Small-company stocks are typically more volatile and carry additional risks since smaller companies generally are not as well established as larger companies. Property values can fall due to environmental, economic, or other reasons, and changes in interest rates can negatively impact the performance of real estate companies. When investing in bonds, it is important to note that as interest rates rise, bond prices will fall. High-yield bonds have greater credit risk than higher-quality bonds. Bond laddering does not assure a profit or protect against loss in a declining market. The risk of loss in trading commodities and futures can be substantial. You should therefore carefully consider whether such trading is suitable for you in light of your financial condition. The high degree of leverage that is often obtainable in commodity trading can work against you as well as for you. The use of leverage can lead to large losses as well as gains. Changes in market conditions or a company’s financial condition may impact a company’s ability to continue to pay dividends, and companies may also choose to discontinue dividend payments.
All investments involve risk, including loss of principal, and there is no guarantee that investment objectives will be met. It is important to review your investment objectives, risk tolerance, and liquidity needs before choosing an investment style or manager. Equity investments are subject generally to market, market sector, market liquidity, issuer, and investment style risks, among other factors to varying degrees. Fixed Income investments are subject to market, market liquidity, issuer, investment style, interest rate, credit quality, and call risks, among other factors to varying degrees.
Beta is a measure of the volatility, or systematic risk, of a security or a portfolio relative to the market as a whole. A beta of one is considered as risky as the benchmark and is therefore likely to provide expected returns approximate to those of the benchmark during both up and down periods. A portfolio with a beta of two would move approximately twice as much as the benchmark.
Standard deviation is a measure of the volatility of a security’s or portfolio’s returns in relation to the mean return. The larger the standard deviation, the greater the volatility of return in relation to the mean return.
Changes in market conditions or a company’s financial condition may impact a company’s ability to continue to pay dividends, and companies may also choose to discontinue dividend payments
This commentary often expresses opinions about the direction of market, investment sector, and other trends. The opinions should not be considered predictions of future results. The information contained in this report is based on sources believed to be reliable, but is not guaranteed and not necessarily complete.
The securities discussed in this material were selected due to recent changes in the strategies. This selection criterion is not based on any measurement of performance of the underlying security.
Washington Crossing Advisors, LLC is a wholly-owned subsidiary and affiliated SEC Registered Investment Adviser of Stifel Financial Corp (NYSE: SF). Registration with the SEC implies no level of sophistication in investment management.
Additional Index Descriptions:
WCA Quality Indices are based on Washington Crossing Advisors’ quantitative analysis of firms along three dimensions: asset profitability, consistency, and leverage. Higher quality companies are defined as those which fall in the top quintile of largest-cap U.S. companies and tend to have higher average profitability, greater than normal consistency, and low leverage. Lower quality companies are defined as those which fall in the lowest quintile based on the same criteria. Indices are reconstituted annually, continuously rebalanced, and presented on a total return basis, as calculated by Bloomberg. Indices are unmanaged and do not represent performance of any actual portfolio or portfolio strategy offered by Washington Crossing Advisors, LLC.
Dow Jones U.S. 1000 Index
A member of the Dow Jones Total Stock Market Indices family, designed to measure the performance of large-cap U.S. equity securities. It is float-adjusted and market-capitalization weighted.
Dow Jones U.S. 1000 Equal Weight Index
The same universe of large-cap U.S. stocks as the Dow Jones U.S. 1000, but with each constituent assigned an equal weight, removing the size bias inherent in capitalization-weighted construction.
Bloomberg U.S. Large Cap Value Index
Designed to measure the performance of large-cap U.S. equity securities that are classified as “value” based on a multi-factor analysis. Value characteristics typically include low price-to-earnings, price-to-book, and price-to-sales ratios.
Invesco Low Volatility Index (S&P 500 Low Volatility)
Consists of the 100 securities from the S&P 500 with the lowest realized volatility over the prior 12 months. The fund and index are rebalanced and reconstituted quarterly. Lower-volatility stocks receive higher weights.
Vanguard U.S. Quality Index
An actively managed, rules-based strategy that evaluates U.S. companies of all sizes for high-quality characteristics, using screens designed to ensure diversification and mitigate exposure to lower-quality names. Quality is assessed through profitability, cash flow generation, and balance sheet strength.
Invesco High Quality Index (S&P 500 Quality)
Tracks the performance of the 100 stocks in the S&P 500 with the highest quality score, calculated based on three fundamental measures: return on equity, accruals ratio, and financial leverage ratio.
iShares Quality Index (MSCI USA Sector Neutral Quality)
Tracks an index composed of U.S. stocks with high return on equity, stable earnings, and low debt, offering a way to invest in financially sound companies across large- and mid-capitalization segments.
iShares Select Dividend Index (Dow Jones U.S. Select Dividend)
Composed of 100 of the highest dividend-yielding securities in the Dow Jones U.S. Index (excluding REITs). To qualify, each security must have a dividend per share at least equal to its five-year average, have paid dividends in each of the prior five years, and maintain non-negative trailing earnings per share.
S&P 500 Dividend Aristocrats Index
Measures the performance of S&P 500 companies that have increased dividends every year for the last 25 consecutive years. The index treats each constituent as a distinct investment opportunity without regard to its size by equally weighting each company.
S&P High Beta Total Return Index is designed to measure the performance of the constituents of the S&P 500 that are most sensitive to changes in market returns. S&P Low Beta Total Return Index is designed to measure the performance of the constituents of the S&P 500 that are least sensitive to changes in market returns.