The Earnings Boom’s $5 Trillion Test
The S&P 500’s rise is supported by sharply higher earnings forecasts. But cash generation is not keeping pace, and the trillions being invested in AI must earn enough to justify the capital committed over time. That major test is still in front of us.
Profits, Cash, and the AI Boom
This year the S&P 500 is up 12%, but investors are now paying less for a dollar of earnings (EPS) than at the start of the year. At December 31, the S&P 500 stood at 6,845, and now it sits near 7,686, for a 12% gain year to date. But the bigger jump has been the 28% gain in analysts’ forecast earnings over the same period. How did we get a 28% earnings gain in eight months? We saw a 10% rise in anticipated sales coupled with a 16% gain in margins. A 10% increase in anticipated sales combined with a 16% improvement in margins produces roughly 28% earnings growth.
On the surface, this looks healthy. Investors are not paying higher multiples for earnings like they did in past booms. Earnings forecasts are rising much faster than the S&P 500 this year.
But there is another way to look at profitability. Earnings are an accounting measure; but over a long horizon, investors really own claims on cash.
Large and Growing Cash Gap
Please consider the chart below. It shows how S&P 500 “earnings” relates to operating cash flow after removing capital expenditures. Over time, persistent earnings growth must be supported by cash generation. It simply takes time for capital investments to show returns, hence the gap. Today’s gap is a record high. AI capital spending has risen rapidly since early 2024. It’s now expected to exceed $1.4 trillion in the next year, based on an estimate from S&P Global. Total AI capital spending is expected to reach trillions. This puts today’s AI investments alongside other transformative technologies of the past like railroads, electrification, and the internet.
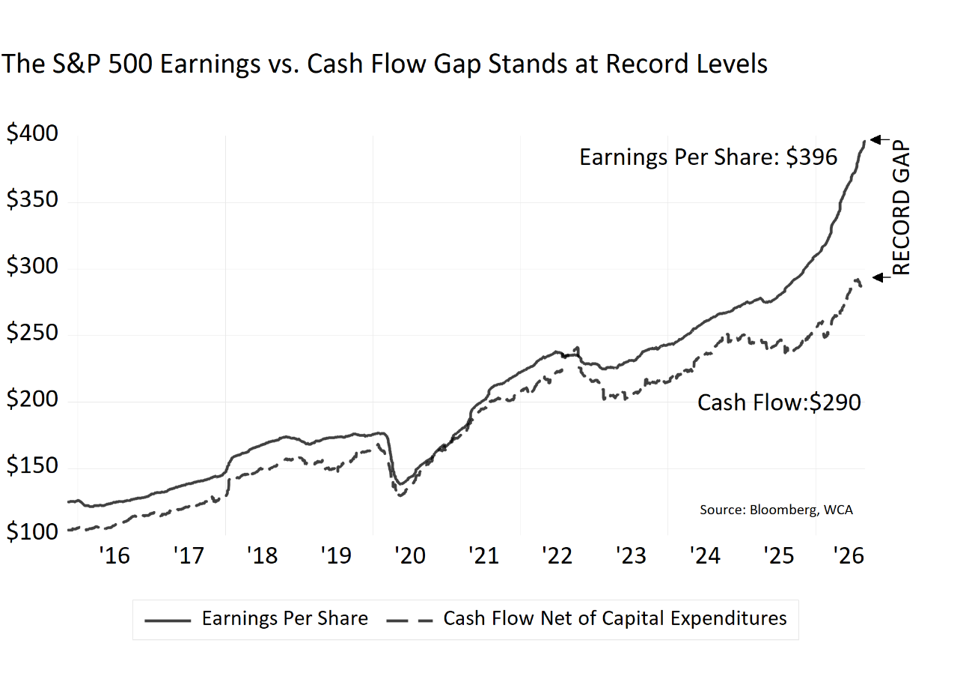
In short, earnings spread the cost of long-lived investments over time, while cash flow records the spending when it occurs. Over time, however, earnings must ultimately translate into cash if they are to create value for shareholders. And, on this score, we find that the S&P 500 appears much cheaper when valued on earnings than when valued against the cash flow. With the S&P trading at 7,686, the forward earnings and cash flow yields are 5.2% and 3.8%, respectively. But this does not tell us whether capital spending will, in the end, prove good or bad. For that, we must ask if the investments will generate a return high enough to justify the cost.
Economic Profit is the Real Test
The most important question is not how much companies are spending. We know the spending is already extremely large and getting larger. The most important question is whether the return on such investment compensates investors for time and risk.
A little “back of the envelope” math can show roughly how much annual cash flow would be needed to recover today’s AI investment while earning an appropriate return. To do this, we need to answer three basic things: How much capital is being invested? What return is required to assume the risk? And what is the approximate life of the asset? None of these questions are knowable with precision, but we want to make reasonable guesses to judge order of magnitude, hence this is intentionally a simplified calculation. We know that, in reality, AI investment will occur over several years, asset lives will differ, and some assets will retain residual value. So, we are not trying to forecast AI economics precisely in this exercise, but to try and establish an approximate scale of cash generation required.
Some Rough Assumptions:
Capital investment: McKinsey & Company estimates around $5 trillion in investment during the first five years of the AI boom.* However, if demand accelerates, some estimates go as high as $8 trillion. For this exercise, we will stick with the $5 trillion figure.
Required Return: The typical megacap hyperscaler has a cost of capital near 15% based on current Bloomberg estimates. These figures have risen from about 10% pre-AI boom as risk has risen. For this example, we will use a 12.5% midpoint assumption between the pre-AI boom estimate and the current one.
Asset Life: We will assume a 5-year life for servers and GPUs and assume that heavy equipment such as power equipment will have a 10-year life. For simplicity, we will also assume that the total cost of a datacenter includes only the equipment and not the long-lasting real estate costs. All in, we will assume the average usable life of equipment, servers, GPUs, and the like is about 7.5 years (average of the server/GPU and power equipment useful lives). Moreover, we treat the $5 trillion buildout as a single pool of capital with an average 7.5-year economic life, although we know this is a moving target.
Finally, we will use these rough estimates in a formula. This will show us how much annual cash flow we need to recover the original investment and provide a return that covers opportunity cost and risk. That formula, called a capital recovery factor (CRF), is equal to:
Capital Recovery Factor (CRF)
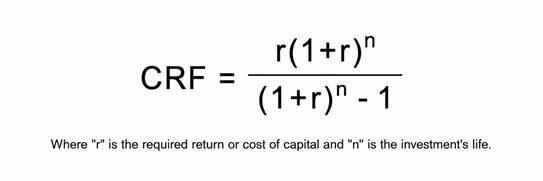
When we plug in our assumptions about return and asset life into our formula, we get a “capital recovery factor” of about 21%. We need to find out how much annual cash is required for a sufficient recovery and return on investment. To do this, we multiply our initial investment of $5 trillion by 21%. This gives us a necessary annual cash flow estimate of just over $1 trillion. At a hypothetical 50% cash-flow margin, that would require roughly $2.1 trillion of annual revenue. If we assume a 40% margin, revenue will need to be $2.7 trillion and if we assume a 60% margin, revenue would need to be $1.8 trillion. The profitability of the investments is another major swing factor and unknowable at this time.
To put roughly $2 trillion of revenue in perspective, consider that total revenue for S&P 500 companies is roughly $20 trillion. Thus, AI revenue might need to land somewhere near 10% of today’s total S&P 500 revenue figure, give or take.
Conclusion
Earnings are soaring, with S&P 500 profit forecasts up 28% this year. At the same time, companies are engaged in a historic capital-investment boom centered on AI. Cash generation is not keeping pace, creating an unusually large gap between reported profits and post-investment cash flow.
That does not make the investment bad. Railroads, electrification, and the internet all required enormous amounts of up-front capital before producing transformative economic gains. But technological success and investment success are not the same thing. Capital must first be recovered, and investors must be compensated for the time and risk involved in providing it.
AI can transform the economy over the long term and still disappoint investors. And there can be a different set of short-run and long-run winners and losers. The ultimate test will not be whether the technology works—or even whether it generates enormous revenue. The test is whether that revenue produces enough cash to recover the trillions invested and earn a return above the cost of the capital used to build it.
*McKinsey Quarterly – The cost of compute: A $7T race to scale data centers.
Kevin R. Caron, CFA
Senior Portfolio Manager
973-549-4051
Chad Morganlander
Senior Portfolio Manager
973-549-4052
Steve Lerit, CFA
Head of Portfolio Risk
973-549-4028
Eric Needham
External Sales and Marketing
312-771-6010
Matthew Battipaglia
Portfolio Manager
973-549-4047
Jeffrey Battipaglia
Client Portfolio Manager
973-549-4031
Suzanne Ashley
Internal Relationship Manager
973-549-4168
Disclosures:
WCA Barometer – We regularly assess changes in fundamental conditions to help guide near-term asset allocation decisions. Analysis incorporates approximately 30 forward-looking indicators in categories ranging from Credit and Capital Markets to U.S. Economic Conditions and Foreign Conditions. From each category of data, we create three diffusion-style sub-indices that measure the trends in the underlying data. Sustained improvement that is spread across a wide variety of observations will produce index readings above 50 (potentially favoring stocks), while readings below 50 would indicate potential deterioration (potentially favoring bonds). The WCA Fundamental Conditions Index combines the three underlying categories into a single summary measure. This measure can be thought of as a “barometer” for changes in fundamental conditions.
Standard & Poor’s 500 Index (S&P 500) is a capitalization-weighted index that is generally considered representative of the U.S. large capitalization market.
The S&P 500® Information Technology comprises those companies included in the S&P 500 that are classified as members of the GICS® information technology sector.
S&P Global (SPGI) is a leading American provider of financial information, analytics, and credit ratings, headquartered in New York, NY. It operates major divisions including S&P Global Ratings, S&P Global Market Intelligence, S&P Global Commodity Insights, S&P Global Mobility, and S&P Dow Jones Indices.
The ICE BofA U.S. High Yield Index is an unmanaged index that tracks the performance of U.S. dollar denominated, below investment-grade rated corporate debt publicly issued in the U.S. domestic market.
The S&P 500 Growth measures constituents from the S&P 500 that are classified as growth stocks based on three factors: sales growth, the ratio of earnings change to price, and momentum.
The S&P 500 Value Index measures constituents from the S&P 500 that are classified as value stocks based on three factors: the ratios of book value, earnings and sales to price.
The S&P 500 Equal Weight Index is the equal-weight version of the widely regarded Standard & Poor’s 500 Index, which is generally considered representative of the U.S. large capitalization market. The index has the same constituents as the capitalization-weighted S&P 500, but each company in the index is allocated a fixed weight of 0.20% at each quarterly rebalancing.
The WCA Rising Dividend Custom Benchmark is a rules-based benchmark constructed by Washington Crossing Advisors to represent a universe of large capitalization U.S. companies that meet certain quality and dividend growth criteria, including proprietary screens for profitability, earnings consistency, and balance sheet strength, along with minimum market capitalization and dividend growth requirements. The benchmark is reconstituted and rebalanced quarterly and is intended to serve as a style-appropriate benchmark for the WCA Rising Dividend strategy.
The Washington Crossing Advisors’ High Quality Index and Low Quality Index are objective, quantitative measures designed to identify quality in the top 1,000 U.S. companies. Ranked by fundamental factors, WCA grades companies from “A” (top quintile) to “F” (bottom quintile). Factors include debt relative to equity, asset profitability, and consistency in performance. Companies with lower debt, higher profitability, and greater consistency earn higher grades. These indices are reconstituted annually and rebalanced daily. For informational purposes only, and WCA Quality Grade indices do not reflect the performance of any WCA investment strategy.
The risk of loss in trading commodities and futures can be substantial. You should therefore carefully consider whether such trading is suitable for you in light of your financial condition. The high degree of leverage that is often obtainable in commodity trading can work against you as well as for you. The use of leverage can lead to large losses as well as gains.
The information contained herein has been prepared from sources believed to be reliable but is not guaranteed by us and is not a complete summary or statement of all available data, nor is it considered an offer to buy or sell any securities referred to herein. Opinions expressed are subject to change without notice and do not take into account the particular investment objectives, financial situation, or needs of individual investors. There is no guarantee that the figures or opinions forecast in this report will be realized or achieved. Employees of Stifel, Nicolaus & Company, Incorporated or its affiliates may, at times, release written or oral commentary, technical analysis, or trading strategies that differ from the opinions expressed within. Past performance is no guarantee of future results. Indices are unmanaged, and you cannot invest directly in an index.
Asset allocation and diversification do not ensure a profit and may not protect against loss. There are special considerations associated with international investing, including the risk of currency fluctuations and political and economic events. Changes in market conditions or a company’s financial condition may impact a company’s ability to continue to pay dividends, and companies may also choose to discontinue dividend payments. Investing in emerging markets may involve greater risk and volatility than investing in more developed countries. Due to their narrow focus, sector-based investments typically exhibit greater volatility. Small-company stocks are typically more volatile and carry additional risks since smaller companies generally are not as well established as larger companies. Property values can fall due to environmental, economic, or other reasons, and changes in interest rates can negatively impact the performance of real estate companies. When investing in bonds, it is important to note that as interest rates rise, bond prices will fall. High-yield bonds have greater credit risk than higher-quality bonds. Bond laddering does not assure a profit or protect against loss in a declining market. The risk of loss in trading commodities and futures can be substantial. You should therefore carefully consider whether such trading is suitable for you in light of your financial condition. The high degree of leverage that is often obtainable in commodity trading can work against you as well as for you. The use of leverage can lead to large losses as well as gains. Changes in market conditions or a company’s financial condition may impact a company’s ability to continue to pay dividends, and companies may also choose to discontinue dividend payments.
All investments involve risk, including loss of principal, and there is no guarantee that investment objectives will be met. It is important to review your investment objectives, risk tolerance, and liquidity needs before choosing an investment style or manager. Equity investments are subject generally to market, market sector, market liquidity, issuer, and investment style risks, among other factors to varying degrees. Fixed Income investments are subject to market, market liquidity, issuer, investment style, interest rate, credit quality, and call risks, among other factors to varying degrees.
Beta is a measure of the volatility, or systematic risk, of a security or a portfolio relative to the market as a whole. A beta of one is considered as risky as the benchmark and is therefore likely to provide expected returns approximate to those of the benchmark during both up and down periods. A portfolio with a beta of two would move approximately twice as much as the benchmark.
Standard deviation is a measure of the volatility of a security’s or portfolio’s returns in relation to the mean return. The larger the standard deviation, the greater the volatility of return in relation to the mean return.
Changes in market conditions or a company’s financial condition may impact a company’s ability to continue to pay dividends, and companies may also choose to discontinue dividend payments
This commentary often expresses opinions about the direction of market, investment sector, and other trends. The opinions should not be considered predictions of future results. The information contained in this report is based on sources believed to be reliable, but is not guaranteed and not necessarily complete.
The securities discussed in this material were selected due to recent changes in the strategies. This selection criterion is not based on any measurement of performance of the underlying security.
Washington Crossing Advisors, LLC is a wholly-owned subsidiary and affiliated SEC Registered Investment Adviser of Stifel Financial Corp (NYSE: SF). Registration with the SEC implies no level of sophistication in investment management.