Steady-As-She-Goes
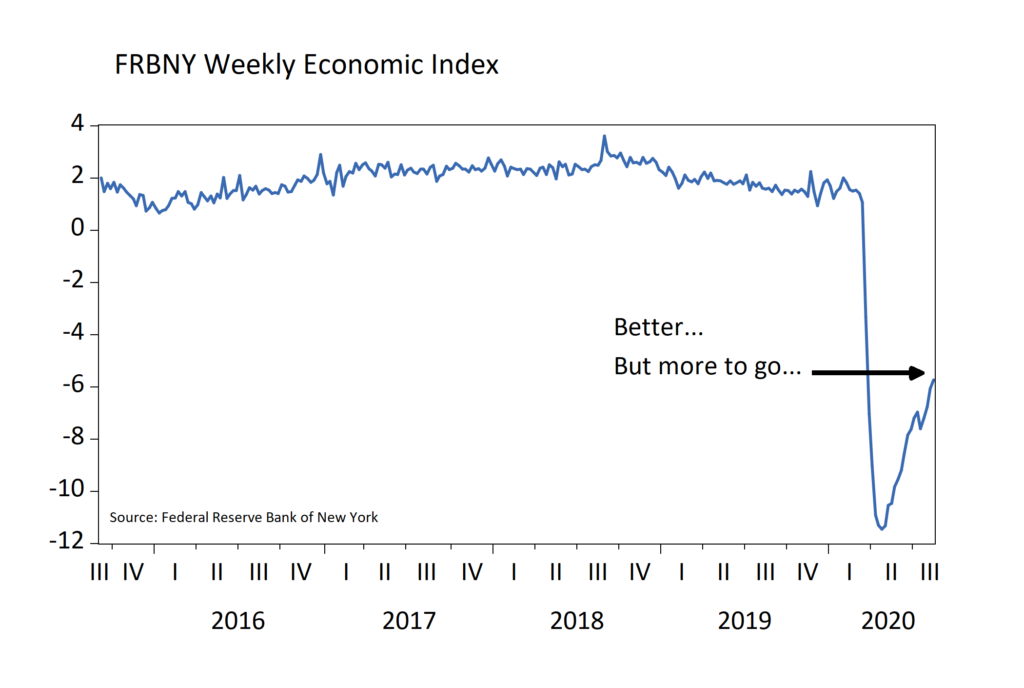
We continue to see improvement in several indicators from a very weak second quarter. It is likely that, after a 30% annualized drop in GDP in Q2, Q3 could see a 25% annualized rebound. Progress is also seen in weekly data such as the Federal Reserve Bank of New York’s Weekly Economic Index (WEI). This index tracks ten daily and weekly indicators of real economic activity scaled to align with the four-quarter GDP growth rate (Chart A, below). The WEI spotlights consumer behavior, the labor market, and production weekly. As beauty is in the eye of the beholder, so too is the interpretation of this chart. The economy continues to grind higher week by week but remains far depressed from pre-COVID levels. Steady-as-she-goes for now is our take so long as improvement persists.
Chart A
Health Trends Mostly Good
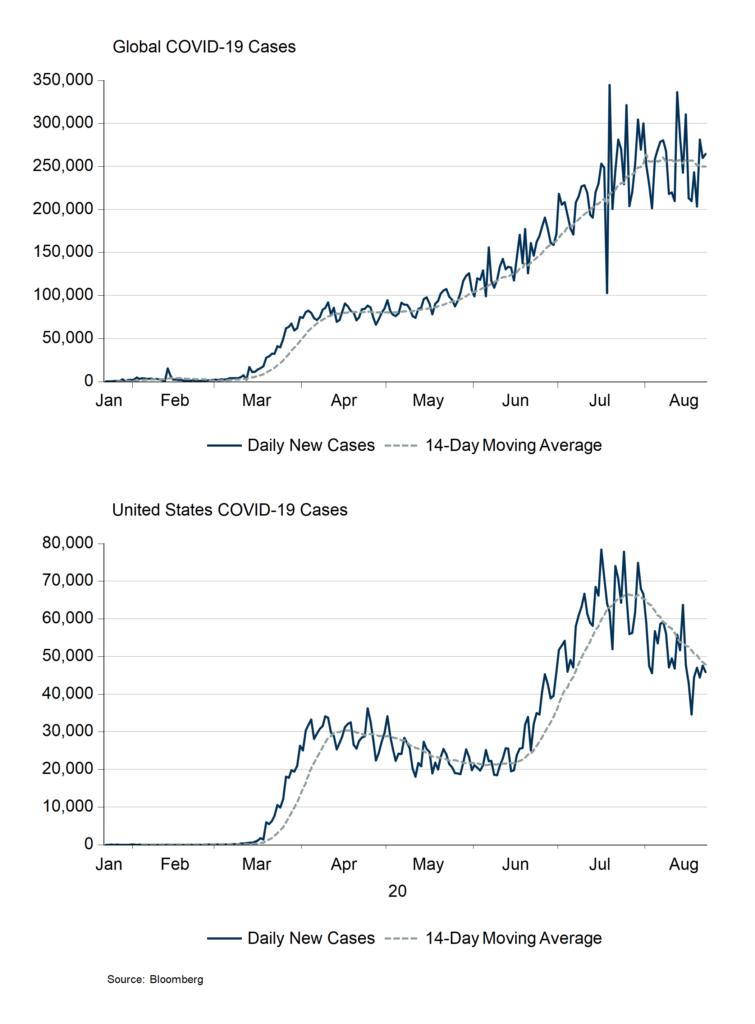
Supporting the recovery in the economy is a reasonably supportive healthcare backdrop. This is not to say we do not see continued cases and deaths, but the rate of increase in cases globally is flattening and in the United States is trending lower (Chart B, below). However, we cannot take these trends for granted. Countries like Germany, Spain, France, South Korea, Japan, and Italy have all experienced uptrends in cases recently. Such spikes make it hard to return to life as normal, and threaten job creation and economic recovery in those countries.
Chart B
Election Focus
As we head toward elections this fall, investors’ spotlight will turn to issues likely to impact the economy. How much and in what ways to continue existing fiscal programs will be key. Existing programs, including the Paycheck Protection Program, Health Care Enhancement Act, and the CARES act, provided an infusion of nearly $3 trillion to the private sector recently (Table A, below). Monetary policy actions, including cutting interest rates, $3 trillion in asset purchases, backstopping credit markets, easing lending conditions, and providing forbearance, also provided much relief to the private sector.
There are significant questions about the extent and method of providing support to the private sector during the upcoming months. As elections approach and Congress debates pathways to provide COVID-19 assistance to households, businesses, state and local governments, investors will be looking for clues as to what comes next. For now, we are keeping a steady-as-she-goes approach. CONQUEST tactical asset allocation portfolios are moderately overweight stocks versus bonds given improving trends, for example. We are also continuing to focus heavily on balance sheets and cash generation abilities of companies in equity portfolios we manage. So, at least, the improving trends in the data are taking the lead in our assessment of conditions. At some point, this could change. But, for now, it is “steady-as-she-goes.”
Table A
| COVID-19 Economic Stimulus Programs | Billions $ |
|---|---|
| Fiscal Programs | |
| Paycheck Protection Program (PPP) and Health Care Enhancement Act | |
| Forgivable Small Business Loans | $321 |
| Small Business Loans & Grants | $62 |
| Hospital Grants & Loans | $75 |
| Expand COVID Testing | $25 |
| PPP & Health Care Enhancement Act | $483 |
| CARES Act | |
| One-time Tax Rebates to Individuals | $293 |
| Expand Unemployment Benefits | $268 |
| Food Safety Net | $25 |
| Loans, Guarantees, and Federal Reserve 13(3) Program Funding | $510 |
| Small Business Administration Loans and Guarantees | $349 |
| Aid for Hospitals | $100 |
| Transfers to State and Local Governments | $150 |
| International Assistance | $50 |
| Other | $555 |
| CARES Act | $2,300 |
| Monetary Programs | |
| Federal Reserve | |
| Cut Policy Rate to Zero | |
| Purchased Assets | $3,0001 |
| Committed to Support Flow of Credit | $1151 |
| Encouraged Banks to Lend and Make Loan Modifications | |
| Eased Capital Requirements | |
| Eased Regulatory and Supervisory Requirements | |
| Gov’t Agencies: | |
| Provide 12-Months of Mortgage Forbearance | |
| Provide Loan Modifications | |
| Suspend Late Fees / Credit Reporting | |
| Grand Total Fiscal and Monetary | $5,783 |
| 1. As of August 2020 |
Disclosures:
WCA Barometer – We regularly assess changes in fundamental conditions to help guide near-term asset allocation decisions. Analysis incorporates approximately 30 forward-looking indicators in categories ranging from Credit and Capital Markets to U.S. Economic Conditions and Foreign Conditions. From each category of data, we create three diffusion-style sub-indices that measure the trends in the underlying data. Sustained improvement that is spread across a wide variety of observations will produce index readings above 50 (potentially favoring stocks), while readings below 50 would indicate potential deterioration (potentially favoring bonds). The WCA Fundamental Conditions Index combines the three underlying categories into a single summary measure. This measure can be thought of as a “barometer” for changes in fundamental conditions.
Standard & Poor’s 500 Index (S&P 500) is a capitalization-weighted index that is generally considered representative of the U.S. large capitalization market.
S&P Global (SPGI) is a leading American provider of financial information, analytics, and credit ratings, headquartered in New York, NY. It operates major divisions including S&P Global Ratings, S&P Global Market Intelligence, S&P Global Commodity Insights, S&P Global Mobility, and S&P Dow Jones Indices.
The ICE BofA U.S. High Yield Index is an unmanaged index that tracks the performance of U.S. dollar denominated, below investment-grade rated corporate debt publicly issued in the U.S. domestic market.
The S&P 500 Growth measures constituents from the S&P 500 that are classified as growth stocks based on three factors: sales growth, the ratio of earnings change to price, and momentum.
The S&P 500 Value Index measures constituents from the S&P 500 that are classified as value stocks based on three factors: the ratios of book value, earnings and sales to price.
The S&P 500 Equal Weight Index is the equal-weight version of the widely regarded Standard & Poor’s 500 Index, which is generally considered representative of the U.S. large capitalization market. The index has the same constituents as the capitalization-weighted S&P 500, but each company in the index is allocated a fixed weight of 0.20% at each quarterly rebalancing.
The WCA Rising Dividend Custom Benchmark is a rules-based benchmark constructed by Washington Crossing Advisors to represent a universe of large capitalization U.S. companies that meet certain quality and dividend growth criteria, including proprietary screens for profitability, earnings consistency, and balance sheet strength, along with minimum market capitalization and dividend growth requirements. The benchmark is reconstituted and rebalanced quarterly and is intended to serve as a style-appropriate benchmark for the WCA Rising Dividend strategy.
The Washington Crossing Advisors’ High Quality Index and Low Quality Index are objective, quantitative measures designed to identify quality in the top 1,000 U.S. companies. Ranked by fundamental factors, WCA grades companies from “A” (top quintile) to “F” (bottom quintile). Factors include debt relative to equity, asset profitability, and consistency in performance. Companies with lower debt, higher profitability, and greater consistency earn higher grades. These indices are reconstituted annually and rebalanced daily. For informational purposes only, and WCA Quality Grade indices do not reflect the performance of any WCA investment strategy.
The risk of loss in trading commodities and futures can be substantial. You should therefore carefully consider whether such trading is suitable for you in light of your financial condition. The high degree of leverage that is often obtainable in commodity trading can work against you as well as for you. The use of leverage can lead to large losses as well as gains.
The information contained herein has been prepared from sources believed to be reliable but is not guaranteed by us and is not a complete summary or statement of all available data, nor is it considered an offer to buy or sell any securities referred to herein. Opinions expressed are subject to change without notice and do not take into account the particular investment objectives, financial situation, or needs of individual investors. There is no guarantee that the figures or opinions forecast in this report will be realized or achieved. Employees of Stifel, Nicolaus & Company, Incorporated or its affiliates may, at times, release written or oral commentary, technical analysis, or trading strategies that differ from the opinions expressed within. Past performance is no guarantee of future results. Indices are unmanaged, and you cannot invest directly in an index.
Asset allocation and diversification do not ensure a profit and may not protect against loss. There are special considerations associated with international investing, including the risk of currency fluctuations and political and economic events. Changes in market conditions or a company’s financial condition may impact a company’s ability to continue to pay dividends, and companies may also choose to discontinue dividend payments. Investing in emerging markets may involve greater risk and volatility than investing in more developed countries. Due to their narrow focus, sector-based investments typically exhibit greater volatility. Small-company stocks are typically more volatile and carry additional risks since smaller companies generally are not as well established as larger companies. Property values can fall due to environmental, economic, or other reasons, and changes in interest rates can negatively impact the performance of real estate companies. When investing in bonds, it is important to note that as interest rates rise, bond prices will fall. High-yield bonds have greater credit risk than higher-quality bonds. Bond laddering does not assure a profit or protect against loss in a declining market. The risk of loss in trading commodities and futures can be substantial. You should therefore carefully consider whether such trading is suitable for you in light of your financial condition. The high degree of leverage that is often obtainable in commodity trading can work against you as well as for you. The use of leverage can lead to large losses as well as gains. Changes in market conditions or a company’s financial condition may impact a company’s ability to continue to pay dividends, and companies may also choose to discontinue dividend payments.
All investments involve risk, including loss of principal, and there is no guarantee that investment objectives will be met. It is important to review your investment objectives, risk tolerance, and liquidity needs before choosing an investment style or manager. Equity investments are subject generally to market, market sector, market liquidity, issuer, and investment style risks, among other factors to varying degrees. Fixed Income investments are subject to market, market liquidity, issuer, investment style, interest rate, credit quality, and call risks, among other factors to varying degrees.
Beta is a measure of the volatility, or systematic risk, of a security or a portfolio relative to the market as a whole. A beta of one is considered as risky as the benchmark and is therefore likely to provide expected returns approximate to those of the benchmark during both up and down periods. A portfolio with a beta of two would move approximately twice as much as the benchmark.
Standard deviation is a measure of the volatility of a security’s or portfolio’s returns in relation to the mean return. The larger the standard deviation, the greater the volatility of return in relation to the mean return.
Changes in market conditions or a company’s financial condition may impact a company’s ability to continue to pay dividends, and companies may also choose to discontinue dividend payments
This commentary often expresses opinions about the direction of market, investment sector, and other trends. The opinions should not be considered predictions of future results. The information contained in this report is based on sources believed to be reliable, but is not guaranteed and not necessarily complete.
The securities discussed in this material were selected due to recent changes in the strategies. This selection criterion is not based on any measurement of performance of the underlying security.
Washington Crossing Advisors, LLC is a wholly-owned subsidiary and affiliated SEC Registered Investment Adviser of Stifel Financial Corp (NYSE: SF). Registration with the SEC implies no level of sophistication in investment management.


