S&P 500 Risk & Return Attribution (2005-2025*)
We sought to look back at twenty years data for the S&P 500 to study the source of return by company risk category. As the graph and tables that follow show, the results were eye opening.
Key Takeaways
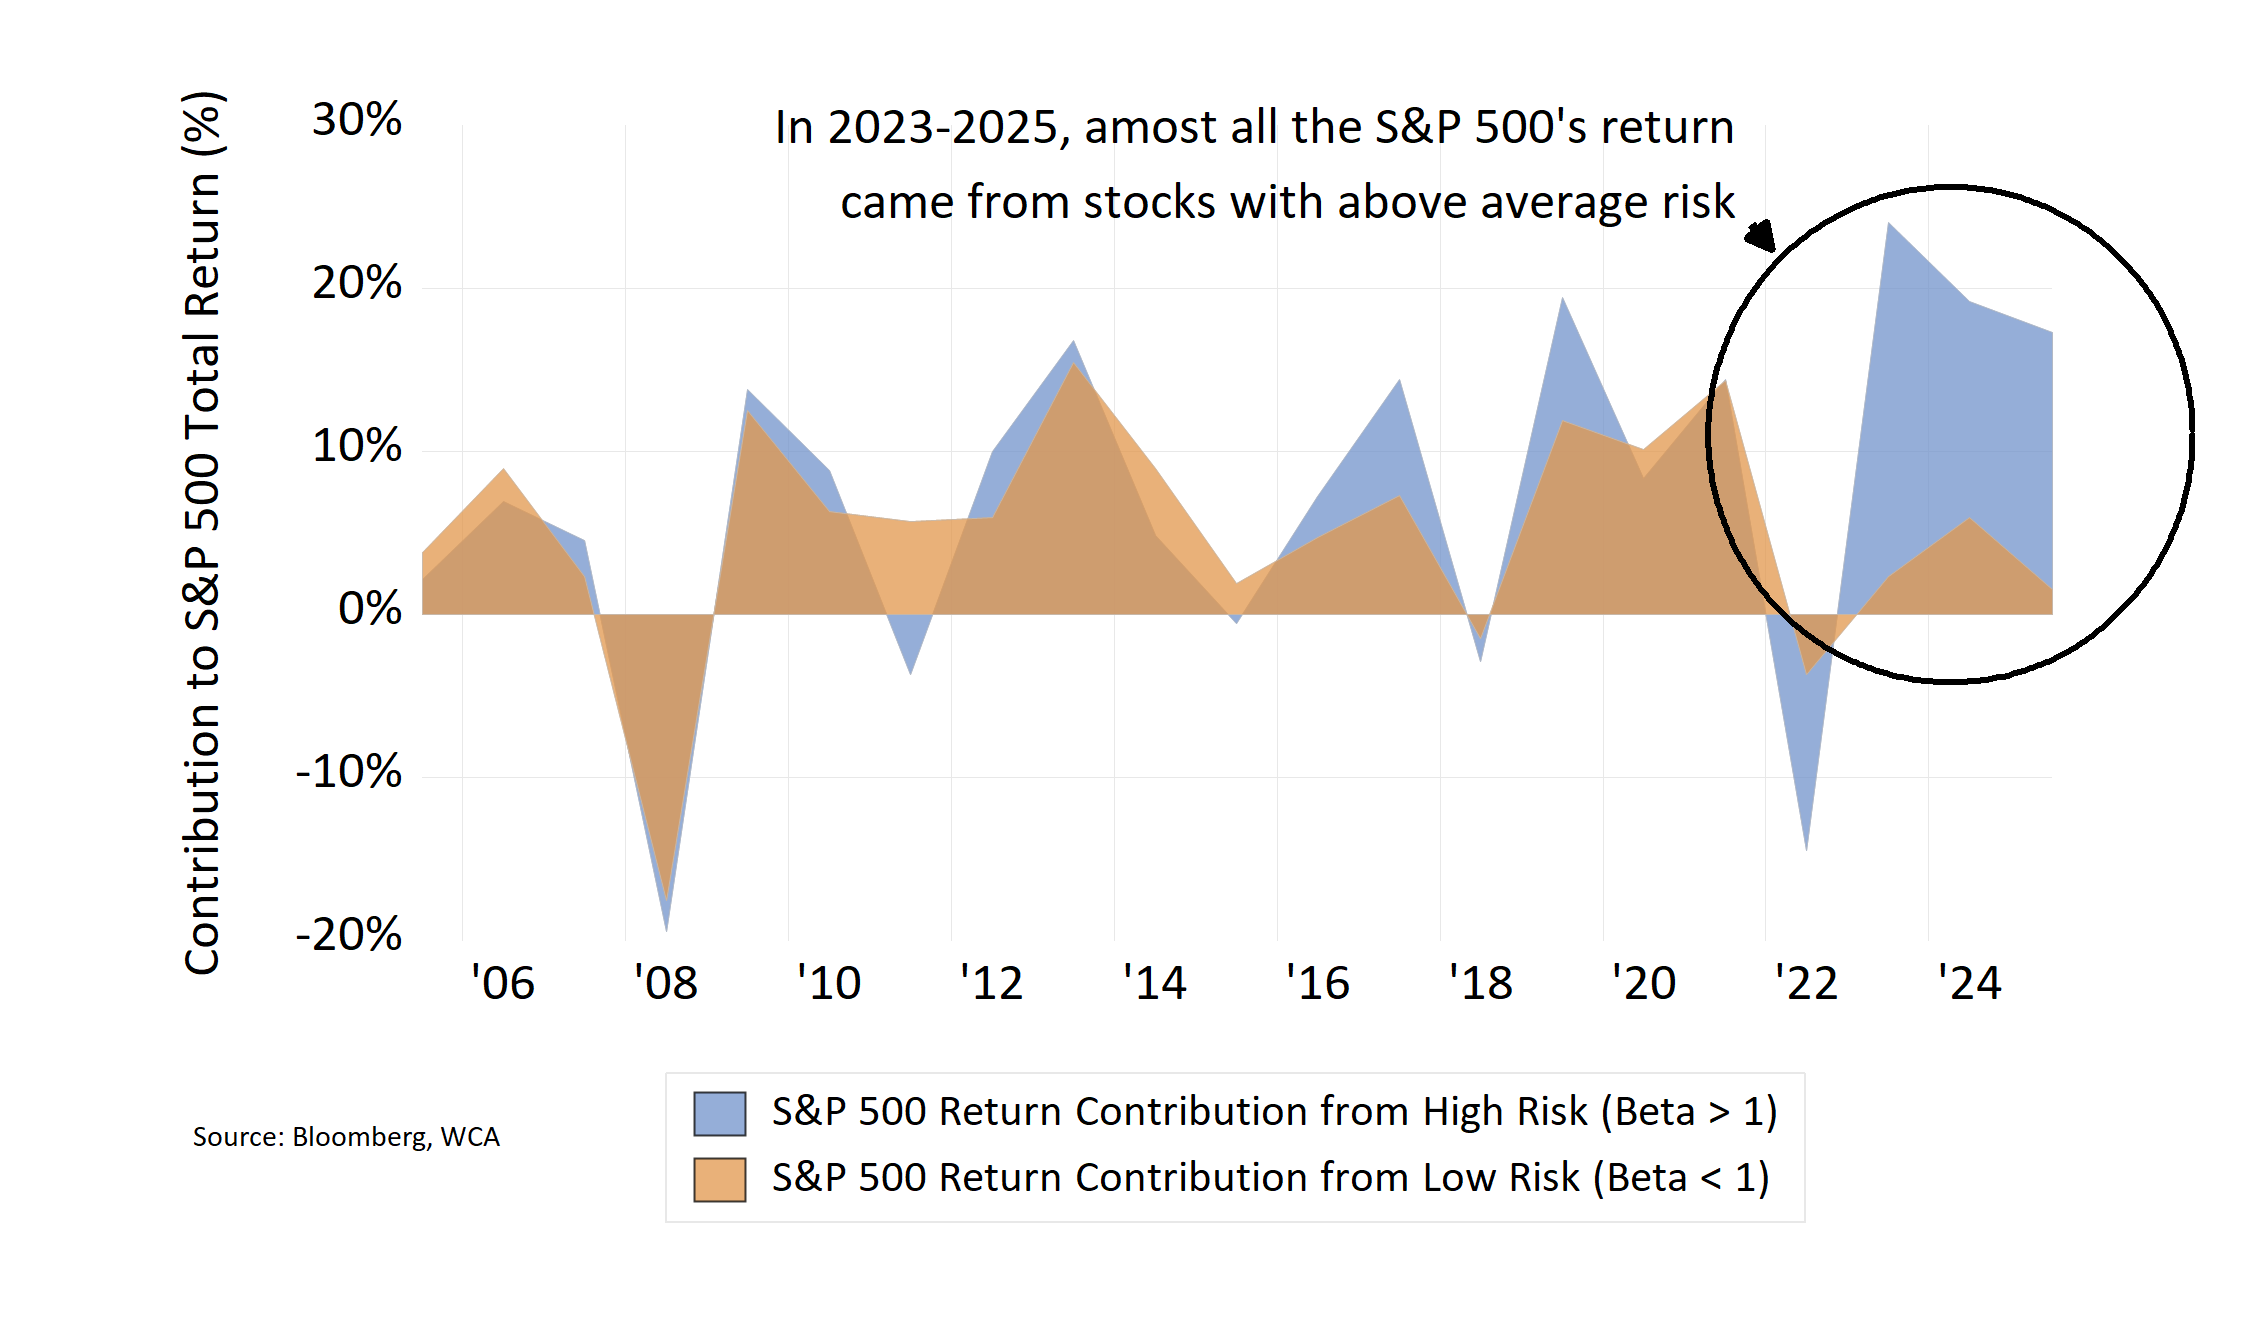
- 83% of the S&P 500’s 2023-2025 return was driven by high-risk stocks. Users of the index for benchmarking purposes must be aware the index return composition has shifted dramatically toward risk. Practitioners may want to revisit whether the benchmark remains aligned with investor risk management objectives.
- A look back over the past two decades reveals 2023-2025 returns as an outlier. Most of the time, rising markets’ leadership is shared between higher and lower risk stocks. There is balance. Since 2023, the balance has been lost. Returns have been skewed toward high risk resulting in lopsided, one-way leadership.
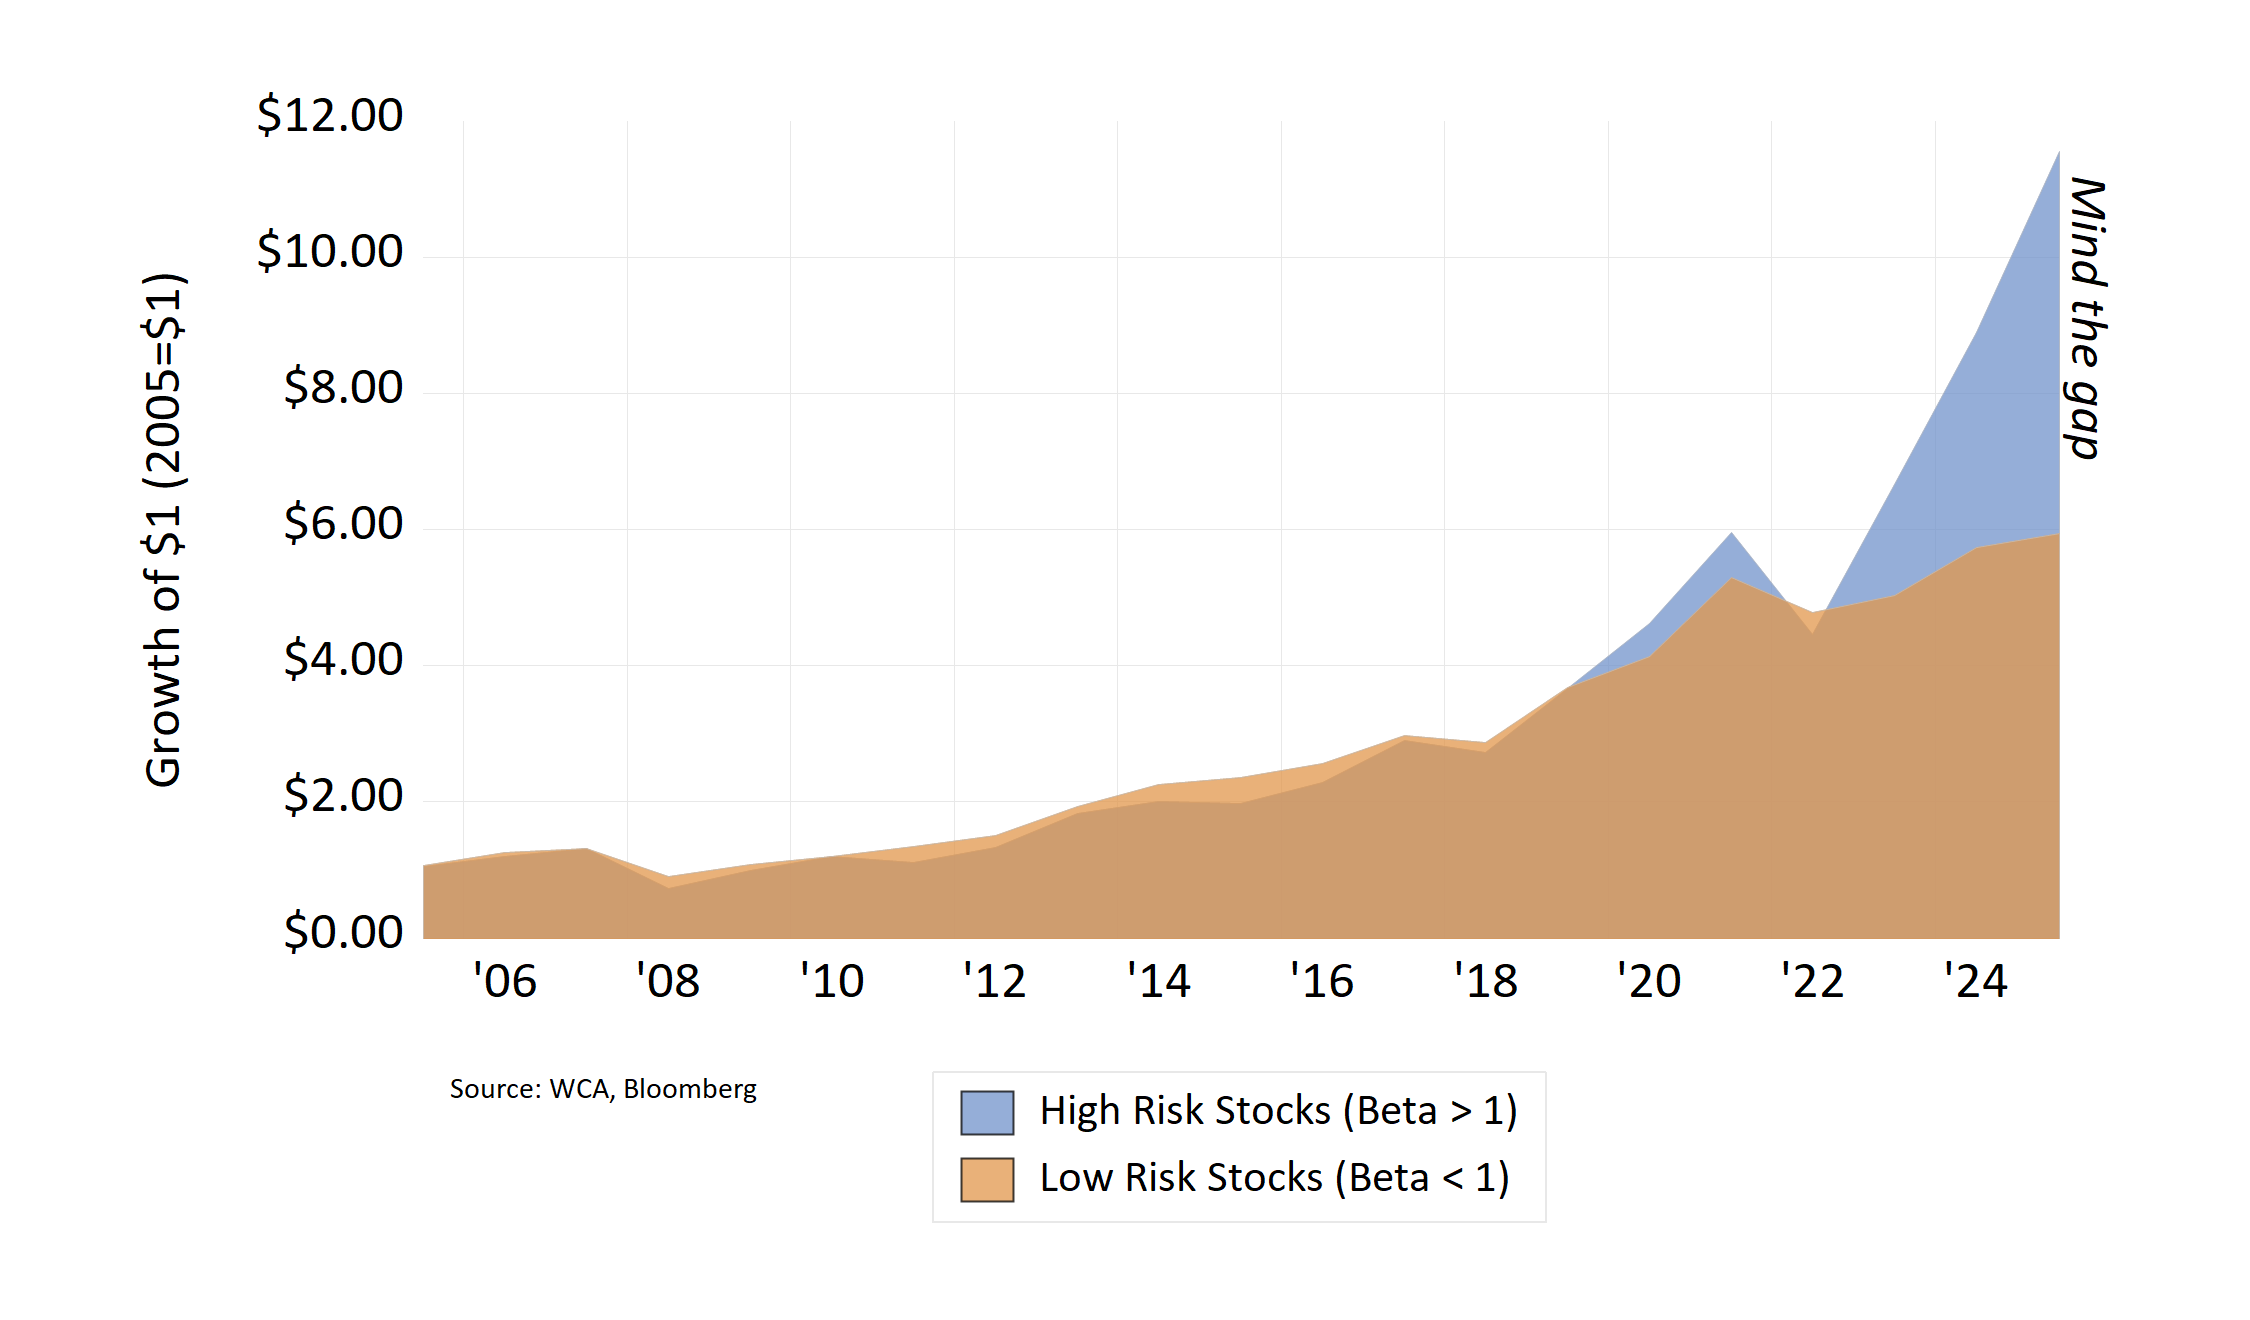
- The concentrated high-risk 2023-2025 rally has been an anomoly and raises risk of potential mean reversion. A significant “gap” has emerged between the value of high-risk and low-risk stocks.
Where Are S&P 500 Returns Coming From?
S&P 500 Raw Data (2005-2025*)
This table shows how S&P 500 returns have evolved since 2005. It breaks the index into two cohesive groups of stocks: Low Risk with betas below 1 and High Risk with betas above 1. The sum of the first two columns add up to the overall S&P 500 total return. The last two columns isolate the returns for each risk category. Note that since 2023, 83% of the overall S&P 500 return has come directly from high risk stocks (for the sake of simplicity, we use basic math – combining the three most recent years of high risk contribution to return and dividing it by the combined total returns for the same time period).
| Date | High Risk Contribution to Return (Beta>1) | Low Risk Contribution to Return (Beta<1) | S&P 500 Total Return | Total Return High Risk (Beta>1) | Total Return Low Risk (Beta<1) |
|---|---|---|---|---|---|
| 2025* | 17.3% | 1.5 | 18.8 | 29.9 | 3.5 |
| 2024 | 19.2 | 5.9 | 25.0 | 33.6 | 14.0 |
| 2023 | 24.0 | 2.3 | 26.3 | 49.3 | 5.4 |
| 2022 | -14.5 | -3.7 | -18.2 | -25.2 | -9.7 |
| 2021 | 14.4 | 14.3 | 28.7 | 29.0 | 27.9 |
| 2020 | 8.3 | 10.1 | 18.4 | 26.3 | 12.5 |
| 2019 | 19.4 | 11.9 | 31.3 | 34.0 | 27.7 |
| 2018 | -2.9 | -1.5 | -4.4 | -5.8 | -3.2 |
| 2017 | 14.4 | 7.3 | 21.8 | 26.9 | 15.8 |
| 2016 | 7.2 | 4.7 | 11.9 | 15.2 | 9.1 |
| 2015 | -0.6 | 1.9 | 1.3 | -1.1 | 4.2 |
| 2014 | 4.8 | 8.9 | 13.7 | 9.9 | 17.2 |
| 2013 | 16.8 | 15.4 | 32.2 | 36.8 | 28.2 |
| 2012 | 10.0 | 5.9 | 15.9 | 19.9 | 12.2 |
| 2011 | -3.7 | 5.7 | 2.0 | -6.6 | 11.3 |
| 2010 | 8.8 | 6.3 | 15.1 | 20.3 | 11.2 |
| 2009 | 13.8 | 12.5 | 26.2 | 36.4 | 20.6 |
| 2008 | -19.5 | -17.6 | -37.0 | -44.8 | -31.5 |
| 2007 | 4.5 | 2.3 | 6.7 | 9.2 | 4.6 |
| 2006 | 6.9 | 8.9 | 15.8 | 14.1 | 17.4 |
| 2005 | 2.1 | 3.8 | 5.9 | 5.5 | 6.7 |
| Annual Return | 10.8% | 12.4% | 8.9% | ||
| Annual Risk** | 16.9% | 22.4% | 13.5% | ||
| Alpha | -0.9% | +0.8% | |||
| Beta | 1.3 | 0.7 |
* YTD through December 10, 2025
** Volatility (Standard Deviation of Returns)
Source: WCA, Bloomberg
High Beta Has Outperformed Overall, But With Much Higher Risk
Higher risk stocks generated ~1.6% more annual return than the S&P 500 over the full period (2005 – 2025), but at the cost of 30% more risk. After factoring in risk, the returns of the S&P 500 and low risk stocks are fairly comparable (near 0.63-0.65). However, high risk stocks lag far behind after factoring in risk (return per unit of risk is only 0.55).
| Index | Annual Return | Volatility (Risk)* | Return / Risk |
|---|---|---|---|
| S&P 500 | 10.8% | 16.9% | 0.63 |
| High Risk (Beta > 1) | 12.4% | 22.4% | 0.55 |
| Low Risk (Beta < 1) | 8.9% | 13.5% | 0.65 |
* Annualized volatility
Source: WCA, Bloomberg
Asymmetry Rules: High Beta Amplifies Losses and Gains
Even after the massive high-beta runup from 2023-2025, regressing against the S&P 500 for 2005-2025 reveals:
- High risk companies: implied Beta = 1.3, Alpha = -0.9%
- Low risk companies: implied Beta = 0.7, Alpha = +0.8%
A core tenet of financial theory suggests holding higher beta (risky) stocks should yield higher returns, but empirical data often shows high-beta stocks often underperform low-beta stocks. To read more about this phenomenon, we recommend a paper titled “Betting Against Beta” by New York Unversity Finance Professor Aswath Damodaran. While the paper was written over a decade ago, it appears that even in the bull market that followed the paper’s publishing, betting against high-risk and high-beta proved to hold water.
In the Short-Run, Market Regime is Key
This should come as no surprise. Lower risk stocks tend to do better in difficult markets. Higher risk stocks tend to do better in rising markets.
| Market Regime (2023-2025) | S&P 500 Average Annual Return | High Risk (Beta>1) Average Annual Return | Low Risk (Beta<1) Average Annual Return | Winner |
|---|---|---|---|---|
| Up Markets (18) | +17.6% | +21.6% | +13.9% | High Risk (+7.7%) |
| Down Markets (3) | -19.9% | -25.3% | -14.8% | Low Risk (+10.5%) |
Source: WCA, Bloomberg
Recent Years: A Dramatic Shift Toward High Risk
The Current Period in Context
As you can see below, the 2023–2025 window is off the chart for high-risk, raising the probability of mean reversion.
High Risk Stocks’ Rally Exposes Significant Gap
(Mean Reversion Risk High)
This is not a normal market. Over the past three years, the performance gap between high-risk and low-risk stocks has blown out. Where a relatively steady relationship used to exist between higher and lower risk investing styles, the risk-on market of 2023-2025 has created a large gap. The higher risk index (blue area) below appears positioned to revert to the mean as valuations become significantly stretched.
Conclusion
We performed this risk and return attribution of one of the most common indices to help us better understand what kind of risks are undertaken when investing in a strategy that tracks the index. We discover that it is helpful to break the S&P 500 into two distinct types of investments—high risk (high beta) and low risk (low beta). In this way, we can study what drives performance of the index from one period to another.
We find that it is critical to understand that the S&P 500 is not a static index with static risk dynamics. Instead it is a continually changing benchmark with massive shifts in risk composition. The relative proportion of these two investment types shift over time without regard to any one individual investor’s goals, risk tolerance, or circumstances. Over time, however, there is evidence that the two types of investments obey basic logic of mean reversion.
We also see that the most recent stretch of returns for the S&P 500 skews massively toward high risk style companies which accounted for 83% of the S&P 500 index’s return since 2023. This shift is historic and substantial, measuring a several standard deviation move away from the historic average. Such a move suggests that mean reversion risk is high when comparing high versus low beta strategies.
Kevin R. Caron, CFA
Senior Portfolio Manager
973-549-4051
Chad Morganlander
Senior Portfolio Manager
973-549-4052
Steve Lerit, CFA
Head of Portfolio Risk
973-549-4028
Eric Needham
External Sales and Marketing
312-771-6010
Matthew Battipaglia
Portfolio Manager
973-549-4047
Jeffrey Battipaglia
Client Portfolio Manager
973-549-4031
Suzanne Ashley
Internal Relationship Manager
973-549-4168
S&P 500 — The Standard & Poor’s 500 Index is a capitalization-weighted index that is generally considered representative of the U.S. large capitalization market.
Indices are unmanaged, and it is not possible to invest directly in an index. All benchmark returns presented are provided to represent the investment environment existing during the time periods shown. Actual investment performance will vary due to fees and expenses. For comparison purposes, the benchmarks include the reinvestment of income. The benchmarks are unmanaged and unavailable for direct investment.
The S&P 500 High Beta Index measures the performance of 100 constituents in the S&P 500 that are most sensitive to changes in the market. Constituents are weighted relative to their level of market sensitivity, with each stock assigned a weight proportional to its beta.
The S&P 500 Low Volatility Index measures performance of the 100 least volatile stocks in the S&P 500. The index benchmarks low volatility or low variance strategies for the U.S. stock market. Constituents are weighted relative to the inverse of their corresponding volatility, with the least volatile stocks receiving the highest weights.
Disclosures:
WCA Barometer – We regularly assess changes in fundamental conditions to help guide near-term asset allocation decisions. Analysis incorporates approximately 30 forward-looking indicators in categories ranging from Credit and Capital Markets to U.S. Economic Conditions and Foreign Conditions. From each category of data, we create three diffusion-style sub-indices that measure the trends in the underlying data. Sustained improvement that is spread across a wide variety of observations will produce index readings above 50 (potentially favoring stocks), while readings below 50 would indicate potential deterioration (potentially favoring bonds). The WCA Fundamental Conditions Index combines the three underlying categories into a single summary measure. This measure can be thought of as a “barometer” for changes in fundamental conditions.
Standard & Poor’s 500 Index (S&P 500) is a capitalization-weighted index that is generally considered representative of the U.S. large capitalization market.
The S&P 500® Information Technology comprises those companies included in the S&P 500 that are classified as members of the GICS® information technology sector.
S&P Global (SPGI) is a leading American provider of financial information, analytics, and credit ratings, headquartered in New York, NY. It operates major divisions including S&P Global Ratings, S&P Global Market Intelligence, S&P Global Commodity Insights, S&P Global Mobility, and S&P Dow Jones Indices.
The ICE BofA U.S. High Yield Index is an unmanaged index that tracks the performance of U.S. dollar denominated, below investment-grade rated corporate debt publicly issued in the U.S. domestic market.
The S&P 500 Growth measures constituents from the S&P 500 that are classified as growth stocks based on three factors: sales growth, the ratio of earnings change to price, and momentum.
The S&P 500 Value Index measures constituents from the S&P 500 that are classified as value stocks based on three factors: the ratios of book value, earnings and sales to price.
The S&P 500 Equal Weight Index is the equal-weight version of the widely regarded Standard & Poor’s 500 Index, which is generally considered representative of the U.S. large capitalization market. The index has the same constituents as the capitalization-weighted S&P 500, but each company in the index is allocated a fixed weight of 0.20% at each quarterly rebalancing.
The WCA Rising Dividend Custom Benchmark is a rules-based benchmark constructed by Washington Crossing Advisors to represent a universe of large capitalization U.S. companies that meet certain quality and dividend growth criteria, including proprietary screens for profitability, earnings consistency, and balance sheet strength, along with minimum market capitalization and dividend growth requirements. The benchmark is reconstituted and rebalanced quarterly and is intended to serve as a style-appropriate benchmark for the WCA Rising Dividend strategy.
The Washington Crossing Advisors’ High Quality Index and Low Quality Index are objective, quantitative measures designed to identify quality in the top 1,000 U.S. companies. Ranked by fundamental factors, WCA grades companies from “A” (top quintile) to “F” (bottom quintile). Factors include debt relative to equity, asset profitability, and consistency in performance. Companies with lower debt, higher profitability, and greater consistency earn higher grades. These indices are reconstituted annually and rebalanced daily. For informational purposes only, and WCA Quality Grade indices do not reflect the performance of any WCA investment strategy.
The risk of loss in trading commodities and futures can be substantial. You should therefore carefully consider whether such trading is suitable for you in light of your financial condition. The high degree of leverage that is often obtainable in commodity trading can work against you as well as for you. The use of leverage can lead to large losses as well as gains.
The information contained herein has been prepared from sources believed to be reliable but is not guaranteed by us and is not a complete summary or statement of all available data, nor is it considered an offer to buy or sell any securities referred to herein. Opinions expressed are subject to change without notice and do not take into account the particular investment objectives, financial situation, or needs of individual investors. There is no guarantee that the figures or opinions forecast in this report will be realized or achieved. Employees of Stifel, Nicolaus & Company, Incorporated or its affiliates may, at times, release written or oral commentary, technical analysis, or trading strategies that differ from the opinions expressed within. Past performance is no guarantee of future results. Indices are unmanaged, and you cannot invest directly in an index.
Asset allocation and diversification do not ensure a profit and may not protect against loss. There are special considerations associated with international investing, including the risk of currency fluctuations and political and economic events. Changes in market conditions or a company’s financial condition may impact a company’s ability to continue to pay dividends, and companies may also choose to discontinue dividend payments. Investing in emerging markets may involve greater risk and volatility than investing in more developed countries. Due to their narrow focus, sector-based investments typically exhibit greater volatility. Small-company stocks are typically more volatile and carry additional risks since smaller companies generally are not as well established as larger companies. Property values can fall due to environmental, economic, or other reasons, and changes in interest rates can negatively impact the performance of real estate companies. When investing in bonds, it is important to note that as interest rates rise, bond prices will fall. High-yield bonds have greater credit risk than higher-quality bonds. Bond laddering does not assure a profit or protect against loss in a declining market. The risk of loss in trading commodities and futures can be substantial. You should therefore carefully consider whether such trading is suitable for you in light of your financial condition. The high degree of leverage that is often obtainable in commodity trading can work against you as well as for you. The use of leverage can lead to large losses as well as gains. Changes in market conditions or a company’s financial condition may impact a company’s ability to continue to pay dividends, and companies may also choose to discontinue dividend payments.
All investments involve risk, including loss of principal, and there is no guarantee that investment objectives will be met. It is important to review your investment objectives, risk tolerance, and liquidity needs before choosing an investment style or manager. Equity investments are subject generally to market, market sector, market liquidity, issuer, and investment style risks, among other factors to varying degrees. Fixed Income investments are subject to market, market liquidity, issuer, investment style, interest rate, credit quality, and call risks, among other factors to varying degrees.
Beta is a measure of the volatility, or systematic risk, of a security or a portfolio relative to the market as a whole. A beta of one is considered as risky as the benchmark and is therefore likely to provide expected returns approximate to those of the benchmark during both up and down periods. A portfolio with a beta of two would move approximately twice as much as the benchmark.
Standard deviation is a measure of the volatility of a security’s or portfolio’s returns in relation to the mean return. The larger the standard deviation, the greater the volatility of return in relation to the mean return.
Changes in market conditions or a company’s financial condition may impact a company’s ability to continue to pay dividends, and companies may also choose to discontinue dividend payments
This commentary often expresses opinions about the direction of market, investment sector, and other trends. The opinions should not be considered predictions of future results. The information contained in this report is based on sources believed to be reliable, but is not guaranteed and not necessarily complete.
The securities discussed in this material were selected due to recent changes in the strategies. This selection criterion is not based on any measurement of performance of the underlying security.
Washington Crossing Advisors, LLC is a wholly-owned subsidiary and affiliated SEC Registered Investment Adviser of Stifel Financial Corp (NYSE: SF). Registration with the SEC implies no level of sophistication in investment management.