Reading the Risk Hidden Inside Growth Expectations
When most of us think about growth, the focus is usually on how quickly a company might expand in the future and, sometimes, on recent growth. But the more important question for your portfolio may actually be not how much growth a company might deliver — it is how confident we can be in that growth. We will argue here that during risk-loving bull markets (like today), focus tends to shift to the “how much” question, and during more normal, risk-aware markets, reverts to the “how confident” question.
To prove our point, we will offer three charts. The first chart in this series (Chart A, below), which compares market-implied 10-year growth rates across our WCA Quality Grades, puts the question of growth into sharp relief. And once you see what the data is illustrating, the implications become difficult to ignore.
Defining What “Growth” Means
Before diving into the chart, it would be good to define what we mean by “growth” here. After all, growth is one of the most slippery concepts in finance. Ask ten people what growth is, and you are likely to get ten different answers. Some will point to the most recent quarter. Others will look back a year or five years. Analysts will give you forward estimates. Management teams will offer their own projections. All of these definitions differ, and all rely on subjective judgment about how and what we are actually measuring.
In that sense, growth is mercurial. It shifts depending on which measure you emphasize and which time horizon you choose.
Here, however, we take a different approach — one that avoids the biases baked into traditional definitions. Instead of focusing on accounting outcomes or analyst estimates, we rely on an impartial arbiter: the market itself. By examining the growth rate the market is willing to price into a stock, we get to the heart of the matter. Whatever hopes or assumptions any one person may hold, it is ultimately the market’s collective judgment that shapes valuations, expectations, and long-run outcomes. Observing the market’s implied growth rate baked into every stock, therefore, deserves first consideration when evaluating the durability of a company’s prospects, especially when comparing high- and low-quality firms.
What the First Chart Reveals – The Shape of Risk
Now, with what we mean by growth clearly defined, consider what the first chart below shows. At first glance, note that the median implied growth rate does not fall dramatically as you move from high-quality “A” companies to low-quality “F” companies. Intuition might suggest otherwise. One would expect companies with stronger balance sheets, steadier cash flows, and more predictable earnings to command meaningfully higher growth expectations. But the mechanics of implied growth explain why the medians remain relatively close.
Chart A
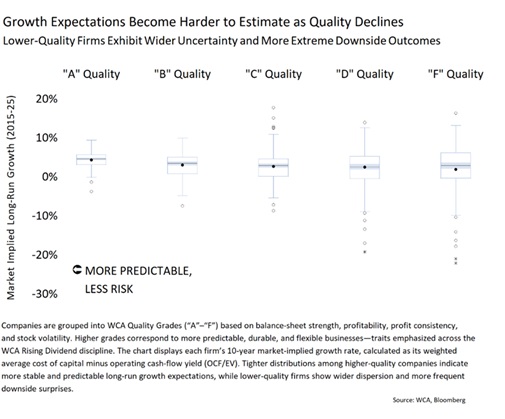
Implied growth is calculated as a company’s weighted average cost of capital minus its operating cash-flow yield. Lower-quality companies face a higher cost of capital, reflecting their elevated risk. Yet those same risks also tend to push their valuations lower, which increases their cash-flow yields. These opposing forces partially offset each other. That is why the median implied growth rate does not collapse as quality declines.
But focusing on the median growth rate misses the essential point.
The Expanding Distribution of Low Quality
The most critical insight in the chart is the widening of the distributions: as quality declines, the range of possible outcomes expands massively. And here we get to the crux of the issue. That widening is precisely why lower-quality companies can look so appealing in a risk-hungry market. The upside tail part of the distribution feels incredibly exciting, and that excitement can blind us to the downside tail. And just look at that downside tail part of the distribution of low-quality “F” stocks. That lower tail is just as real — and often far more damaging. What seems like rapid growth in calm conditions usually turns out to be a chimera, one that can completely unravel when risk appetite swings the other way.
Such regular yet sudden shifts betray the structural vulnerabilities embedded in many exciting but low-quality companies. Risk is not defined by the average outcome; it is defined by the range of outcomes — especially the negative ones. Lower-quality companies inhabit the widest and most dangerous part of that range. Higher-quality companies occupy the narrow, predictable center. For anyone concerned with long-term capital preservation, this distinction is fundamental.
Now, we would like to talk about where we are in the cycle.
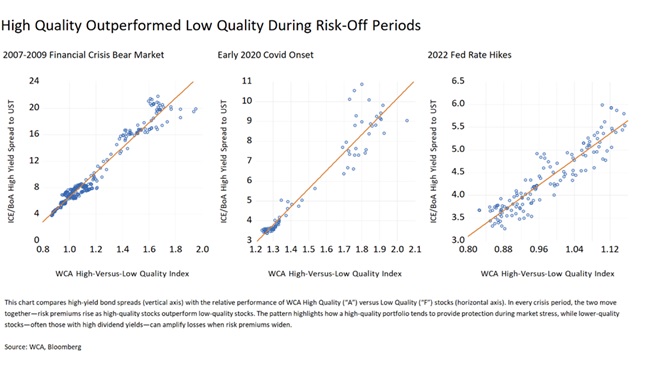
Risk Shows Itself When Conditions Change
The next two charts reinforce this logic by showing how markets behaved under stress. When conditions deteriorated — as they did during the 2007–2009 financial crisis, in the early stages of COVID-19, and throughout the rapid rate increases of 2022 — high-yield credit spreads widened sharply. In every one of those periods, high-quality companies strengthened their leadership over low-quality with near-perfect consistency. When concerns arose, the market systematically abandoned fragility in favor of durability, stability, and resilience. This process is not episodic; it has been a persistent feature of market behavior.
Chart B
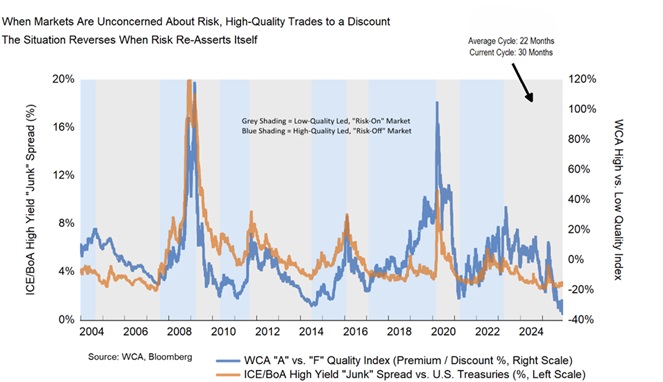
Today’s Environment: Uncompensated Risk in a long Low-Quality Cycle
Now consider where things stand today (Chart C, below). For more than 30 months, the environment has rewarded greater risk-taking. High-yield spreads have fallen to unusually low levels, meaning the compensation for bearing risk is historically thin. Predictably, low-quality companies have led during this stretch. But the first chart exposes the underlying fragility: these companies sit atop the broadest and most precarious distribution of possible outcomes. When conditions eventually change — and history suggests they will — the adjustments tend to be swift.
Chart C
Why Quality Matters Before the Cycle Turns
Maintaining a focus on quality is not about chasing what worked last month or last quarter. It is about understanding the structural vulnerabilities inherent in low-quality companies and choosing not to expose your portfolio to unnecessary downside. If you are allocating new capital or rebalancing after a period of speculative gains, this may be an especially prudent moment to lean toward financially stronger, more predictable businesses.
Cycles turn. When they do, quality leadership tends to reemerge with speed and conviction. The evidence borne out time and again in history compels a choice. That choice comes down to one of quality. And we at Washington Crossing Advisors remain committed to choosing quality over uncompensated, low-quality risk or ephemeral growth.
Kevin R. Caron, CFA
Senior Portfolio Manager
973-549-4051
Chad Morganlander
Senior Portfolio Manager
973-549-4052
Steve Lerit, CFA
Head of Portfolio Risk
973-549-4028
Eric Needham
External Sales and Marketing
312-771-6010
Matthew Battipaglia
Portfolio Manager
973-549-4047
Jeffrey Battipaglia
Client Portfolio Manager
973-549-4031
Suzanne Ashley
Internal Relationship Manager
973-549-4168
Disclosures:
WCA Barometer – We regularly assess changes in fundamental conditions to help guide near-term asset allocation decisions. Analysis incorporates approximately 30 forward-looking indicators in categories ranging from Credit and Capital Markets to U.S. Economic Conditions and Foreign Conditions. From each category of data, we create three diffusion-style sub-indices that measure the trends in the underlying data. Sustained improvement that is spread across a wide variety of observations will produce index readings above 50 (potentially favoring stocks), while readings below 50 would indicate potential deterioration (potentially favoring bonds). The WCA Fundamental Conditions Index combines the three underlying categories into a single summary measure. This measure can be thought of as a “barometer” for changes in fundamental conditions.
Standard & Poor’s 500 Index (S&P 500) is a capitalization-weighted index that is generally considered representative of the U.S. large capitalization market.
S&P Global (SPGI) is a leading American provider of financial information, analytics, and credit ratings, headquartered in New York, NY. It operates major divisions including S&P Global Ratings, S&P Global Market Intelligence, S&P Global Commodity Insights, S&P Global Mobility, and S&P Dow Jones Indices.
The ICE BofA U.S. High Yield Index is an unmanaged index that tracks the performance of U.S. dollar denominated, below investment-grade rated corporate debt publicly issued in the U.S. domestic market.
The S&P 500 Growth measures constituents from the S&P 500 that are classified as growth stocks based on three factors: sales growth, the ratio of earnings change to price, and momentum.
The S&P 500 Value Index measures constituents from the S&P 500 that are classified as value stocks based on three factors: the ratios of book value, earnings and sales to price.
The S&P 500 Equal Weight Index is the equal-weight version of the widely regarded Standard & Poor’s 500 Index, which is generally considered representative of the U.S. large capitalization market. The index has the same constituents as the capitalization-weighted S&P 500, but each company in the index is allocated a fixed weight of 0.20% at each quarterly rebalancing.
The WCA Rising Dividend Custom Benchmark is a rules-based benchmark constructed by Washington Crossing Advisors to represent a universe of large capitalization U.S. companies that meet certain quality and dividend growth criteria, including proprietary screens for profitability, earnings consistency, and balance sheet strength, along with minimum market capitalization and dividend growth requirements. The benchmark is reconstituted and rebalanced quarterly and is intended to serve as a style-appropriate benchmark for the WCA Rising Dividend strategy.
The Washington Crossing Advisors’ High Quality Index and Low Quality Index are objective, quantitative measures designed to identify quality in the top 1,000 U.S. companies. Ranked by fundamental factors, WCA grades companies from “A” (top quintile) to “F” (bottom quintile). Factors include debt relative to equity, asset profitability, and consistency in performance. Companies with lower debt, higher profitability, and greater consistency earn higher grades. These indices are reconstituted annually and rebalanced daily. For informational purposes only, and WCA Quality Grade indices do not reflect the performance of any WCA investment strategy.
The risk of loss in trading commodities and futures can be substantial. You should therefore carefully consider whether such trading is suitable for you in light of your financial condition. The high degree of leverage that is often obtainable in commodity trading can work against you as well as for you. The use of leverage can lead to large losses as well as gains.
The information contained herein has been prepared from sources believed to be reliable but is not guaranteed by us and is not a complete summary or statement of all available data, nor is it considered an offer to buy or sell any securities referred to herein. Opinions expressed are subject to change without notice and do not take into account the particular investment objectives, financial situation, or needs of individual investors. There is no guarantee that the figures or opinions forecast in this report will be realized or achieved. Employees of Stifel, Nicolaus & Company, Incorporated or its affiliates may, at times, release written or oral commentary, technical analysis, or trading strategies that differ from the opinions expressed within. Past performance is no guarantee of future results. Indices are unmanaged, and you cannot invest directly in an index.
Asset allocation and diversification do not ensure a profit and may not protect against loss. There are special considerations associated with international investing, including the risk of currency fluctuations and political and economic events. Changes in market conditions or a company’s financial condition may impact a company’s ability to continue to pay dividends, and companies may also choose to discontinue dividend payments. Investing in emerging markets may involve greater risk and volatility than investing in more developed countries. Due to their narrow focus, sector-based investments typically exhibit greater volatility. Small-company stocks are typically more volatile and carry additional risks since smaller companies generally are not as well established as larger companies. Property values can fall due to environmental, economic, or other reasons, and changes in interest rates can negatively impact the performance of real estate companies. When investing in bonds, it is important to note that as interest rates rise, bond prices will fall. High-yield bonds have greater credit risk than higher-quality bonds. Bond laddering does not assure a profit or protect against loss in a declining market. The risk of loss in trading commodities and futures can be substantial. You should therefore carefully consider whether such trading is suitable for you in light of your financial condition. The high degree of leverage that is often obtainable in commodity trading can work against you as well as for you. The use of leverage can lead to large losses as well as gains. Changes in market conditions or a company’s financial condition may impact a company’s ability to continue to pay dividends, and companies may also choose to discontinue dividend payments.
All investments involve risk, including loss of principal, and there is no guarantee that investment objectives will be met. It is important to review your investment objectives, risk tolerance, and liquidity needs before choosing an investment style or manager. Equity investments are subject generally to market, market sector, market liquidity, issuer, and investment style risks, among other factors to varying degrees. Fixed Income investments are subject to market, market liquidity, issuer, investment style, interest rate, credit quality, and call risks, among other factors to varying degrees.
Beta is a measure of the volatility, or systematic risk, of a security or a portfolio relative to the market as a whole. A beta of one is considered as risky as the benchmark and is therefore likely to provide expected returns approximate to those of the benchmark during both up and down periods. A portfolio with a beta of two would move approximately twice as much as the benchmark.
Standard deviation is a measure of the volatility of a security’s or portfolio’s returns in relation to the mean return. The larger the standard deviation, the greater the volatility of return in relation to the mean return.
Changes in market conditions or a company’s financial condition may impact a company’s ability to continue to pay dividends, and companies may also choose to discontinue dividend payments
This commentary often expresses opinions about the direction of market, investment sector, and other trends. The opinions should not be considered predictions of future results. The information contained in this report is based on sources believed to be reliable, but is not guaranteed and not necessarily complete.
The securities discussed in this material were selected due to recent changes in the strategies. This selection criterion is not based on any measurement of performance of the underlying security.
Washington Crossing Advisors, LLC is a wholly-owned subsidiary and affiliated SEC Registered Investment Adviser of Stifel Financial Corp (NYSE: SF). Registration with the SEC implies no level of sophistication in investment management.


