Rate Shock: How Bad is It?
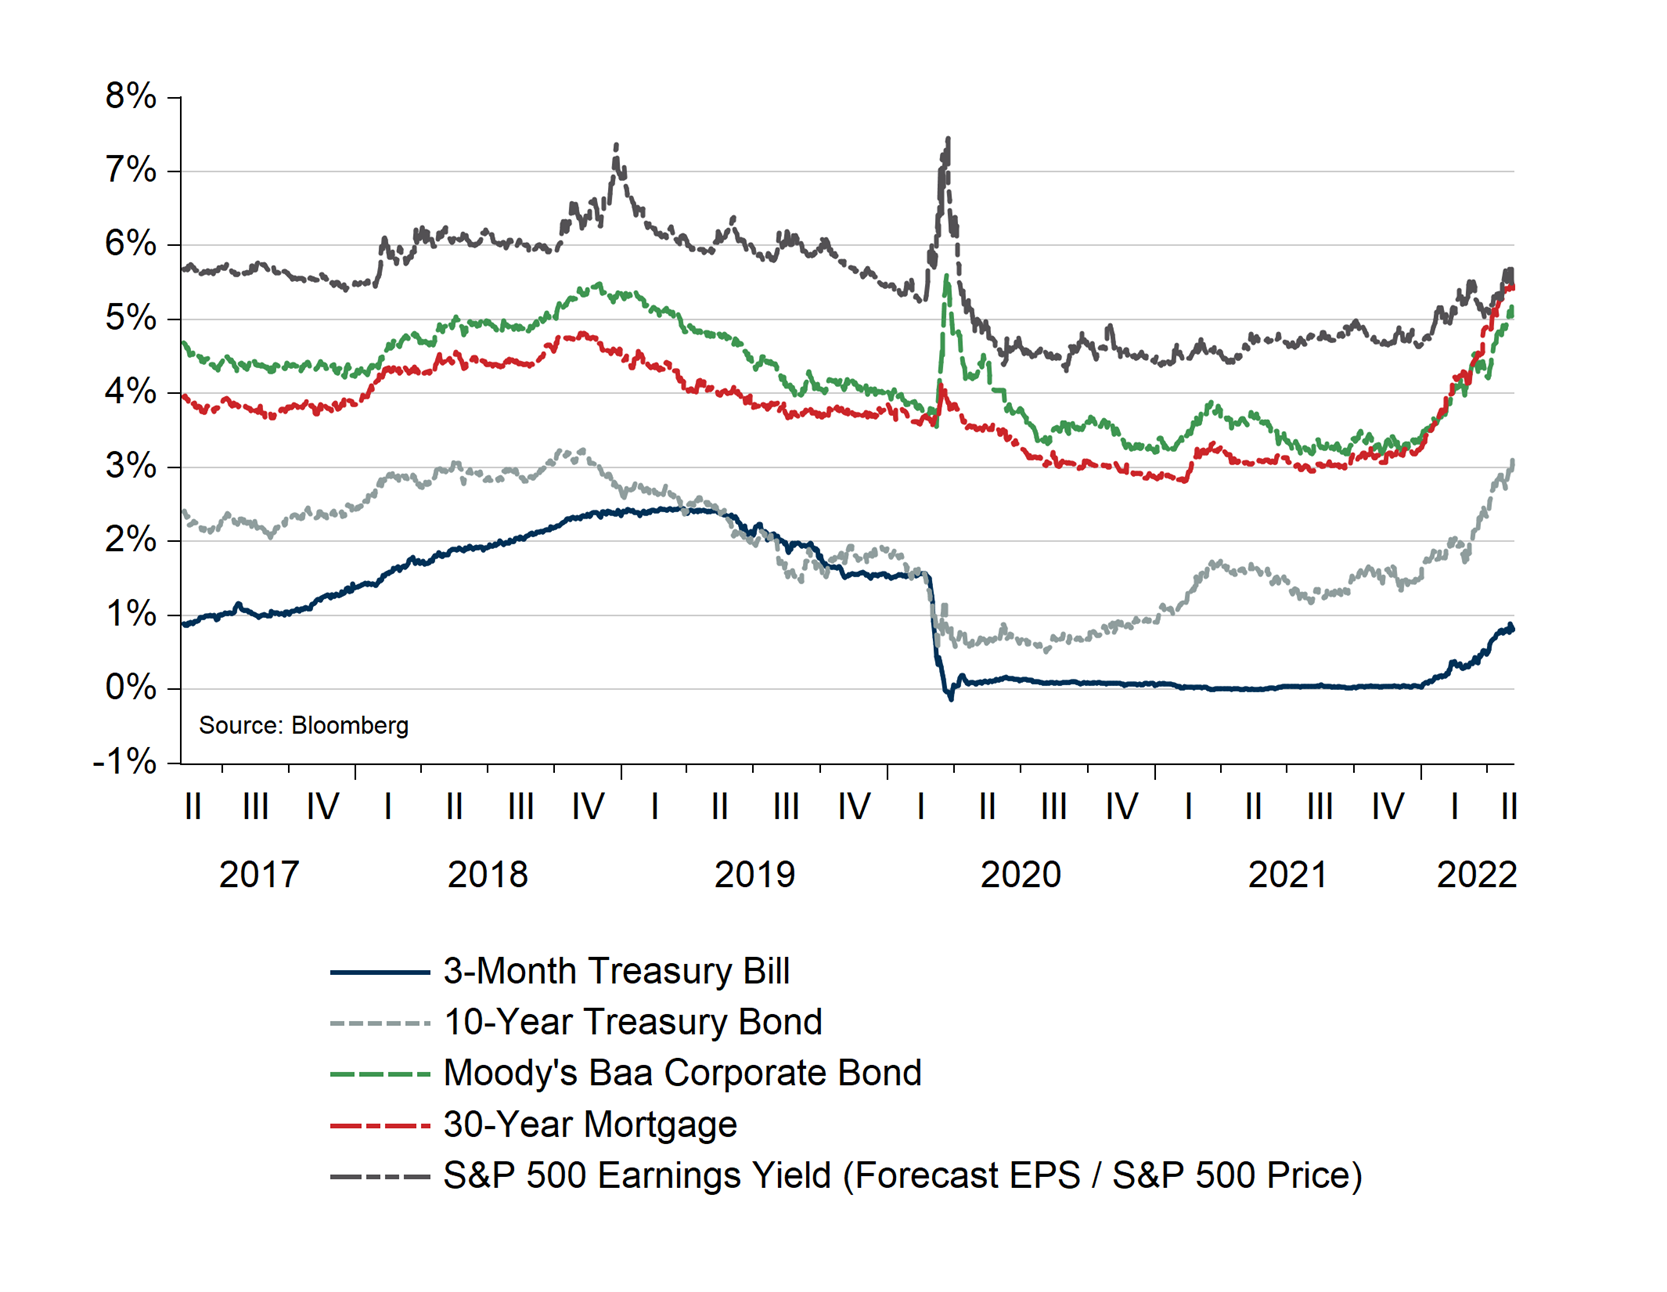
Rising interest rates are a challenge for the bull case. Rates are rising, not because real growth is picking up, but because inflation is forcing central banks to rethink policy. As Chart A (below) shows, different yields across markets are making new highs. These increases are forcing a rethink of valuations and adding to volatility.
Since the start of the year:
- 3-Month Treasury Bill Yields are up to 0.9% from 0.0%;
- 10-Year Treasury Bond Yields doubled to 3% from 1.5%;
- 30-Year mortgages rose to early 5.5% from 3.25%;
- Baa Corporate Bond Yields are now 5.2% from 3.3%;
- The S&P 500 earnings yield (12-month forecast earnings divided by price) is up to 5.7% from 4.7%.
Bond Market Surprised
These increases came as a surprise — even “sleepy” bonds like 5-year U.S. Treasury bonds lost 7% from January through April. This four-month decline ranks among the most considerable historical losses for the instrument. Even bond investors holding highly conservative, intermediate-term Treasuries experienced unusual pain. At the long end of the Treasury spectrum, holders of zero-coupon 30-year U.S. Treasury bonds lost about 25%.
The good news, of course, is that rising rates mean savers will be able to reinvest cash from coupons and maturing bonds at more attractive rates. The positive impact on wealth from higher reinvestment rates can be significant, especially for investors with a long horizon.
Chart A
Yields Rise Across Markets
More Costly to Borrow
Of course, not everyone benefits from higher rates. Consider a person borrowing for a home purchase. A $275,000 mortgage cost $1,088 per month at 3.25% back in January. Today’s same mortgage costs $1,419 now that the average 30-year U.S. mortgage stands at 5.5%. That extra $419 per month comes when the average home price is up 35%, based on the S&P Case/Shiller National Home Price Index.
A similar rise can be seen for corporate borrowers. The average yield on a Baa issuer is now 5.2% versus 3.3% in January. Still, the increase was primarily due to a jump in Treasury yields, so there is no real sign markets are all that worried about corporate defaults. The “spread” or difference between Baa corporate bonds and a 10-year U.S. Treasury bond increased slightly. That spread increased to 2.2% today from 1.80% in January. Over the past five years, the spread ranged between 1.75% and 2.75%, leaving today’s 2.2% near the center of the range.
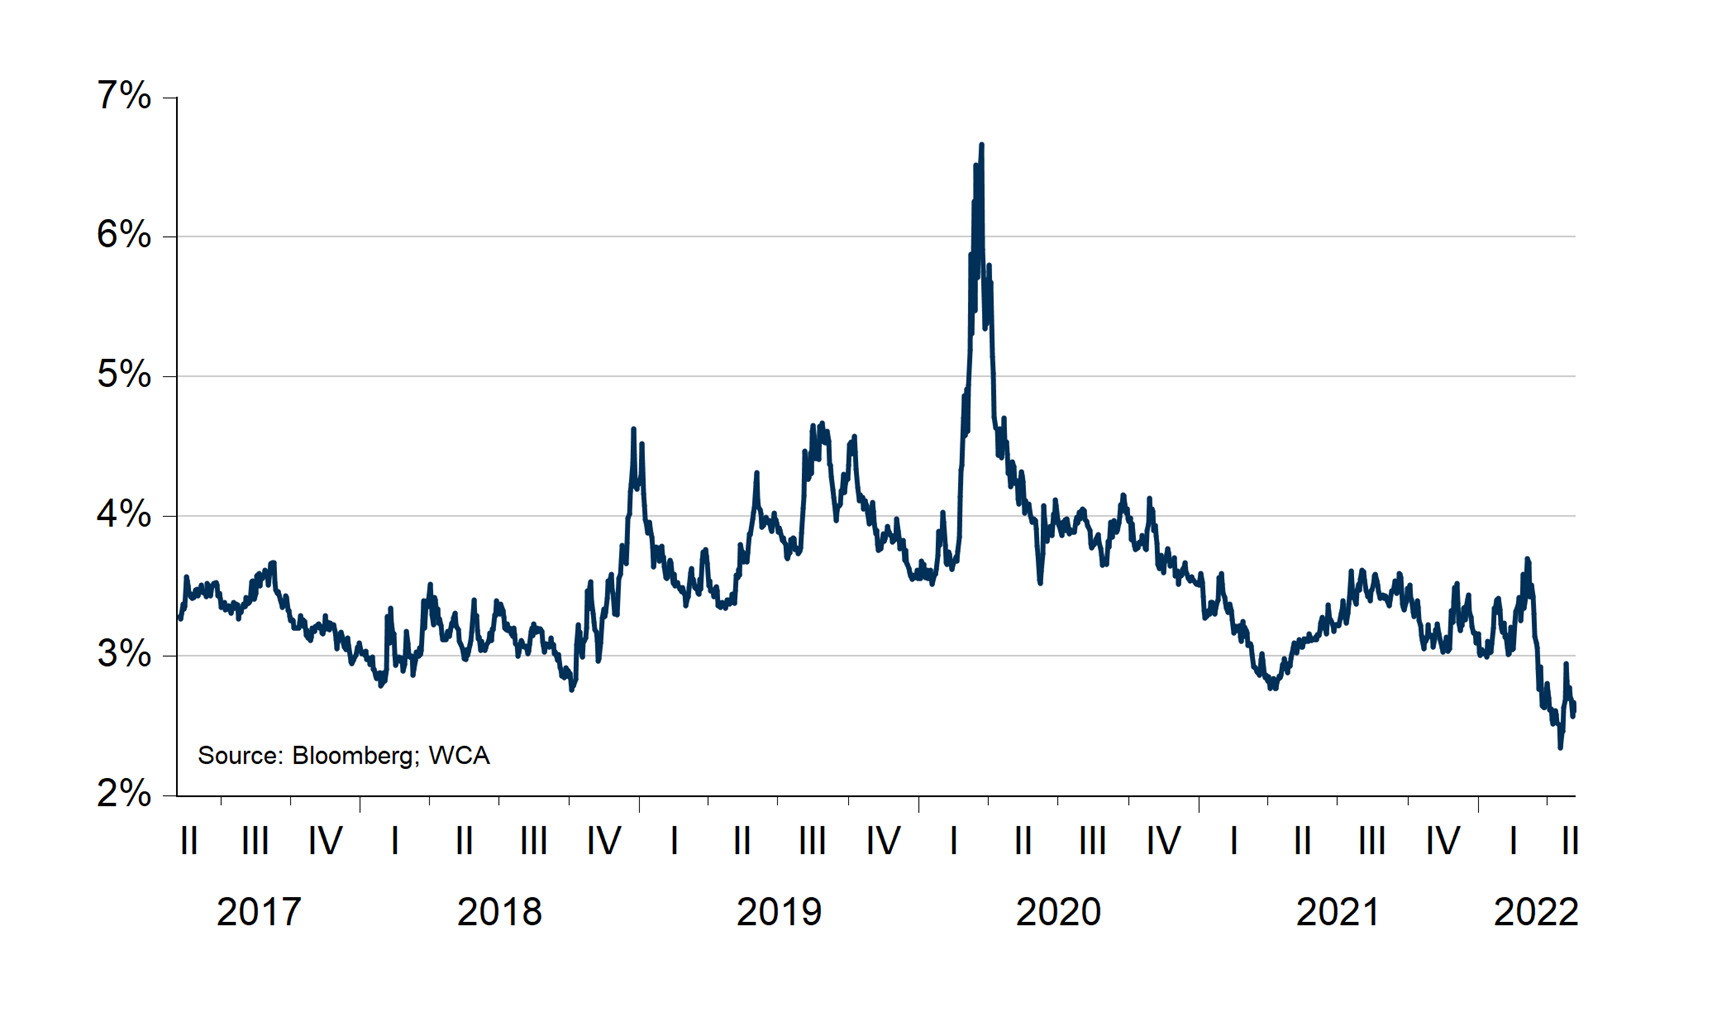
It should also be pointed out that earnings forecasts for the S&P 500 are still climbing, despite recent worries. Today, analysts expect $237 of operating earnings from the S&P 500 companies, a record that stands 33% above pre-pandemic levels. Moreover, the “earnings yield” is now 5.75%, roughly 2.6% above the 10-year U.S. Treasury yield. As you can see in Chart B (below), this is near the low end of the 5-year range and suggests room for a further move higher. Such a move could happen due to falling bond yields, rising earnings, falling stock prices, or a mix of all four factors.
Chart B
S&P 500 Earnings Yield Minus 10-Year U.S. Treasury Yield
As we wrote at the start of the year, and in our Q2 Tactical Asset Allocation quarterly, we believe a shorter duration posture makes sense. In our view, the ramp-up of inflation and response by central banks to contain it accelerated a much-needed adjustment to bond pricing. Beyond bonds, incoming data presents a mixed bag, especially compared with months ago. Chart C below shows the forecast path for the WCA “Barometer,” (chart, below) which measures a variety of market-based and other inputs to our outlook. As you can see, the expected short-term path for the barometer is near 40, indicating some weakness.
Consequently, we reduced equity exposure at the start of the month to below neutral in the satellite portions of tactically-allocated portfolios (40% equity currently versus 50% last month and 70% a year ago). We will continue to monitor incoming data, update our forecasts at the start of each month, and make appropriate adjustments as warranted.
Chart C
WCA “Barometer”

WCA Fundamental Conditions Barometer:
We regularly assess changes in fundamental conditions to help guide near-term asset allocation decisions. The analysis incorporates approximately 30 forward-looking indicators in categories ranging from Credit and Capital Markets to U.S. Economic Conditions and Foreign Conditions. From each category of data, we create three diffusion-style sub-indices that measure the trends in the underlying data. Sustained improvement that is spread across a wide variety of observations will produce index readings above 50 (potentially favoring stocks), while readings below 50 would indicate potential deterioration (potentially favoring bonds). The WCA Fundamental Conditions Index combines the three underlying categories into a single summary measure. This measure can be thought of as a “barometer” for changes in fundamental conditions.
Disclosures:
WCA Barometer – We regularly assess changes in fundamental conditions to help guide near-term asset allocation decisions. Analysis incorporates approximately 30 forward-looking indicators in categories ranging from Credit and Capital Markets to U.S. Economic Conditions and Foreign Conditions. From each category of data, we create three diffusion-style sub-indices that measure the trends in the underlying data. Sustained improvement that is spread across a wide variety of observations will produce index readings above 50 (potentially favoring stocks), while readings below 50 would indicate potential deterioration (potentially favoring bonds). The WCA Fundamental Conditions Index combines the three underlying categories into a single summary measure. This measure can be thought of as a “barometer” for changes in fundamental conditions.
Standard & Poor’s 500 Index (S&P 500) is a capitalization-weighted index that is generally considered representative of the U.S. large capitalization market.
S&P Global (SPGI) is a leading American provider of financial information, analytics, and credit ratings, headquartered in New York, NY. It operates major divisions including S&P Global Ratings, S&P Global Market Intelligence, S&P Global Commodity Insights, S&P Global Mobility, and S&P Dow Jones Indices.
The ICE BofA U.S. High Yield Index is an unmanaged index that tracks the performance of U.S. dollar denominated, below investment-grade rated corporate debt publicly issued in the U.S. domestic market.
The S&P 500 Growth measures constituents from the S&P 500 that are classified as growth stocks based on three factors: sales growth, the ratio of earnings change to price, and momentum.
The S&P 500 Value Index measures constituents from the S&P 500 that are classified as value stocks based on three factors: the ratios of book value, earnings and sales to price.
The S&P 500 Equal Weight Index is the equal-weight version of the widely regarded Standard & Poor’s 500 Index, which is generally considered representative of the U.S. large capitalization market. The index has the same constituents as the capitalization-weighted S&P 500, but each company in the index is allocated a fixed weight of 0.20% at each quarterly rebalancing.
The WCA Rising Dividend Custom Benchmark is a rules-based benchmark constructed by Washington Crossing Advisors to represent a universe of large capitalization U.S. companies that meet certain quality and dividend growth criteria, including proprietary screens for profitability, earnings consistency, and balance sheet strength, along with minimum market capitalization and dividend growth requirements. The benchmark is reconstituted and rebalanced quarterly and is intended to serve as a style-appropriate benchmark for the WCA Rising Dividend strategy.
The Washington Crossing Advisors’ High Quality Index and Low Quality Index are objective, quantitative measures designed to identify quality in the top 1,000 U.S. companies. Ranked by fundamental factors, WCA grades companies from “A” (top quintile) to “F” (bottom quintile). Factors include debt relative to equity, asset profitability, and consistency in performance. Companies with lower debt, higher profitability, and greater consistency earn higher grades. These indices are reconstituted annually and rebalanced daily. For informational purposes only, and WCA Quality Grade indices do not reflect the performance of any WCA investment strategy.
The risk of loss in trading commodities and futures can be substantial. You should therefore carefully consider whether such trading is suitable for you in light of your financial condition. The high degree of leverage that is often obtainable in commodity trading can work against you as well as for you. The use of leverage can lead to large losses as well as gains.
The information contained herein has been prepared from sources believed to be reliable but is not guaranteed by us and is not a complete summary or statement of all available data, nor is it considered an offer to buy or sell any securities referred to herein. Opinions expressed are subject to change without notice and do not take into account the particular investment objectives, financial situation, or needs of individual investors. There is no guarantee that the figures or opinions forecast in this report will be realized or achieved. Employees of Stifel, Nicolaus & Company, Incorporated or its affiliates may, at times, release written or oral commentary, technical analysis, or trading strategies that differ from the opinions expressed within. Past performance is no guarantee of future results. Indices are unmanaged, and you cannot invest directly in an index.
Asset allocation and diversification do not ensure a profit and may not protect against loss. There are special considerations associated with international investing, including the risk of currency fluctuations and political and economic events. Changes in market conditions or a company’s financial condition may impact a company’s ability to continue to pay dividends, and companies may also choose to discontinue dividend payments. Investing in emerging markets may involve greater risk and volatility than investing in more developed countries. Due to their narrow focus, sector-based investments typically exhibit greater volatility. Small-company stocks are typically more volatile and carry additional risks since smaller companies generally are not as well established as larger companies. Property values can fall due to environmental, economic, or other reasons, and changes in interest rates can negatively impact the performance of real estate companies. When investing in bonds, it is important to note that as interest rates rise, bond prices will fall. High-yield bonds have greater credit risk than higher-quality bonds. Bond laddering does not assure a profit or protect against loss in a declining market. The risk of loss in trading commodities and futures can be substantial. You should therefore carefully consider whether such trading is suitable for you in light of your financial condition. The high degree of leverage that is often obtainable in commodity trading can work against you as well as for you. The use of leverage can lead to large losses as well as gains. Changes in market conditions or a company’s financial condition may impact a company’s ability to continue to pay dividends, and companies may also choose to discontinue dividend payments.
All investments involve risk, including loss of principal, and there is no guarantee that investment objectives will be met. It is important to review your investment objectives, risk tolerance, and liquidity needs before choosing an investment style or manager. Equity investments are subject generally to market, market sector, market liquidity, issuer, and investment style risks, among other factors to varying degrees. Fixed Income investments are subject to market, market liquidity, issuer, investment style, interest rate, credit quality, and call risks, among other factors to varying degrees.
Beta is a measure of the volatility, or systematic risk, of a security or a portfolio relative to the market as a whole. A beta of one is considered as risky as the benchmark and is therefore likely to provide expected returns approximate to those of the benchmark during both up and down periods. A portfolio with a beta of two would move approximately twice as much as the benchmark.
Standard deviation is a measure of the volatility of a security’s or portfolio’s returns in relation to the mean return. The larger the standard deviation, the greater the volatility of return in relation to the mean return.
Changes in market conditions or a company’s financial condition may impact a company’s ability to continue to pay dividends, and companies may also choose to discontinue dividend payments
This commentary often expresses opinions about the direction of market, investment sector, and other trends. The opinions should not be considered predictions of future results. The information contained in this report is based on sources believed to be reliable, but is not guaranteed and not necessarily complete.
The securities discussed in this material were selected due to recent changes in the strategies. This selection criterion is not based on any measurement of performance of the underlying security.
Washington Crossing Advisors, LLC is a wholly-owned subsidiary and affiliated SEC Registered Investment Adviser of Stifel Financial Corp (NYSE: SF). Registration with the SEC implies no level of sophistication in investment management.


