Qualityland

At Washington Crossing Advisors (WCA), we go to great lengths describing the high quality businesses selected in our Rising Dividend and Victory equity portfolios. We believe in buying quality companies at reasonable prices that have low debt, predictable cash flows, and are highly profitable and reinvesting back into their business. This follows an intuitive, common sense approach to investing, particularly when considering risk-adjusted return in a strategy. That said, quality investing often becomes convoluted and misunderstood by investors – mainly due to antiquated frameworks put into practice decades ago that have unintentionally become foundational to investing and financial planning.
In the early 1990s, famed economists Eugene Fama and Kenneth French developed their Three-Factor Model1 to explain investment returns in excess of market performance. One such factor was the outperformance of companies with the equivalent of low price-to-book ratios vs high price-to-book ratios. Fama and French described companies with low ratios as value stocks – that is, companies with low market prices relative to their intrinsic (book) values. On the other side of this continuum, growth stocks represented those companies that had high price-to-book ratios. The appeal and willingness to pay more for growth stocks lies in the belief that those companies will grow significant cash flows over a longer time horizon than cheap value stocks. Chart A below depicts the very familiar Value-Growth Continuum utilized by virtually every financial professional when making investing decisions.
Chart A
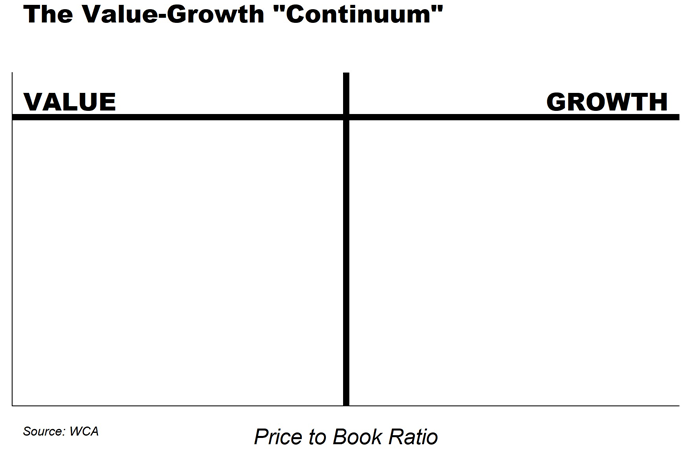
Whether in academic or professional settings, sometimes it makes sense to step back and “sanity check” ones work. When doing so, in the case above, we believe investors are presented with a simple logical fallacy. Along a continuum or spectrum, we are presented with things that are complete opposites of each other – hot and cold, tall and short, fast and slow, etc. However, in the continuum example above, the opposite of value is not growth and vice versa. At the most basic level, the value and growth style spectrum, with trillions of investment dollars predicated on it, does not make sense.
Where’s the Risk?
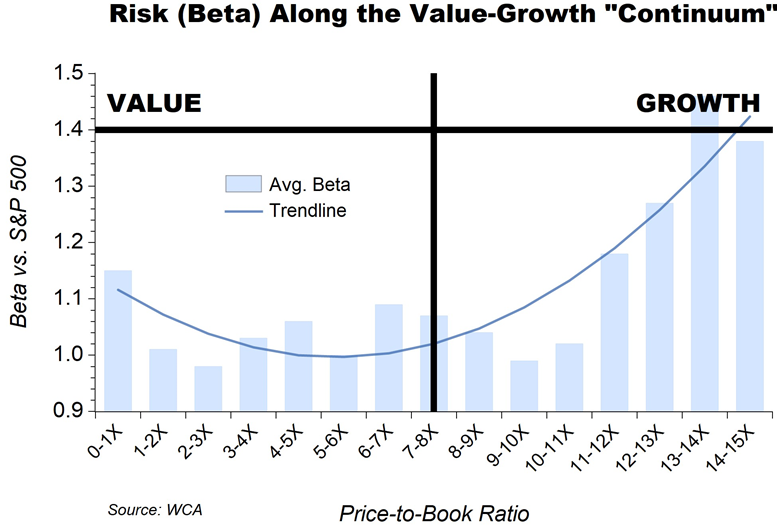
There are other reasons to be skeptical about investing according to Value and Growth style. Risk, for example, is commonly misrepresented or completely unaccounted for using this framework. Chart B breaks down Risk (Beta) for stocks across Value-Growth by specific price-to-book ratios. Not surprisingly, expensive growth stocks present the most risk. Investors must understand the risk they assume when buying a growth stock and taking a bet on future performance. Most importantly, note the increase in risk that comes with deep value stocks. A well-intentioned investor may mistakenly believe that they are buying a less risky asset because it is a cheap value stock. Indeed, risk pervades on both sides of the Value-Growth Continuum.
Chart B
Value and Yield
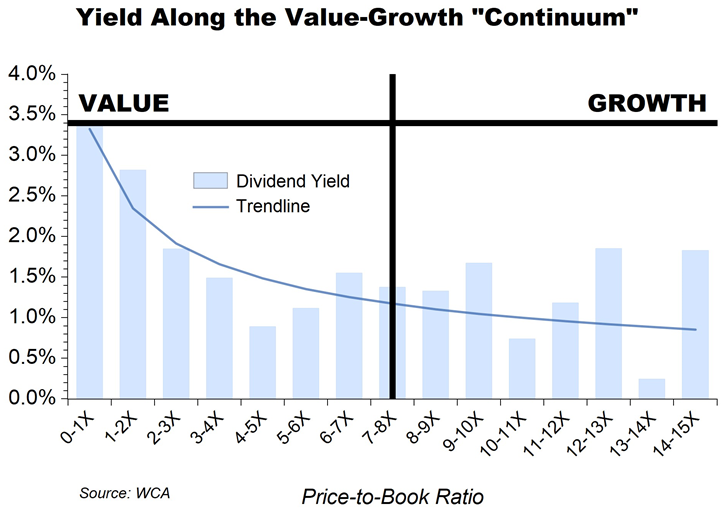
In addition to assessing risk, investors and financial professionals oftentimes look for yield when constructing portfolios for retirement and other liquidity needs. In Chart C, we can see how Value stocks with the lowest price-to-book ratios often offer the highest yields. Before claiming victory and assembling a Value portfolio of high yielding stocks, one mustn’t forget about the aforementioned risk! The concept of a Value Trap is most prevalent in these situations, when risky companies, often saddled with heavy debt burdens and unstable businesses, try to lure investors by offering high yields.
Chart C
Conclusion
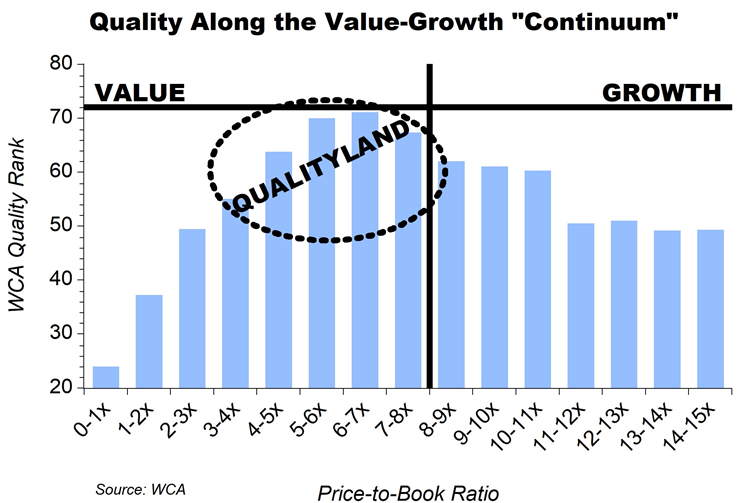
For these reasons, WCA differentiates by investing our portfolios with high quality companies independent of prescriptive industry frameworks. Quality rankings are assigned to companies based on debt, business and stock consistency, and profitability. While our portfolios are constructed based on quality and not style, we understand that visualizing where the strategies fit in the Value-Growth Continuum is meaningful for investors. Chart D illustrates “Qualityland,” the area within Value-Growth where Washington Crossing Advisors focus list of high quality companies resides. It should come as no surprise that this same region generally provides the lowest Beta, previously described. Although the industry applies Fama’s macro factor model today, Qualityland is where WCA will continue to search for companies while managing our equity portfolios.
Chart D
1Corporate Finance Institute: Fama-French Three-Factor Model


