Putting Quality to the Test
We believe a link exists between a business and its stock price. This is why we spend time thinking about businesses when building portfolios. If there was not a link it would be useless to spend time doing fundamental research. Considering the past five years’ volatile market environment, we thought now would be a good time to see if fundamentals, especially relating to quality, translated into differences in stock price performance.
The Test (2018-2022)
We set the stage by studying businesses and price performance from 2018-2022. From the onset, we gathered fundamental data on large U.S. companies by market value. We looked at asset profitability, profit consistency, and level of indebtedness. For profitability, we measured return on assets to understand how productive those assets are. For consistency, we examined the steadiness of profitability through good and bad times. For indebtedness, we looked at how much of a company’s total value is owed to creditors. With these three factors combined companies are then given a “quality” score based on fundamentals.
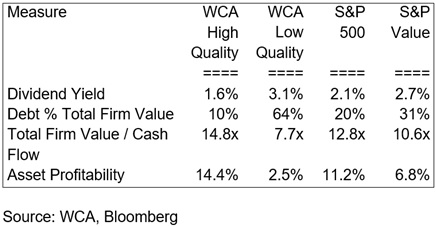
We then created “high quality” and “low quality” groups based on then-available 2018 data. The top 20% of companies with better profitability, consistency, and lower debt became the “high quality” group. The bottom 20% became the “low quality” group. With groups established, we looked at how each group differed based on key fundamental metrics. For example, higher quality companies tend to carry higher valuations than lower quality companies, as one might expect. The starting dividend yield of the “high quality” group is 1.6% compared with the 3.1% yield of “low quality.” Here is a table that shows several of the more important fundamental characteristics of each group:
Table A: Fundamental Characteristics by Group
Performance Differences
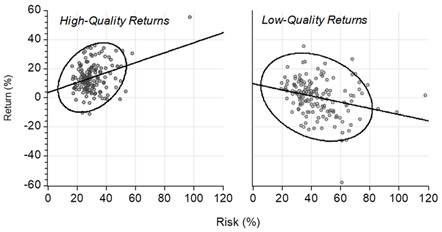
It is not the dividend yield that matters most to us. We are interested in seeing any difference in the risk / return tradeoff between the two groups. Chart A below shows this tradeoff between the “high-quality” and “low-quality” groups side by side. The chart reveals three interesting observations:
- On average, higher-quality companies generated higher returns with less risk overall. The cluster of high-quality is located higher and more to the left than low quality. This is good and means that, on average, high-quality stocks generated higher risk adjusted returns compared with low-quality stocks in 2018-2022.
- The higher quality companies produced more predictable results. We see this by noticing that there is a tighter ring around the returns of “high quality” returns than the “low quality” returns.
- Returns among the high-quality stocks tended to rise with increases in risk. However, returns for low-quality stocks tended to decline with greater risk. Note that the straight lines (regression lines) slope up for high quality and down for low quality. An upward sloping line is good and means that return rises with risk, and vice versa.
The last point above is significant because risk is assumed to be rewarded with higher return, but that is not what happened with low quality companies. Increased risk among low quality names was not generally rewarded with higher return. The fact that higher quality tended to generate greater returns as risk rose is a distinct positive, demonstrating a solid risk / return tradeoff during a period of extreme volatility.
Chart A: Performance of High vs. Low Quality (2018-2022)
Conclusion
We see an imperfect but real relationship between fundamentals and stock price performance. Markets seem rational, after all, and tend to discern differences between companies based on quality. Higher-quality companies tend to trade at a premium compared with lower-quality, as expected. Most importantly, high quality behaved consistent with what might be predicted under portfolio theory, namely that risk and reward would exhibit a positive relationship.
The results of this small study shows why quality should be an essential organizing idea when building portfolios. The 2018-2022 environment saw restrictive and expansionary policy, economic expansion and contraction, and high and low inflation. Thus, this period helps evaluate how fundamentals, quality, and performance interact under stress. In our judgement, quality passed the test as markets were able to discern between high and low quality companies as evidenced by stock price performance.