Of Bulls and Bears
Apart from a short downturn early in the pandemic, the stock market has enjoyed a great bull run since 2010. Yet, from January 3 through May 20, the stock market fell about 18.5% before rallying 5% off the recent bottom. Despite the recent rally keeping the market out of “bear market” territory, we should not let down our guard because growth is still slowing. A lapse into outright recession would complicate the bull case for stocks through year-end.
Rally on Good News
From May 20 through today, the stock market has been performing better. The total value of U.S. stocks has been up about $2 trillion to $44.5 trillion in the past couple of weeks. Moreover, there is some good news to report. In no particular order,
- Monthly employment rose 390,000 in May as the unemployment rate remained at a record low of 3.6%, based on last week’s report from the U.S. Labor Department.
- Analyst S&P 500 earnings forecasts are 20% higher than year-ago levels, according to Bloomberg estimates.
- Defaults among the riskiest corporate issuers are near a record low of 1.9% on a trailing 12-month basis, according to Moody’s Investor Service.
If these trends persist, the caution expressed in this commentary is likely to be unwarranted. However, we believe there is not yet enough evidence to support a more bullish near-term case.
A “Bag of Worries”
We see challenges and trends in data pointing toward a slowdown. The Federal Reserve Bank of Atlanta now forecasts just 1.1% growth in the U.S. economy this quarter, following a 1.5% contraction in the first quarter. Several factors are contributing to the current “bag of worries.”
- Inflation is hitting consumers harder than expected. A year ago, the bond market was pricing inflation expectations near 3.4%, but consumer prices are actually up over 8%.
- The Russia-Ukraine war roiled the global economy and markets this year, and the ultimate cost of the war remains unknowable at this point.
- Fiscal supports put in place during the pandemic are being unwound. These supports provided a significant source of income for the economy. In the February-April period, transfer payments to individuals (think enhanced unemployment benefits and child tax credits) were 30% lower than a year earlier. About $2 trillion of annual payments, about $5,000 per American per year, are disappearing versus a year earlier.
- The Federal Reserve (Fed) raised interest rates twice this year and expects further increases. Policy rates are now near 1%, and markets expect those rates to move to about 3% in a year. Also, the Fed’s balance sheet shrunk in May (-$25 billion) for the first time since August 2020. Higher rates and balance sheet unwinding are potential near-term risks for markets. Central bank liquidity to support markets is also starting to fade.
- Interest rates on consumers are surging. Interest costs on borrowing are also moving up. A 30-year mortgage costs nearly 5.5% today versus 3% in 2020-2021. And signs exist that higher rates are starting to pinch. The annualized rate of new home sales, for example, fell 27% from a year ago to 491,000 in April from a year earlier, partly reflecting higher mortgage costs.
The recent market rally may have staved off a “bear market.” Still, the jury remains out on how markets and the economy will adapt to these challenges. We do not yet have enough evidence to provide comfort that we are out of the woods yet on these issues. In our judgment, some near-term caution remains the best course of action.
Lessons from History
We should not let down our guard because we simply do not yet know how the economy will adapt to the above challenges. We see three potential paths forward:
- We could experience a “soft landing” where policymakers guide the economy “just right” to lower inflation while allowing continued growth.
- We could experience a recession measured as negative growth for more than a single quarter.
- Inflation could continue to run away from the Federal Reserve, requiring ever more dramatic efforts to try and stabilize prices.
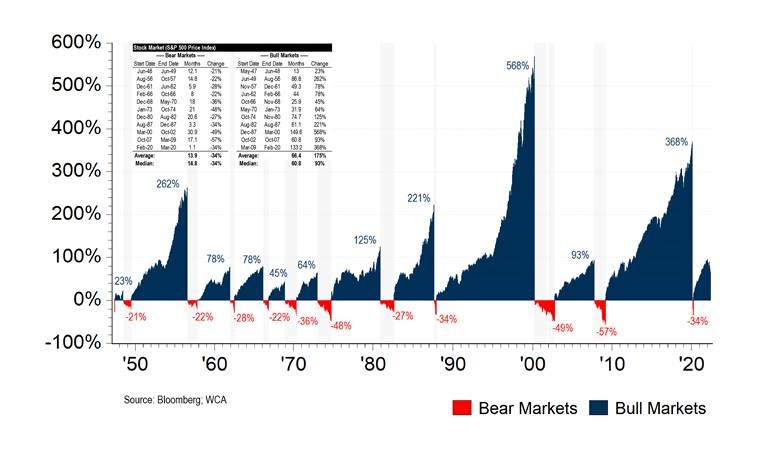
None of this is new, of course, and investors have lived through bull and bear markets as long as financial markets have existed. In time, stocks have handily beat out bonds and cash, but periodic “bear markets” surfaced. As the chart below shows, “bull markets” (rising stock prices) have been much more significant and longer-lasting in comparison with “bear markets” (falling prices).
In many cases, a “bear market” (-20% decline) is nearly over by the time the -20% bear market threshold is breached. However, when bear markets are accompanied by a recession, the falloff tends to be deeper, with further downside. Note that 1973, 2000, and 2008 “bear market” drops were 48%, 49%, and 57%, respectively. These were “recessionary bear markets,” and the declines were steep as economic woes fed back into falling stock values. Like those in the 1950s and 1960s or the 2020 pandemic bear market, milder bear markets were short and shallow. In these cases, continued growth and/or government support played a major role in lessening the pain.
Bull and Bear Markets (Since 1946)
So, as you can see, it is essential to consider how the economic backdrop is changing along with the market sentiment. So far, we have seen some weakening of fundamental conditions, as evidenced by the below chart titled WCA “Barometer.” The most recent update of the “Barometer”, which measured broad changes in an array of market and economic indicators we find essential, points to near-term weakness. Accordingly, equity exposure in tactical portfolios has been trimmed (again) as we continue to look for signs of improvement.

A more aggressive portfolio posture would require more positive data since a bullish argument is more convincing when supported by facts and evidence. Unfortunately, we do not have enough positive signs today. And while things could evolve more positively over time, we are holding some “dry powder” for now.
Conclusion
So, while we are happy to see the market’s recent rally, there is still not enough evidence, in our view, to throw caution to the wind. First, we still see soft data and slowing growth, but weakness has not yet been evidenced in earnings forecasts, defaults, or market prices. If broader economic weakness does spread to these areas, a bull case for stocks will be more challenging to make (at least for a while).
We will continue to track the data and focus on high-quality stocks and bonds. Or, in tactical portfolios, we will tilt away from stocks toward bonds or cash, as appropriate. After years of bull market gains, keeping a quality and tactical perspective is essential. This perspective becomes even more critical when bear markets threaten to arise.
WCA Fundamental Conditions Barometer:
We regularly assess changes in fundamental conditions to help guide near-term asset allocation decisions. The analysis incorporates approximately 30 forward-looking indicators in categories ranging from Credit and Capital Markets to U.S. Economic Conditions and Foreign Conditions. From each category of data, we create three diffusion-style sub-indices that measure the trends in the underlying data. Sustained improvement that is spread across a wide variety of observations will produce index readings above 50 (potentially favoring stocks), while readings below 50 would indicate potential deterioration (potentially favoring bonds). The WCA Fundamental Conditions Index combines the three underlying categories into a single summary measure. This measure can be thought of as a “barometer” for changes in fundamental conditions.
Disclosures:
WCA Barometer – We regularly assess changes in fundamental conditions to help guide near-term asset allocation decisions. Analysis incorporates approximately 30 forward-looking indicators in categories ranging from Credit and Capital Markets to U.S. Economic Conditions and Foreign Conditions. From each category of data, we create three diffusion-style sub-indices that measure the trends in the underlying data. Sustained improvement that is spread across a wide variety of observations will produce index readings above 50 (potentially favoring stocks), while readings below 50 would indicate potential deterioration (potentially favoring bonds). The WCA Fundamental Conditions Index combines the three underlying categories into a single summary measure. This measure can be thought of as a “barometer” for changes in fundamental conditions.
Standard & Poor’s 500 Index (S&P 500) is a capitalization-weighted index that is generally considered representative of the U.S. large capitalization market.
S&P Global (SPGI) is a leading American provider of financial information, analytics, and credit ratings, headquartered in New York, NY. It operates major divisions including S&P Global Ratings, S&P Global Market Intelligence, S&P Global Commodity Insights, S&P Global Mobility, and S&P Dow Jones Indices.
The ICE BofA U.S. High Yield Index is an unmanaged index that tracks the performance of U.S. dollar denominated, below investment-grade rated corporate debt publicly issued in the U.S. domestic market.
The S&P 500 Growth measures constituents from the S&P 500 that are classified as growth stocks based on three factors: sales growth, the ratio of earnings change to price, and momentum.
The S&P 500 Value Index measures constituents from the S&P 500 that are classified as value stocks based on three factors: the ratios of book value, earnings and sales to price.
The S&P 500 Equal Weight Index is the equal-weight version of the widely regarded Standard & Poor’s 500 Index, which is generally considered representative of the U.S. large capitalization market. The index has the same constituents as the capitalization-weighted S&P 500, but each company in the index is allocated a fixed weight of 0.20% at each quarterly rebalancing.
The WCA Rising Dividend Custom Benchmark is a rules-based benchmark constructed by Washington Crossing Advisors to represent a universe of large capitalization U.S. companies that meet certain quality and dividend growth criteria, including proprietary screens for profitability, earnings consistency, and balance sheet strength, along with minimum market capitalization and dividend growth requirements. The benchmark is reconstituted and rebalanced quarterly and is intended to serve as a style-appropriate benchmark for the WCA Rising Dividend strategy.
The Washington Crossing Advisors’ High Quality Index and Low Quality Index are objective, quantitative measures designed to identify quality in the top 1,000 U.S. companies. Ranked by fundamental factors, WCA grades companies from “A” (top quintile) to “F” (bottom quintile). Factors include debt relative to equity, asset profitability, and consistency in performance. Companies with lower debt, higher profitability, and greater consistency earn higher grades. These indices are reconstituted annually and rebalanced daily. For informational purposes only, and WCA Quality Grade indices do not reflect the performance of any WCA investment strategy.
The risk of loss in trading commodities and futures can be substantial. You should therefore carefully consider whether such trading is suitable for you in light of your financial condition. The high degree of leverage that is often obtainable in commodity trading can work against you as well as for you. The use of leverage can lead to large losses as well as gains.
The information contained herein has been prepared from sources believed to be reliable but is not guaranteed by us and is not a complete summary or statement of all available data, nor is it considered an offer to buy or sell any securities referred to herein. Opinions expressed are subject to change without notice and do not take into account the particular investment objectives, financial situation, or needs of individual investors. There is no guarantee that the figures or opinions forecast in this report will be realized or achieved. Employees of Stifel, Nicolaus & Company, Incorporated or its affiliates may, at times, release written or oral commentary, technical analysis, or trading strategies that differ from the opinions expressed within. Past performance is no guarantee of future results. Indices are unmanaged, and you cannot invest directly in an index.
Asset allocation and diversification do not ensure a profit and may not protect against loss. There are special considerations associated with international investing, including the risk of currency fluctuations and political and economic events. Changes in market conditions or a company’s financial condition may impact a company’s ability to continue to pay dividends, and companies may also choose to discontinue dividend payments. Investing in emerging markets may involve greater risk and volatility than investing in more developed countries. Due to their narrow focus, sector-based investments typically exhibit greater volatility. Small-company stocks are typically more volatile and carry additional risks since smaller companies generally are not as well established as larger companies. Property values can fall due to environmental, economic, or other reasons, and changes in interest rates can negatively impact the performance of real estate companies. When investing in bonds, it is important to note that as interest rates rise, bond prices will fall. High-yield bonds have greater credit risk than higher-quality bonds. Bond laddering does not assure a profit or protect against loss in a declining market. The risk of loss in trading commodities and futures can be substantial. You should therefore carefully consider whether such trading is suitable for you in light of your financial condition. The high degree of leverage that is often obtainable in commodity trading can work against you as well as for you. The use of leverage can lead to large losses as well as gains. Changes in market conditions or a company’s financial condition may impact a company’s ability to continue to pay dividends, and companies may also choose to discontinue dividend payments.
All investments involve risk, including loss of principal, and there is no guarantee that investment objectives will be met. It is important to review your investment objectives, risk tolerance, and liquidity needs before choosing an investment style or manager. Equity investments are subject generally to market, market sector, market liquidity, issuer, and investment style risks, among other factors to varying degrees. Fixed Income investments are subject to market, market liquidity, issuer, investment style, interest rate, credit quality, and call risks, among other factors to varying degrees.
Beta is a measure of the volatility, or systematic risk, of a security or a portfolio relative to the market as a whole. A beta of one is considered as risky as the benchmark and is therefore likely to provide expected returns approximate to those of the benchmark during both up and down periods. A portfolio with a beta of two would move approximately twice as much as the benchmark.
Standard deviation is a measure of the volatility of a security’s or portfolio’s returns in relation to the mean return. The larger the standard deviation, the greater the volatility of return in relation to the mean return.
Changes in market conditions or a company’s financial condition may impact a company’s ability to continue to pay dividends, and companies may also choose to discontinue dividend payments
This commentary often expresses opinions about the direction of market, investment sector, and other trends. The opinions should not be considered predictions of future results. The information contained in this report is based on sources believed to be reliable, but is not guaranteed and not necessarily complete.
The securities discussed in this material were selected due to recent changes in the strategies. This selection criterion is not based on any measurement of performance of the underlying security.
Washington Crossing Advisors, LLC is a wholly-owned subsidiary and affiliated SEC Registered Investment Adviser of Stifel Financial Corp (NYSE: SF). Registration with the SEC implies no level of sophistication in investment management.


