Monday Morning Minute 102416
THE WEEK AHEAD
Active week for earnings as 178 of S&P 500 companies are scheduled to report. As per FactSet, Q3 2016 blended year-over-year earnings are expected to decline 0.3%. The blended sales growth rate for Q3 2016 is 2.6%. The forward P/E multiple is now 16.5x, which is above the 10-year average of 14.3x. Friday’s advance release of Q3 2016 GDP should attract attention in addition to the five members of the Federal Reserve scheduled to speak today and Tuesday.
S&P ESTIMATES and VALUATION
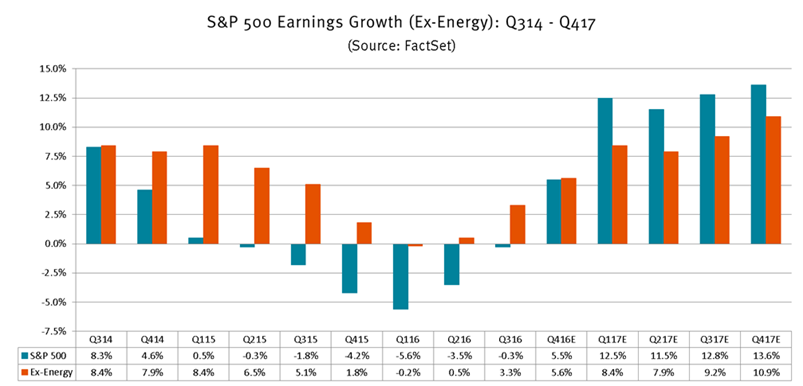
Equity investors should focus on earnings as the long-term driver for return. For calendar year 2016, analysts are projecting earnings growth of 0.1% and revenue growth of 2.2%. As of today, the consensus estimate for 2017 S&P 500 earnings is $132.30 (growth 12.4%) and the revenue growth estimate is 6.0%. This improvement in earnings and revenue coincides with the bounce in oil. According to FactSet, if the energy sector is excluded from Q3 results, the earnings growth rate for the S&P would improve to 3.3% from -0.3% (Chart 1 below).
Chart 1
Valuation should not be ignored. The forward S&P 500 P/E ratio is 16.5x, which sits above both the 10-year average of 14.3x and the 5-year average of 14.9x. Earnings before interest and tax (EBIT) margins will have to improve significantly in order to achieve the 2017 S&P 500 consensus earnings estimate of $132.30. We continue to recommend U.S. equities (long-term forecasted return approximately 6%). This week we have included additional valuation metrics for a broader perspective (Chart 2 below).
Chart 2
| S&P 500 | |||||||||||||||||||||||||||
| Valuation | |||||||||||||||||||||||||||
| 2018 Expected | 2017 Expected | 2016 Expected | 2015 | 2014 | 2013 | 2012 | 2011 | 2010 | 2009 | ||||||||||||||||||
| EBIT Margin (%) | 17.38 | 16.39 | 15.43 | 14.89 | 15.26 | 15.45 | 15.38 | 14.51 | 14.47 | 12.84 | |||||||||||||||||
| Return on Equity (ROE) (%) | 16.26 | 16.17 | 15.28 | 16.01 | 16.11 | 15.74 | 15.90 | 15.79 | 14.57 | 11.90 | |||||||||||||||||
| Price/Earnings (x) | 14.66 | 16.18 | 18.24 | 16.61 | 18.04 | 17.00 | 14.57 | 14.01 | 15.69 | 18.18 | |||||||||||||||||
| PEG Ratio (x) | 1.37 | 1.51 | 1.70 | 1.64 | 1.67 | 1.44 | 1.36 | 1.24 | 1.50 | 1.77 | |||||||||||||||||
| Price/Sales (x) | 1.67 | 1.75 | 1.85 | 1.70 | 1.80 | 1.63 | 1.36 | 1.26 | 1.39 | 1.27 | |||||||||||||||||
| Price/Free Cash Flow (x) | 16.46 | 17.98 | 21.82 | 19.72 | 22.67 | 20.78 | 18.75 | 16.68 | 16.94 | 17.98 | |||||||||||||||||
| Price/Book Value (x) | 2.38 | 2.62 | 2.79 | 2.66 | 2.91 | 2.67 | 2.31 | 2.21 | 2.28 | 2.16 | |||||||||||||||||
| Enterprise Value/EBIT (x) | 12.38 | 13.63 | 15.48 | 15.02 | 14.27 | 12.95 | 11.25 | 10.43 | 11.26 | 12.28 | |||||||||||||||||
| Enterprise Value/Sales (x) | 2.01 | 2.11 | 2.24 | 2.07 | 2.06 | 1.87 | 1.61 | 1.51 | 1.63 | 1.56 | |||||||||||||||||
| Payout Ratio (%) | 34.90 | 35.59 | 38.33 | 37.18 | 33.32 | 32.07 | 29.45 | 26.96 | 26.78 | 36.56 | |||||||||||||||||
| Dividend Yield (%) | 2.39 | 2.20 | 2.10 | 2.24 | 1.85 | 1.91 | 2.05 | 1.95 | 1.72 | 2.03 | |||||||||||||||||
| Source: FactSet | |||||||||||||||||||||||||||
ECONOMIC RELEASES THIS WEEK
| Date | Report | Period | Survey | Prior |
| Monday, October 24: | PMI Manufacturing Index Flash | October | 51.2 | 51.4 |
| Tuesday, October 25: | S&P Case-Shiller HPI 20 City SA M/M | August | 0.2% | 0.0% |
| S&P Case-Shiller HPI 20 City NSA M/M | August | 5.1% | 0.6% | |
| S&P Case-Shiller HPI 20 City NSA Y/Y | August | — | 5.0% | |
| Consumer Confidence | October | 101.0 | 104.1 | |
| Wednesday, October 26: | International Trade Balance | September | -$60.5 B | -$58.4 B |
| New Home Sales | September | 601 K | 609 K | |
| Thursday, October 27: | Weekly Jobless Claims | October 22 | 255 K | 260 K |
| Durable Goods New Orders M/M | September | 0.2% | 0.0% | |
| Durable Goods New Orders Y/Y | September | — | -1.3% | |
| Durable Goods Ex Transportation M/M | September | 0.1% | -0.4% | |
| Durable Goods Ex Transportation Y/Y | September | — | -1.1% | |
| Core Capital Goods M/M | September | — | 0.6% | |
| Core Capital Goods Y/Y | September | — | -3.1% | |
| Pending Home Sales | September | 1.0% | -2.4% | |
| Friday, October 28: | Real GDP Q/Q | Q3 2016 | 2.5% | 1.4% |
| Employment Cost Index Q/Q | Q3 2016 | 0.6% | 0.6% | |
| Employment Cost Index Y/Y | Q3 2016 | — | 2.3% | |
| Consumer Sentiment | October | 88.5 | 87.9 |
ASSET ALLOCATION PORTFOLIO POSTURE
LONG-RUN STRATEGIC POSTURE: Our long-run forecasts lead us to be overweight in large cap domestic growth stocks, high-yield corporate bonds, and gold in the diversified “core” of portfolios. Underweight positions in “core” are long-term U.S. Treasuries, foreign developed equities, and REITs. The equity allocation in the short-term tactical “satellite” portion of portfolios currently stands at 60% equity / 40% fixed income.
The information contained herein has been prepared from sources believed to be reliable but is not guaranteed by us and is not a complete summary or statement of all available data, nor is it considered an offer to buy or sell any securities referred to herein. Opinions expressed are subject to change without notice and do not take into account the particular investment objectives, financial situation, or needs of individual investors. There is no guarantee that the figures or opinions forecasted in this report will be realized or achieved. Employees of Stifel, Nicolaus & Company, Incorporated or its affiliates may, at times, release written or oral commentary, technical analysis, or trading strategies that differ from the opinions expressed within. Past performance is no guarantee of future results. Indices are unmanaged, and you cannot invest directly in an index.
Asset allocation and diversification do not ensure a profit and may not protect against loss. There are special considerations associated with international investing, including the risk of currency fluctuations and political and economic events. Investing in emerging markets may involve greater risk and volatility than investing in more developed countries. Due to their narrow focus, sector-based investments typically exhibit greater volatility. Small company stocks are typically more volatile and carry additional risks, since smaller companies generally are not as well established as larger companies. Property values can fall due to environmental, economic, or other reasons, and changes in interest rates can negatively impact the performance of real estate companies. When investing in bonds, it is important to note that as interest rates rise, bond prices will fall. High-yield bonds have greater credit risk than higher quality bonds. The risk of loss in trading commodities and futures can be substantial. You should therefore carefully consider whether such trading is suitable for you in light of your financial condition. The high degree of leverage that is often obtainable in commodity trading can work against you as well as for you. The use of leverage can lead to large losses as well as gains.
The WCA Fundamental Conditions Barometer measures the breadth of changes to a wide variety of fundamental data. The barometer measures the proportion of indicators under review that are moving up or down together. A barometer reading above 50 generally indicates a more bullish environment for the economy and equities, and a lower reading implies the opposite. Quantifying changes this way helps us incorporate new facts into our near-term outlook in an objective and unbiased way. More information on the barometer is found in our latest quarterly report, available at www.washingtoncrossingadvisors.com/insights.html.
For client-approved reports and commentaries click here
Kevin Caron, Portfolio Manager
Chad Morganlander, Portfolio Manager
Matthew Battipaglia, Analyst
Suzanne Ashley, Junior Analyst
(973) 549-4052