Monday Morning Minute 092616
THE WEEK AHEAD
We look at credit, debt, and leverage given new data from the Federal Reserve (Fed). We conclude that private sector debt and leverage remain important contributors to both risk and growth. Elevated levels of private sector debt and leverage increase potential risks that should be addressed in portfolios as the cycle ages.
MACRO VIEW
Recent data from the Federal Reserve shows private sector debt remains elevated despite some household deleveraging. We continue to believe a relationship exists between private sector debt, the economic cycle, and equity market volatility, and that relationship is stronger today than years ago. The reason why additions to debt and leverage increase equity holder risk is plain. The more debt a company has, the higher the risk to the stockholder in the business. Debt creates a fixed cost, with interest, that increases exposure to market risk. Leverage amplifies changes in asset values, increasing volatility for equity holders.
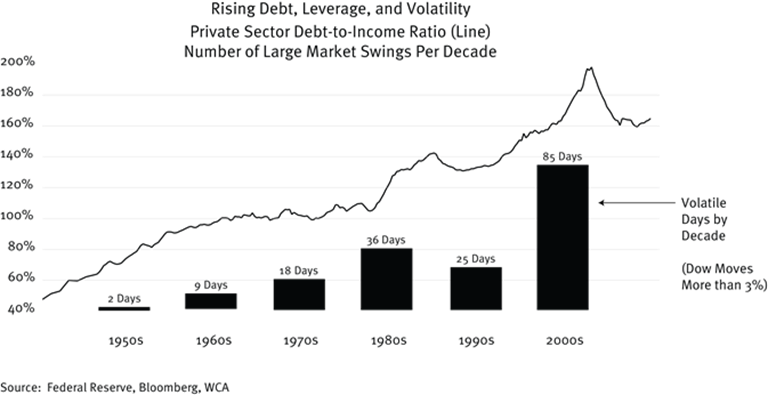
Chart A, below, is an attempt to show how private sector debt and leverage may have contributed to an increase in market volatility. From 1950 to 1980, the private sector (household plus business) debt-to-income ratio was less than 100%, and the number of volatile days in the market (swings of 3% or more) were just a handful. The debt-to-income ratio rose sharply through the 1980s and so, too, did the number of volatile trading days (36 days during the ‘80s). Through the 1990s, the private sector debt-income ratio moved lower, and equity market volatility declined. Volatile trading days declined to 25 during the 1990s. By the early 2000s, private sector debt-to-income levels were once again on the rise with the ratio reaching nearly 200%, and volatile trading days spiked to 85 from 2000 to 2010. Since then, volatility has subsided as the private sector debt-income ratio came down. These patterns clearly illustrate how private sector debt plays a significant role in contributing to equity market risk.
Chart A
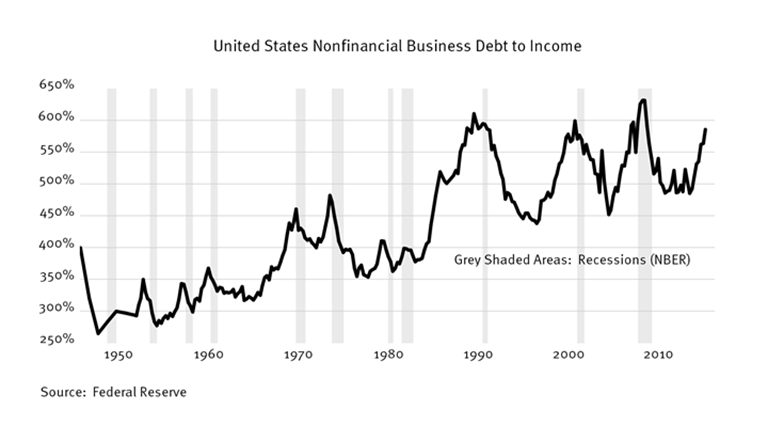
Focusing just on non-financial business debt, we see additional patterns of how debt influences the economic cycle. Here we compare non-financial business debt with after tax income and relate changes in this ratio to the economic cycle. Chart B below illustrates three important points. First, there seems to be a strong relationship between business borrowing and the business cycle. Second, business leverage tends to rise in the second half of expansions, which can help to extend the cycle but tends to raise risk later. Lastly, the current ratio of business debt-to-income is elevated, and rising toward prior peaks seen in 1990, 2000, and 2007.
Today, most data is consistent with an economy accelerating toward 3% annualized growth in the third quarter, but other signs exist we are moving into the later stages of expansion (narrowing output gap, less accommodative fiscal and monetary policy, narrowing term spread, etc.) Eventually, we expect to see another recession and want to be prepared with solid companies in the portfolio whenever that occurs. Therefore, we want to increase our focus now on balance sheet strength, cash flow consistency, earnings quality, dividend coverage, valuation, and diversification even if that means sacrificing some near-term return.
To reduce unwanted potential risk, we want to remain wary of companies carrying excess debt — especially as business sector debt-to-income ratios remain elevated and are again rising toward prior peak levels.
Chart B
ECONOMIC RELEASES THIS WEEK
| Date | Report | Period | Survey | Prior |
| Monday, September 26: | New Home Sales | August | 595K | 654K |
| New Home Sales M/M | August | -9.1% | 12.4% | |
| Dallas Fed Manf. Activity | September | -3.0 | -6.2 | |
| Tuesday, September 27: | S&P Case-Shiller HPI 20-city, SA – M/M | July | — | -0.1% |
| S&P Case-Shiller HPI 20-city, NSA – M/M | July | — | 0.8% | |
| S&P Case-Shiller HPI 20-city, NSA – Y/Y | July | — | 5.1% | |
| Consumer Confidence | September | 98.8 | 101.1 | |
| Wednesday, September 28: | Durable Goods New Orders – M/M | August | — | 4.4% |
| Durable Goods New Orders – Y/Y | August | — | -3.3% | |
| Durable Goods Ex-transportation – M/M | August | — | 1.5% | |
| Durable Goods Ex-transportation – Y/Y | August | — | -0.6% | |
| Core Capital Goods – M/M | August | — | 1.6% | |
| Core Capital Goods – Y/Y | August | — | -4.9% | |
| Thursday, September 29: | Weekly Jobless Claims | September 24 | — | 252K |
| GDP Annualized Q/Q | 2Q16 | 1.3% | 1.1% | |
| Core PCE Q/Q | 2Q16 | — | 1.8% | |
| Pending Home Sales M/M | August | -0.3% | 1.3% | |
| Pending Home Sales Y/Y | August | — | -2.2% | |
| Friday, September 30: | Personal Income | August | 0.2% | 0.4% |
| Personal Spending | August | 0.2% | 0.3% | |
| Chicago PMI | September | 52.0 | 51.5 | |
| Consumer Sentiment | September | 90.0 | 89.8 |
ASSET ALLOCATION PORTFOLIO POSTURE
LONG-RUN STRATEGIC POSTURE: Our long-run forecasts lead us to overweight large cap domestic growth stocks, high-yield corporate bonds, and gold in the diversified “core” of portfolios. Underweight positions in “core” are long-term U.S. Treasuries, foreign developed equities, and REITs. The equity allocation in the short-term tactical “satellite” portion of portfolios currently stands at 60% equity / 40% fixed income.
The information contained herein has been prepared from sources believed to be reliable but is not guaranteed by us and is not a complete summary or statement of all available data, nor is it considered an offer to buy or sell any securities referred to herein. Opinions expressed are subject to change without notice and do not take into account the particular investment objectives, financial situation, or needs of individual investors. There is no guarantee that the figures or opinions forecasted in this report will be realized or achieved. Employees of Stifel, Nicolaus & Company, Incorporated or its affiliates may, at times, release written or oral commentary, technical analysis, or trading strategies that differ from the opinions expressed within. Past performance is no guarantee of future results. Indices are unmanaged, and you cannot invest directly in an index.
Asset allocation and diversification do not ensure a profit and may not protect against loss. There are special considerations associated with international investing, including the risk of currency fluctuations and political and economic events. Investing in emerging markets may involve greater risk and volatility than investing in more developed countries. Due to their narrow focus, sector-based investments typically exhibit greater volatility. Small company stocks are typically more volatile and carry additional risks, since smaller companies generally are not as well established as larger companies. Property values can fall due to environmental, economic, or other reasons, and changes in interest rates can negatively impact the performance of real estate companies. When investing in bonds, it is important to note that as interest rates rise, bond prices will fall. High-yield bonds have greater credit risk than higher quality bonds. The risk of loss in trading commodities and futures can be substantial. You should therefore carefully consider whether such trading is suitable for you in light of your financial condition. The high degree of leverage that is often obtainable in commodity trading can work against you as well as for you. The use of leverage can lead to large losses as well as gains.
The WCA Fundamental Conditions Barometer measures the breadth of changes to a wide variety of fundamental data. The barometer measures the proportion of indicators under review that are moving up or down together. A barometer reading above 50 generally indicates a more bullish environment for the economy and equities, and a lower reading implies the opposite. Quantifying changes this way helps us incorporate new facts into our near-term outlook in an objective and unbiased way. More information on the barometer is found in our latest quarterly report, available at www.washingtoncrossingadvisors.com/insights.html