Monday Morning Minute 080618
THE WEEK AHEAD
Strong economy drives earnings growth, risk appetite, valuations.
A VERY GOOD QUARTER
According to FactSet, second quarter results for the S&P 500 companies were strong, and technology companies led the parade. At the end of July about half of the S&P 500 companies had finished reporting financial results for the second quarter. On average, earnings per share were up 21%, thanks to tax reform and a good economy. So good, in fact, was the economy that sales rose 9.3% for the average S&P 500 company from a year before. These results are made all the more extraordinary given that we are not in the early stages of an economic recovery, but many years into one, a time when we might expect things to be settling down.
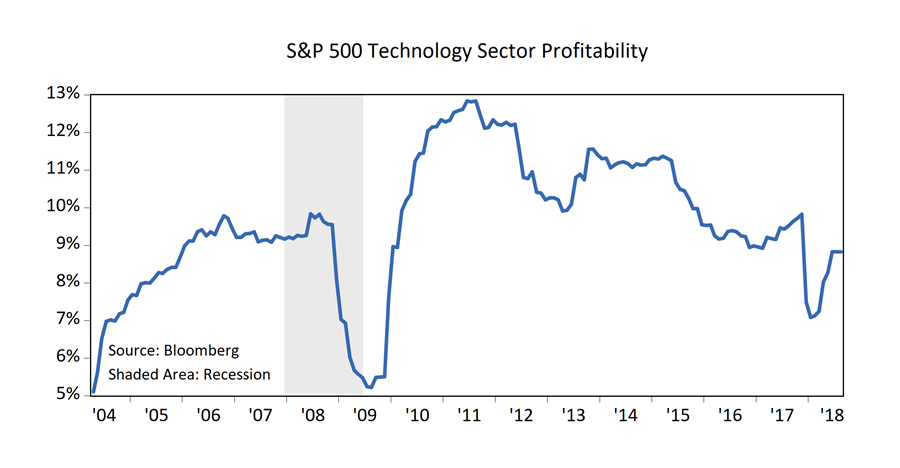
As for leadership, the technology sector posted the most superior results. Ninety percent of companies in the tech sector beat expectations and revenue growth grew an outstanding 14.4%, year-over-year. Based on Bloomberg data, the expected profitability for the technology sector (measured as return on assets) is seen at 14.6% in the year-ahead. If achieved, this would be the highest level of profitability by the sector, relative to assets, ever achieved (chart, below). This is a very good report card for corporate earnings and the leading growth sector, information technology.
Trillion Dollar Companies
We now live in an era of trillion-dollar technology companies, supported by strong current earnings and revenue. But we are reminded of past eras like the 1960s, when growth juggernauts like Polaroid (now defunct) were seen as unstoppable. While ultra-high valuations make for good headlines, they don’t always translate into generous future returns, and excessively high valuations can conceal hidden risk. It makes sense to both acknowledge the tremendous success of today’s biggest growth companies, and then continue to assess their potential going forward.
There are a few ways to look at valuation, and none is perfect. A price-to-earnings multiple is a crude way to relate a stock price to earnings potential. Here we see that the technology sector (the main driver of the “growth style” category) now trades at 19x forecast earnings, using FactSet estimates. This is 31% higher than the sector’s average 10-year multiple of 14.5 times. By contrast, the S&P 500 trades at a forward looking multiple of 16.7x, about 16% above its 10-year average of 14.4x.
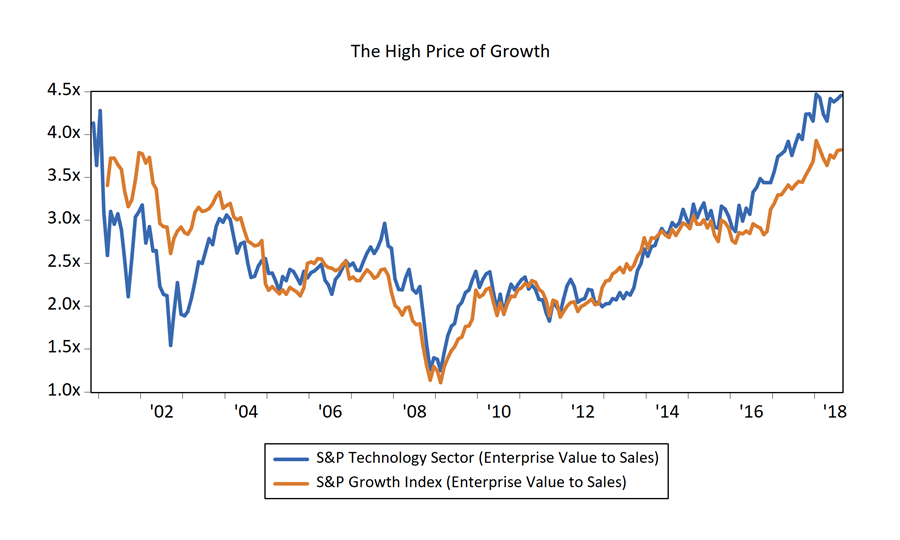
Another way to come at the valuation question for technology and the growth category is to look at “enterprise value” and relate that to sales. Enterprise value adds together the value of the stock with any outstanding debt, net of cash. We like this measure because it incorporates debts directly into the question of value. If we divide this number by a company’s sales, we answer the question “How much does it now cost to buy a dollar of sales when we buy a stock, including any outstanding debt and cash held by the company.” The graph below shows how much investors are paying for a dollar of revenue for both the S&P Technology sector and the S&P 500 Growth index based on enterprise value. As you can see, valuations are high, likely reflecting some combination of lower expected risk, and higher expected growth.
Ultimately, these sorts of valuations (whether measured as price-to-earnings, enterprise-value to revenue, or some other measure) tend to fluctuate up-and-down, but not grow continually. They tend to “revert to the mean” over time. This process leads to periods of outperformance and underperformance by growth sectors and growth style of investments versus other sectors and the value style.
Tactically, we are tilted toward value over growth. This is not because we believe technology companies or other growth sectors do not have a bright future, but because the market already seems to be attaching a very high set of expectations and very low probability of risk to these investments. Indeed, over the decades growth stocks have proven to deliver strong, risk-adjusted returns as whole new industries have been created, opening up potential for massive wealth creation. However, like any other asset, there is a price to be paid and valuations do matter to performance.
At this point, we are finding better value and expected risk-adjusted returns on the value side of the growth-value spectrum.
TACTICAL CALLS
Tactical Satellite (Based on 3-6 Month Outlook)
- Overweight Stocks vs. Bonds
Kevin Caron, CFA, Senior Portfolio Manager
Chad Morganlander, Senior Portfolio Manager
Matthew Battipaglia, Portfolio Manager
Suzanne Ashley, Analyst
(973) 549-4168
www.washingtoncrossingadvisors.com
_______________________________________________________________________________________________________________________________________
Disclosures
WCA Fundamental Conditions Barometer Description: We regularly assess changes in fundamental conditions to help guide near-term asset allocation decisions. The analysis incorporates approximately 30 forward-looking indicators in categories ranging from Credit and Capital Markets to U.S. Economic Conditions and Foreign Conditions. From each category of data, we create three diffusion-style sub-indices that measure the trends in the underlying data. Sustained improvement that is spread across a wide variety of observations will produce index readings above 50 (potentially favoring stocks), while readings below 50 would indicate potential deterioration (potentially favoring bonds). The WCA Fundamental Conditions Index combines the three underlying categories into a single summary measure. This measure can be thought of as a “barometer” for changes in fundamental conditions.
The information contained herein has been prepared from sources believed to be reliable but is not guaranteed by us and is not a complete summary or statement of all available data, nor is it considered an offer to buy or sell any securities referred to herein. Opinions expressed are subject to change without notice and do not take into account the particular investment objectives, financial situation, or needs of individual investors. There is no guarantee that the figures or opinions forecasted in this report will be realized or achieved. Employees of Stifel, Nicolaus & Company, Incorporated or its affiliates may, at times, release written or oral commentary, technical analysis, or trading strategies that differ from the opinions expressed within. Past performance is no guarantee of future results. Indices are unmanaged, and you cannot invest directly in an index.
Asset allocation and diversification do not ensure a profit and may not protect against loss. There are special considerations associated with international investing, including the risk of currency fluctuations and political and economic events. Investing in emerging markets may involve greater risk and volatility than investing in more developed countries. Due to their narrow focus, sector-based investments typically exhibit greater volatility. Small company stocks are typically more volatile and carry additional risks, since smaller companies generally are not as well established as larger companies. Property values can fall due to environmental, economic, or other reasons, and changes in interest rates can negatively impact the performance of real estate companies. When investing in bonds, it is important to note that as interest rates rise, bond prices will fall. High-yield bonds have greater credit risk than higher-quality bonds. The risk of loss in trading commodities and futures can be substantial. You should therefore carefully consider whether such trading is suitable for you in light of your financial condition. The high degree of leverage that is often obtainable in commodity trading can work against you as well as for you. The use of leverage can lead to large losses as well as gains.
All investments involve risk, including loss of principal, and there is no guarantee that investment objectives will be met. It is important to review your investment objectives, risk tolerance and liquidity needs before choosing an investment style or manager. Equity investments are subject generally to market, market sector, market liquidity, issuer, and investment style risks, among other factors to varying degrees. Fixed Income investments are subject to market, market liquidity, issuer, investment style, interest rate, credit quality, and call risks, among other factors to varying degrees.
This commentary often expresses opinions about the direction of market, investment sector and other trends. The opinions should not be considered predictions of future results. The information contained in this report is based on sources believed to be reliable, but is not guaranteed and not necessarily complete.
The securities discussed in this material were selected due to recent changes in the strategies. This selection criteria is not based on any measurement of performance of the underlying security.
The Standard & Poor’s 500 Index is a capitalization-weighted index that is generally considered representative of the U.S. large capitalization market.
Washington Crossing Advisors LLC is a wholly owned subsidiary and affiliated SEC Registered Investment Adviser of Stifel Financial Corp (NYSE: SF).