Monday Morning Minute 060418
THE WEEK AHEAD
As the economy enters its tenth year of growth since the last recession, we look at just how far we’ve come.
MACROECONOMIC INSIGHT
We will soon begin the tenth year of economic expansion since the last recession ended. According to the National Bureau of Economic Research, the recovery from the last recession began in July 2009. With most of our tea-leaves pointing toward continued growth, we thought a look back at where we’ve come from is appropriate.
Amid the turmoil of the Great Recession and 2009 Financial Crisis, the economy and financial markets were in distress. The U.S. unemployment rate was soaring toward 10%, the Dow Jones Industrial Average had fallen by more than 50%, and rescue efforts were underway. The government and central banks had pumped over $10 trillion into the economy via loans, backstops, and guarantees. Extraordinary measures were undertaken by the Fed to provide emergency liquidity to struggling credit markets.
Measuring Progress
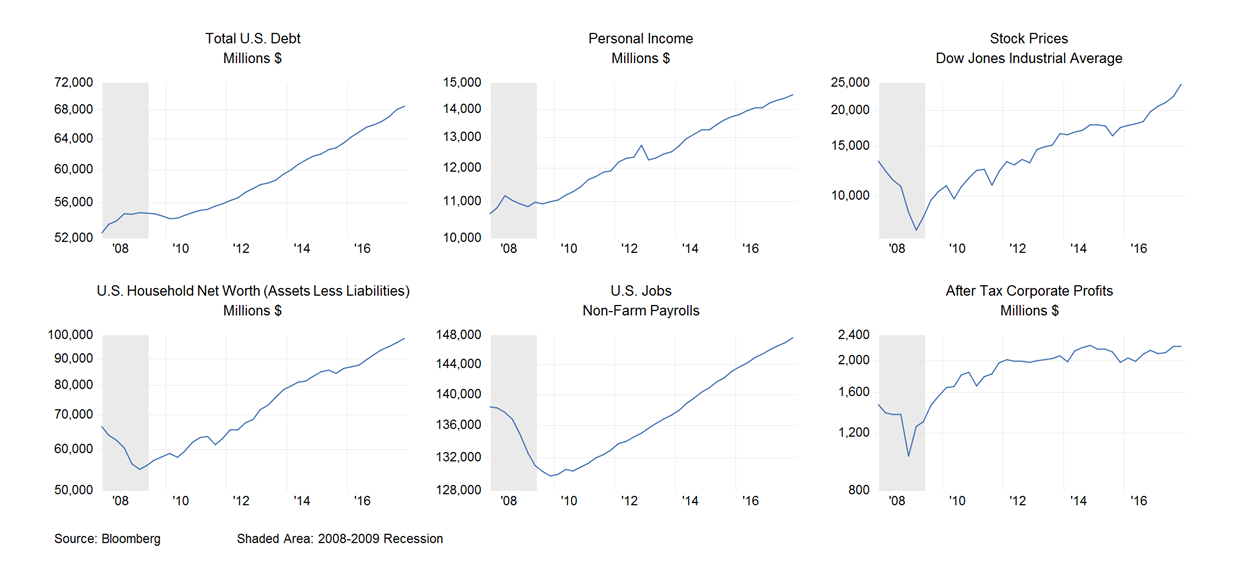
How different the world seems today, as evidenced by the charts below. Last week’s May employment report showed further job gains. Nearly 148 million people are employed in the United States, an increase of 17 million from the start of the recovery in mid-2009. Along with more jobs comes more income, which in turn, feeds overall demand. Household income now stands near $14.5 trillion, a 30% increase since the recovery began.
Business profits grew along with greater demand for goods and services, too. Economy-wide corporate profits are near $2.2 trillion today. This is a 70% improvement compared to just $1.3 trillion in the second quarter 2009.
Because stock prices tend to follow profits, we should not be surprised to see the Dow Jones Industrial Average closing in on 28,000 versus roughly 6,000-11,000 during the 2008-2009 bear market trough.
Rising asset prices, led by stocks, has allowed U.S. households to improve their balance sheets. According to data from the Federal Reserve, household net worth is nearly at record $100 trillion. This marks the largest ever gain in wealth during a cycle, and a staggering 80% improvement from the low-water-mark in 2009.
More to Come?
This expansion is not yet the longest on record. That honor belongs to the 1990s-era expansion. That period of extraordinary growth began in March 1991 and ended ten years later in March 2001. Should the current period of growth persist for another year, the current expansion would become the longest on record.
For now, we recognize the significant changes that are occurring in markets and across the economy. Growth continues, labor markets are tighter, commodity markets are showing signs of price pressure, and interest rates are ratcheting higher. Each of these things are both evidence of the progress that has been made and inputs to deciding what happens next. For now, our indicators are well-behaved, which makes it all the more likely the economy remains on a growth path for at least awhile longer.
ASSET ALLOCATION PORTFOLIO POSTURE
Based on shorter-term expectations, the “tactical satellite” allocation within portfolios is:
Overweight Stocks vs. Bonds
Kevin Caron, CFA, Senior Portfolio Manager
Chad Morganlander, Senior Portfolio Manager
Matthew Battipaglia, Portfolio Manager
Suzanne Ashley, Analyst
(973) 549-4168
www.washingtoncrossingadvisors.com
_______________________________________________________________________________________________________________________________________
Disclosures
WCA Fundamental Conditions Barometer Description: We regularly assess changes in fundamental conditions to help guide near-term asset allocation decisions. The analysis incorporates approximately 30 forward-looking indicators in categories ranging from Credit and Capital Markets to U.S. Economic Conditions and Foreign Conditions. From each category of data, we create three diffusion-style sub-indices that measure the trends in the underlying data. Sustained improvement that is spread across a wide variety of observations will produce index readings above 50 (potentially favoring stocks); while readings below 50 would indicate potential deterioration (potentially favoring bonds). The WCA Fundamental Conditions Index combines the three underlying categories into a single summary measure. This measure can be thought of as a “barometer” for changes in fundamental conditions. The Dow Jones Industrial Average is an index that shows how 30 large, publicly owned companies based in the United States have traded during a standard trading session in the stock market.
The information contained herein has been prepared from sources believed to be reliable but is not guaranteed by us and is not a complete summary or statement of all available data, nor is it considered an offer to buy or sell any securities referred to herein. Opinions expressed are subject to change without notice and do not take into account the particular investment objectives, financial situation, or needs of individual investors. There is no guarantee that the figures or opinions forecasted in this report will be realized or achieved. Employees of Stifel, Nicolaus & Company, Incorporated or its affiliates may, at times, release written or oral commentary, technical analysis, or trading strategies that differ from the opinions expressed within. Past performance is no guarantee of future results. Indices are unmanaged, and you cannot invest directly in an index.
Asset allocation and diversification do not ensure a profit and may not protect against loss. There are special considerations associated with international investing, including the risk of currency fluctuations and political and economic events. Investing in emerging markets may involve greater risk and volatility than investing in more developed countries. Due to their narrow focus, sector-based investments typically exhibit greater volatility. Small company stocks are typically more volatile and carry additional risks, since smaller companies generally are not as well established as larger companies. Property values can fall due to environmental, economic, or other reasons, and changes in interest rates can negatively impact the performance of real estate companies. When investing in bonds, it is important to note that as interest rates rise, bond prices will fall. High-yield bonds have greater credit risk than higher-quality bonds. The risk of loss in trading commodities and futures can be substantial. You should therefore carefully consider whether such trading is suitable for you in light of your financial condition. The high degree of leverage that is often obtainable in commodity trading can work against you as well as for you. The use of leverage can lead to large losses as well as gains.
All investments involve risk, including loss of principal, and there is no guarantee that investment objectives will be met. It is important to review your investment objectives, risk tolerance and liquidity needs before choosing an investment style or manager. Equity investments are subject generally to market, market sector, market liquidity, issuer, and investment style risks, among other factors to varying degrees. Fixed Income investments are subject to market, market liquidity, issuer, investment style, interest rate, credit quality, and call risks, among other factors to varying degrees.
This commentary often expresses opinions about the direction of market, investment sector and other trends. The opinions should not be considered predictions of future results. The information contained in this report is based on sources believed to be reliable, but is not guaranteed and not necessarily complete.
The securities discussed in this material were selected due to recent changes in the strategies. This selection criterion is not based on any measurement of performance of the underlying security.
Washington Crossing Advisors LLC is a wholly owned subsidiary and affiliated SEC Registered Investment Adviser of Stifel Financial Corp (NYSE: SF).