Monday Morning Minute 040918
THE WEEK AHEAD
Volatility continues amid headline noise on trade.
MACROECONOMIC INSIGHT
Recent headlines have been enough to unnerve even the most seasoned investor. The tension between the United States and the rest of the world seems to increase daily. On Friday, the United States threatened to levy another $100 billion of tariffs on Chinese imports, which would bring the total to $153 billion. Because the United States exported only $130 billion to China last year, it may prove tough for China to reciprocate in kind. While much of this is likely posturing ahead of some final agreement, the tone of the discussion is creating a sense of unease.
The discord and uncertainty are evident in market volatility, which has surged. The Dow Jones Industrial Average fluctuated in a 2,000 point range throughout most of February and March, after a steady two-year climb. Interest rates are also moving higher. The 10-year Treasury bond, which yielded about 2.25% last fall, now yields over 2.8%. The rate charged to corporate borrowers is up even more, as the yield on Baa-rated corporate bonds has increased by about 0.5% since January.
But is all of this worry justified? Or is it yet another bout of concern that will end up creating buying opportunities for more patient investors? Only time will tell, but our most recent reading of the market and economic tea leaves points to continued, but moderating, growth.
On the growth front, there is some reason for optimism. The latest release from the Bureau of Labor Statistics shows that U.S. productivity growth rose by 1.5% from -0.6% in 2016 to +0.9% in 2017. While below past levels, the trend is in the right direction. They also tell us that private payrolls increased 1.8% in the last year. More jobs and higher productivity are an excellent place to start for explaining growth, especially long-term economic growth. In turn, this growth goes a long way to describe what drives market returns.
Consider this chart, for example, from the 1940s to today there is an inexact, but clear link between the size of the economy and the value of stocks. The same cannot be said about interest rates, tax changes, or even political party influence. While all of these things can and do impact the short-run, leading to expansions and occasional contractions, other forces appear to dominate the long-run growth story. We believe productivity, investment, and demographic trends do a fair job explaining the bigger picture.

Source: Bloomberg
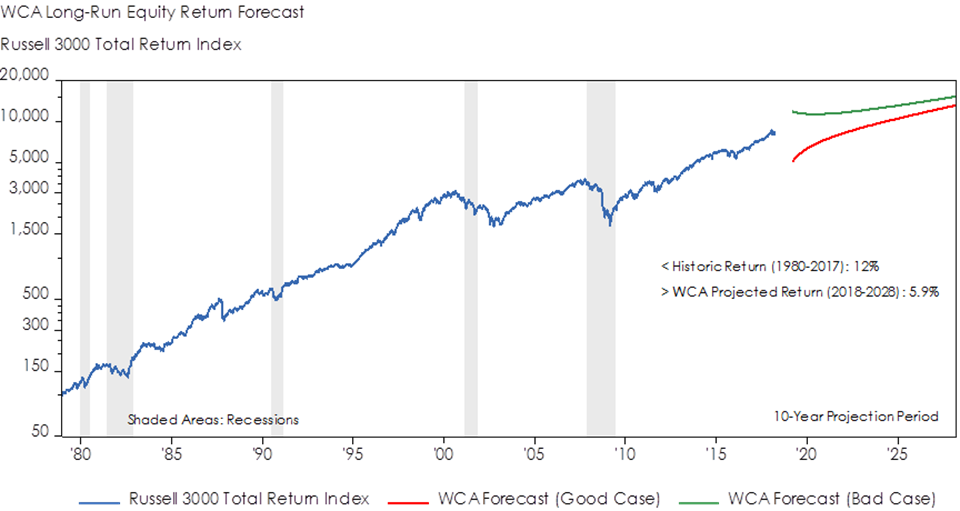
What Drives WCA’s Long-Run Forecasts
We incorporate this point of view into our long-run forecasts, along with our assessment of valuations, profitability, and near-term business conditions. Currently, we expect to see positive contributions to long-run (+10 years) domestic equity returns coming from economic growth, dividends, and share buybacks. These positives are tempered by expected declines in profitability and multiples over time. The net result is a 5.9% expected return as our base case, within a broader range of potential outcomes (graph, below). Note that this return expectation is lower than history and the 7% approximate long-run return assumptions often assumed by institutional investors and pensions.
Source: Bloomberg, WCA
Two Types of Risk: “Now and Later”
Rather than focusing on each day’s headline “noise” or every bump in the market, it is important to adopt a point of view that is consistent with your goals. Focusing on the mix of assets and the fundamental nature of the businesses that back those assets is most important. A view that balances the potential for longer-term reward with a realistic understanding of day-to-day market risk can help. Ultimately, portfolios must be built to handle two types of risk — “now” risk and “later” risk. The risk of a loss “now” can be reduced by moving to safer assets like cash or T-Bills, but only at the cost of increasing the of the risk of falling short of your long-term investment goals “later” on down the road.
Like so many things in life, balance is the key to staying calm and sane when markets become tumultuous.
Kevin Caron, CFA, Senior Portfolio Manager
Chad Morganlander, Senior Portfolio Manager
Matthew Battipaglia, Portfolio Manager
Suzanne Ashley, Analyst
(973) 549-4168
ECONOMIC DATA THIS WEEK
| Date | Report | Period | Survey | Prior |
| Monday, Apr 9: | No Economic Data | |||
| Tuesday, Apr 10: | NFIB Small Business Optimism | Mar | — | 107.6 |
| PPI Final Demand M/M | Mar | 0.1% | 0.2% | |
| PPI Ex Food & Energy M/M | Mar | 0.2% | 0.2% | |
| PPI Ex Food, Energy & Trade M/M | Mar | — | 0.4% | |
| PPI Final Demand Y/Y | Mar | 2.9% | 2.8% | |
| PPI Ex Food & Energy Y/Y | Mar | 2.6% | 2.5% | |
| PPI Ex Food, Energy & Trade Y/Y | Mar | — | 2.7% | |
| Wednesday, Apr 11: | CPI M/M | Mar | 0.0% | 0.2% |
| CPI Ex Food & Energy M/M | Mar | 0.2% | 0.2% | |
| CPI Y/Y | Mar | 2.3% | 2.2% | |
| CPI Ex Food & Energy Y/Y | Mar | 2.0% | 1.8% | |
| FOMC Meeting Minutes | 3/21 | |||
| Thursday, Apr 12: | Weekly Jobless Claims | 4/7 | — | 242k |
| Import Price Index M/M | Mar | 0.1% | 0.4% | |
| Import Price Index Y/Y | Mar | — | 3.5% | |
| Export Price Index M/M | Mar | — | 0.2% | |
| Export Price Index Y/Y | Mar | — | 3.3% | |
| Friday, Apr 13: | JOLTS | Feb | — | 6,312 |
| Consumer Sentiment | Apr | 101 | 101.4 | |
| Source: Bloomberg |
ASSET ALLOCATION PORTFOLIO POSTURE
Based on our long-run capital market expectations, the “diversified core” allocation within portfolios is:
Overweight Foreign Developed equities vs. Emerging Markets
Overweight Domestic LG Cap Value vs. Growth
Neutral Duration and Credit vs. Target Exposure
Based on shorter-term expectations, the “tactical satellite” allocation within portfolios is:
Overweight Stocks vs. Bonds
Disclosures
WCA Fundamental Conditions Barometer Description: We regularly assess changes in fundamental conditions to help guide near-term asset allocation decisions. The analysis incorporates approximately 30 forward-looking indicators in categories ranging from Credit and Capital Markets to U.S. Economic Conditions and Foreign Conditions. From each category of data, we create three diffusion-style sub-indices that measure the trends in the underlying data. Sustained improvement that is spread across a wide variety of observations will produce index readings above 50 (potentially favoring stocks), while readings below 50 would indicate potential deterioration (potentially favoring bonds). The WCA Fundamental Conditions Index combines the three underlying categories into a single summary measure. This measure can be thought of as a “barometer” for changes in fundamental conditions.
The information contained herein has been prepared from sources believed to be reliable but is not guaranteed by us and is not a complete summary or statement of all available data, nor is it considered an offer to buy or sell any securities referred to herein. Opinions expressed are subject to change without notice and do not take into account the particular investment objectives, financial situation, or needs of individual investors. There is no guarantee that the figures or opinions forecasted in this report will be realized or achieved. Employees of Stifel, Nicolaus & Company, Incorporated or its affiliates may, at times, release written or oral commentary, technical analysis, or trading strategies that differ from the opinions expressed within. Past performance is no guarantee of future results. Indices are unmanaged, and you cannot invest directly in an index.
Asset allocation and diversification do not ensure a profit and may not protect against loss. There are special considerations associated with international investing, including the risk of currency fluctuations and political and economic events. Investing in emerging markets may involve greater risk and volatility than investing in more developed countries. Due to their narrow focus, sector-based investments typically exhibit greater volatility. Small company stocks are typically more volatile and carry additional risks, since smaller companies generally are not as well established as larger companies. Property values can fall due to environmental, economic, or other reasons, and changes in interest rates can negatively impact the performance of real estate companies. When investing in bonds, it is important to note that as interest rates rise, bond prices will fall. High-yield bonds have greater credit risk than higher-quality bonds. The risk of loss in trading commodities and futures can be substantial. You should therefore carefully consider whether such trading is suitable for you in light of your financial condition. The high degree of leverage that is often obtainable in commodity trading can work against you as well as for you. The use of leverage can lead to large losses as well as gains.
All investments involve risk, including loss of principal, and there is no guarantee that investment objectives will be met. It is important to review your investment objectives, risk tolerance and liquidity needs before choosing an investment style or manager. Equity investments are subject generally to market, market sector, market liquidity, issuer, and investment style risks, among other factors to varying degrees. Fixed Income investments are subject to market, market liquidity, issuer, investment style, interest rate, credit quality, and call risks, among other factors to varying degrees.
This commentary often expresses opinions about the direction of market, investment sector and other trends. The opinions should not be considered predictions of future results. The information contained in this report is based on sources believed to be reliable, but is not guaranteed and not necessarily complete. The securities discussed in this material were selected due to recent changes in the strategies. This selection criteria is not based on any measurement of performance of the underlying security. Washington Crossing Advisors LLC is a wholly owned subsidiary and affiliated SEC Registered Investment Adviser of Stifel Financial Corp (NYSE: SF). The Dow Jones Industrial Average is an index that shows how 30 large, publicly owned companies based in the United States have traded during a standard trading session in the stock market. The Standard & Poor’s 500 Index is a capitalization-weighted index that is generally considered representative of the U.S. large capitalization market. The Russell 3000 Index measures the performance of the 3,000 largest U.S. companies based on total market capitalization, which represents approximately 98% of the investable U.S. equity market. The average market capitalization is approximately $4 billion, and the median market capitalization is approximately $700 million.