International Monetary Fund: Worst is Yet to Come
Evidence is mounting that the economy is grinding toward a halt, threatening financial markets. Last month, the International Monetary Fund (IMF) predicted a challenging environment ahead. The IMF summarized the situation in the IMF’s October World Economic Outlook with this sobering assessment:
“More than a third of the global economy will contract this year or next, while the three largest economies—the United States, the European Union, and China—will continue to stall. In short, the worst is yet to come, and for many people, 2023 will feel like a recession.“
IMF Economic Counselor and Director of the Research Department, Pierre-Olivier Gourinchas
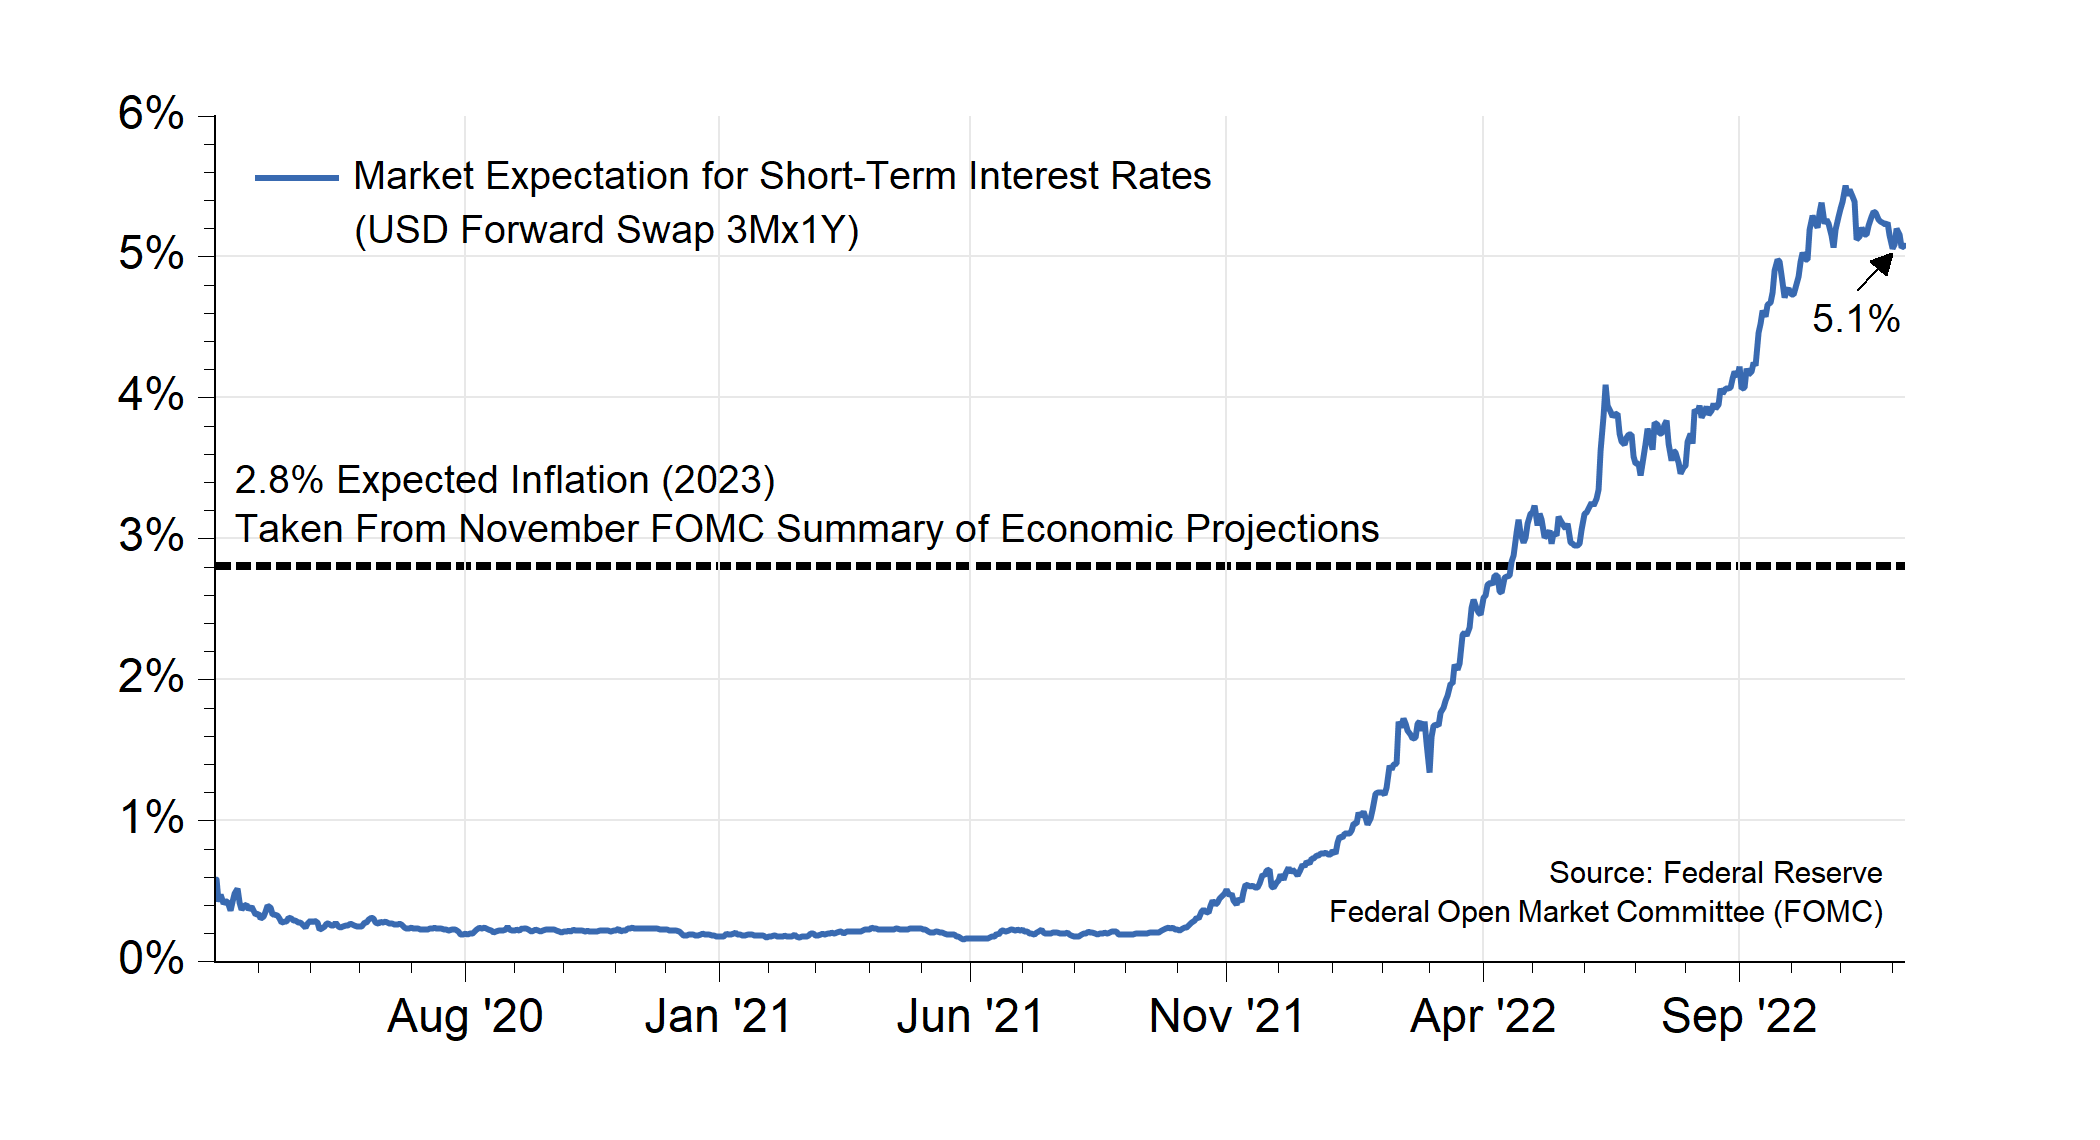
The IMF goes on to identify high inflation, the war in Ukraine, and supply disruptions as the main culprits weighing on growth. Excessive inflation is prompting the Federal Reserve (Fed) and other central banks to raise interest rates. As the chart below shows (Chart A), the expected level of interest rates in the United States is soaring. The market expects short-term interest to eclipse 5% within a year, a far cry from the near-zero tranquility of 2020-2021. A 5% rate would also be far above the 2.8% inflation rate forecast by the Federal Reserve’s Federal Open Market Committee (FOMC) in November. Based on the FOMC’s own projections and the expected short-term policy rate, we now view the policy position of the Fed as restrictive. Such a policy stance tends to be a negative for financial and economic conditions.
Chart A
Monetary Policy Now Restrictive
A Recessionary Environment?
At present, we are not in a recession and the Federal Reserve Bank of Atlanta’s GDP Now model has the U.S. economy growing near an annualized 3.4% presently. However, tightening financial conditions as posited by the IMF could quickly complicate the situation, almost ensuring a recession under the IMF’s baseline. That baseline calls for the world’s economy to grow at a mere 1.6% next year. Since 1980, recessionary conditions emerged in every case when global growth fell below this level. To illustrate, here is a list of the past several episodes of global growth at or below 1.6%:
Global Growth Episodes Below 1.6% (1970-2020)
- 1975 — Global growth clocks in at 1.3% during the “Energy Crisis” recession;
- 1982 — The world saw global growth of just 0.4% in 1982 amid an environment of soaring inflation and unemployment;
- 2009 — The Global Financial Crisis of 2009 brought worldwide growth to a standstill, with output falling -0.4% for the year;
- 2020 — Shutdowns at the onset of the Covid-19 Pandemic caused global growth to contract -3.0% in 2020.
Our Take on Trends
We regularly assess incoming data in three categories:
- High-frequency market-based indicators of financial conditions;
- Monthly data on U.S. economic activity;
- A mixed bag of indicators designed to reflect global conditions.
Last month, financial conditions improved, but U.S. economic data weakened, and so did our global conditions indicators. Consequently, our overall WCA Barometer, which consolidates all of these impulses, also slipped. Moreover, our barometer’s forecast path for the next three months declined (chart B below). This leads us to continue our underweight to stocks (chart C below).
Chart B
WCA Fundamental Conditions “Barometer”
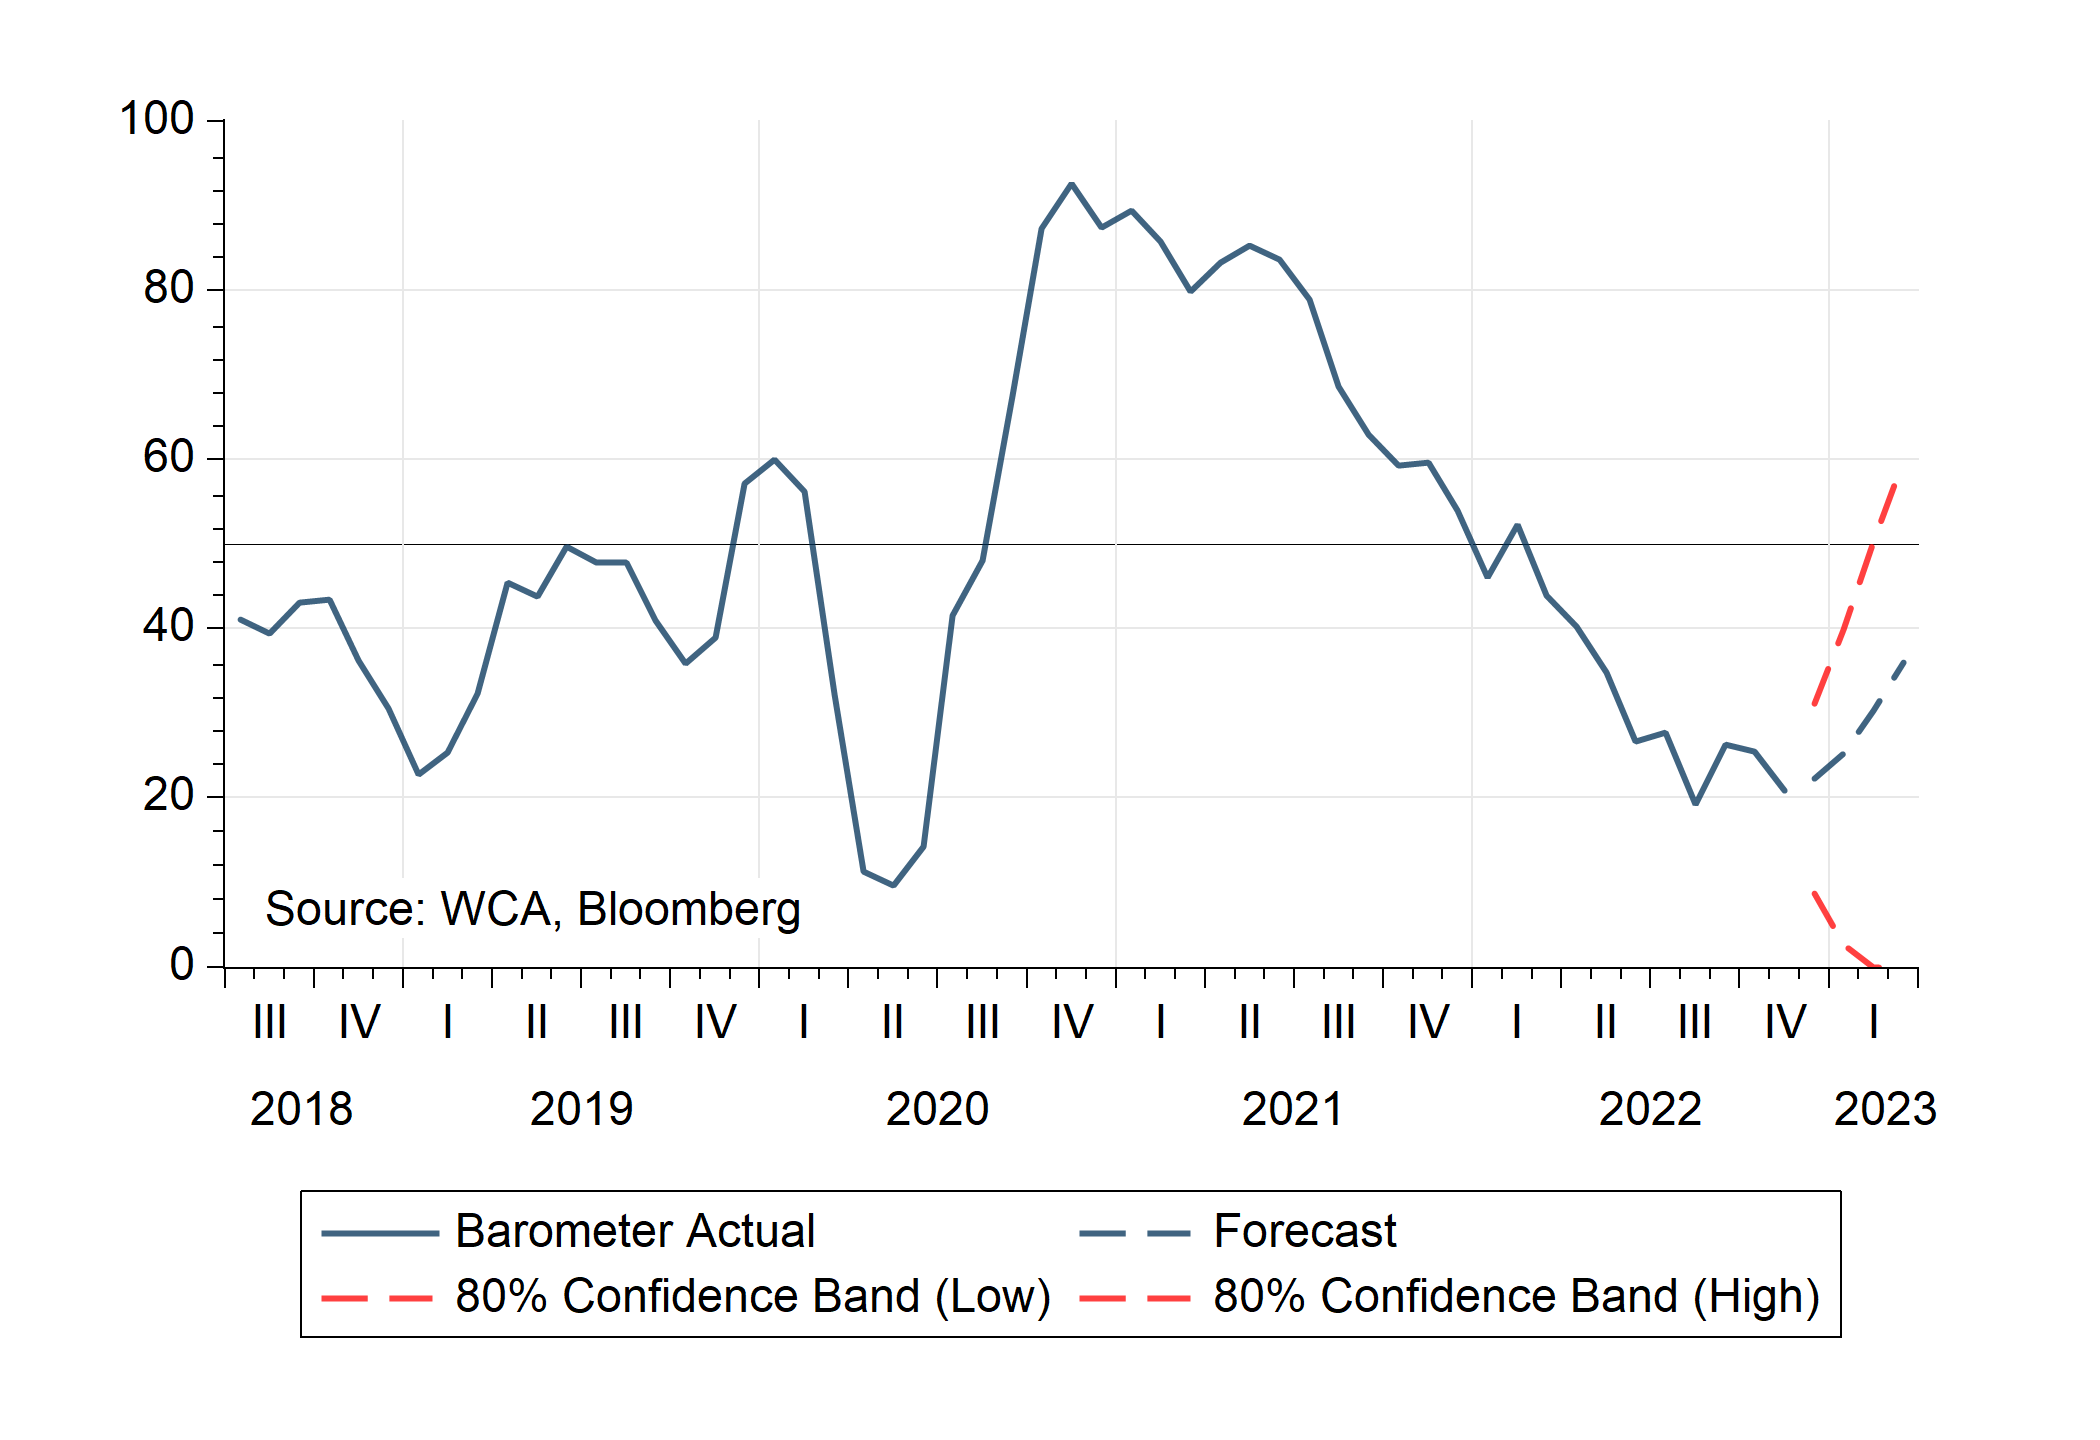
Chart C
Tactical Stock / Bond Allocation

Anecdotal Observations
We now see sustained slippage across a wide variety of indicators. In the United States, retail sales are fading, auto sales are lackluster, home sales are falling, labor supply is again contracting, most stocks are declining, factory orders are weak, and capital goods orders are rolling over. Overseas, we see fading demand starting to weigh on commodity prices, deficient levels of business confidence across Europe, and Chinese manufacturing looks weak. Meanwhile, the October-November stock rally is losing momentum, and the long end of the Treasury yield curve is falling. The U.S. yield curve is now inverted by 0.75% (75 basis points); the last two times the curve inverted this way was during the 2000-2002 recession and the 2008-2009 financial crisis.
On the plus side of the ledger, we are encouraged to see credit spreads hold up reasonably well along with earnings forecasts. Credit spreads are up slightly, with Baa-10yr Treasury spreads inching up to about 2.5% (250 basis points), modestly above year ago levels near 1.75% (175 basis points). Corporate earnings forecasts for the S&P 500 are also holding up fine. While expected next 12-month earnings projections are off about 4% from mid-summer, there is no sign of significant stress. Perhaps a stronger-than-expected performance from the corporate sector, coupled with better starting equity valuations and bond yields, offer a silver lining amid a field of darkening clouds?
Conclusion
We would like to offer better news about the economy, but the IMF’s latest assessment and our own read of the data keeps us from doing so just yet. So, we keep with our discipline of unbiasedly evaluating incoming data and sticking with quality stocks. At some point, we expect to see a turn for the better, perhaps as inflation fades and aggressive policy tightening ends in the coming months. Until then, we believe portfolios are appropriately positioned to take advantage of better longer run returns which we see on the other side of this challenging environment.
WCA Fundamental Conditions Barometer:
We regularly assess changes in fundamental conditions to help guide near-term asset allocation decisions. The analysis incorporates approximately 30 forward-looking indicators in categories ranging from Credit and Capital Markets to U.S. Economic Conditions and Foreign Conditions. From each category of data, we create three diffusion-style sub-indices that measure the trends in the underlying data. Sustained improvement that is spread across a wide variety of observations will produce index readings above 50 (potentially favoring stocks), while readings below 50 would indicate potential deterioration (potentially favoring bonds). The WCA Fundamental Conditions Index combines the three underlying categories into a single summary measure. This measure can be thought of as a “barometer” for changes in fundamental conditions.
Disclosures:
WCA Barometer – We regularly assess changes in fundamental conditions to help guide near-term asset allocation decisions. Analysis incorporates approximately 30 forward-looking indicators in categories ranging from Credit and Capital Markets to U.S. Economic Conditions and Foreign Conditions. From each category of data, we create three diffusion-style sub-indices that measure the trends in the underlying data. Sustained improvement that is spread across a wide variety of observations will produce index readings above 50 (potentially favoring stocks), while readings below 50 would indicate potential deterioration (potentially favoring bonds). The WCA Fundamental Conditions Index combines the three underlying categories into a single summary measure. This measure can be thought of as a “barometer” for changes in fundamental conditions.
Standard & Poor’s 500 Index (S&P 500) is a capitalization-weighted index that is generally considered representative of the U.S. large capitalization market.
The S&P 500® Information Technology comprises those companies included in the S&P 500 that are classified as members of the GICS® information technology sector.
S&P Global (SPGI) is a leading American provider of financial information, analytics, and credit ratings, headquartered in New York, NY. It operates major divisions including S&P Global Ratings, S&P Global Market Intelligence, S&P Global Commodity Insights, S&P Global Mobility, and S&P Dow Jones Indices.
The ICE BofA U.S. High Yield Index is an unmanaged index that tracks the performance of U.S. dollar denominated, below investment-grade rated corporate debt publicly issued in the U.S. domestic market.
The S&P 500 Growth measures constituents from the S&P 500 that are classified as growth stocks based on three factors: sales growth, the ratio of earnings change to price, and momentum.
The S&P 500 Value Index measures constituents from the S&P 500 that are classified as value stocks based on three factors: the ratios of book value, earnings and sales to price.
The S&P 500 Equal Weight Index is the equal-weight version of the widely regarded Standard & Poor’s 500 Index, which is generally considered representative of the U.S. large capitalization market. The index has the same constituents as the capitalization-weighted S&P 500, but each company in the index is allocated a fixed weight of 0.20% at each quarterly rebalancing.
The WCA Rising Dividend Custom Benchmark is a rules-based benchmark constructed by Washington Crossing Advisors to represent a universe of large capitalization U.S. companies that meet certain quality and dividend growth criteria, including proprietary screens for profitability, earnings consistency, and balance sheet strength, along with minimum market capitalization and dividend growth requirements. The benchmark is reconstituted and rebalanced quarterly and is intended to serve as a style-appropriate benchmark for the WCA Rising Dividend strategy.
The Washington Crossing Advisors’ High Quality Index and Low Quality Index are objective, quantitative measures designed to identify quality in the top 1,000 U.S. companies. Ranked by fundamental factors, WCA grades companies from “A” (top quintile) to “F” (bottom quintile). Factors include debt relative to equity, asset profitability, and consistency in performance. Companies with lower debt, higher profitability, and greater consistency earn higher grades. These indices are reconstituted annually and rebalanced daily. For informational purposes only, and WCA Quality Grade indices do not reflect the performance of any WCA investment strategy.
The risk of loss in trading commodities and futures can be substantial. You should therefore carefully consider whether such trading is suitable for you in light of your financial condition. The high degree of leverage that is often obtainable in commodity trading can work against you as well as for you. The use of leverage can lead to large losses as well as gains.
The information contained herein has been prepared from sources believed to be reliable but is not guaranteed by us and is not a complete summary or statement of all available data, nor is it considered an offer to buy or sell any securities referred to herein. Opinions expressed are subject to change without notice and do not take into account the particular investment objectives, financial situation, or needs of individual investors. There is no guarantee that the figures or opinions forecast in this report will be realized or achieved. Employees of Stifel, Nicolaus & Company, Incorporated or its affiliates may, at times, release written or oral commentary, technical analysis, or trading strategies that differ from the opinions expressed within. Past performance is no guarantee of future results. Indices are unmanaged, and you cannot invest directly in an index.
Asset allocation and diversification do not ensure a profit and may not protect against loss. There are special considerations associated with international investing, including the risk of currency fluctuations and political and economic events. Changes in market conditions or a company’s financial condition may impact a company’s ability to continue to pay dividends, and companies may also choose to discontinue dividend payments. Investing in emerging markets may involve greater risk and volatility than investing in more developed countries. Due to their narrow focus, sector-based investments typically exhibit greater volatility. Small-company stocks are typically more volatile and carry additional risks since smaller companies generally are not as well established as larger companies. Property values can fall due to environmental, economic, or other reasons, and changes in interest rates can negatively impact the performance of real estate companies. When investing in bonds, it is important to note that as interest rates rise, bond prices will fall. High-yield bonds have greater credit risk than higher-quality bonds. Bond laddering does not assure a profit or protect against loss in a declining market. The risk of loss in trading commodities and futures can be substantial. You should therefore carefully consider whether such trading is suitable for you in light of your financial condition. The high degree of leverage that is often obtainable in commodity trading can work against you as well as for you. The use of leverage can lead to large losses as well as gains. Changes in market conditions or a company’s financial condition may impact a company’s ability to continue to pay dividends, and companies may also choose to discontinue dividend payments.
All investments involve risk, including loss of principal, and there is no guarantee that investment objectives will be met. It is important to review your investment objectives, risk tolerance, and liquidity needs before choosing an investment style or manager. Equity investments are subject generally to market, market sector, market liquidity, issuer, and investment style risks, among other factors to varying degrees. Fixed Income investments are subject to market, market liquidity, issuer, investment style, interest rate, credit quality, and call risks, among other factors to varying degrees.
Beta is a measure of the volatility, or systematic risk, of a security or a portfolio relative to the market as a whole. A beta of one is considered as risky as the benchmark and is therefore likely to provide expected returns approximate to those of the benchmark during both up and down periods. A portfolio with a beta of two would move approximately twice as much as the benchmark.
Standard deviation is a measure of the volatility of a security’s or portfolio’s returns in relation to the mean return. The larger the standard deviation, the greater the volatility of return in relation to the mean return.
Changes in market conditions or a company’s financial condition may impact a company’s ability to continue to pay dividends, and companies may also choose to discontinue dividend payments
This commentary often expresses opinions about the direction of market, investment sector, and other trends. The opinions should not be considered predictions of future results. The information contained in this report is based on sources believed to be reliable, but is not guaranteed and not necessarily complete.
The securities discussed in this material were selected due to recent changes in the strategies. This selection criterion is not based on any measurement of performance of the underlying security.
Washington Crossing Advisors, LLC is a wholly-owned subsidiary and affiliated SEC Registered Investment Adviser of Stifel Financial Corp (NYSE: SF). Registration with the SEC implies no level of sophistication in investment management.