Global Growth Disappoints
The Federal Reserve (Fed) meets on interest rates this week, and two indicators of October manufacturing activity are expected to indicate weakness through the month. Expectations for an imminent rate hike have been moving further out as global growth disappoints. The International Monetary Fund (IMF) recently cut their forecast for global growth to just 3.1% this year, compared to 3.4% growth last year. The globe is struggling with an adjustment to a lower growth trajectory following a series of credit and investment booms. The latest indications of declining growth came from the Mario Draghi and the People’s Bank of China last week. Draghi indicated that the European Central Bank (ECB) is leaning toward expanded monetary stimulus and said he was “open to a whole new menu of monetary policy instruments.” China’s central bank cut rates 0.25% on both deposit and lending rates in its latest move to stimulate growth. Markets responded to these announcements by buying stocks and the U.S. dollar. Commodities fell sharply with oil down 6% for the week and natural gas declining to its lowest level since 2012. There continues to be growing skepticism that the Fed will move rates higher this year against this backdrop of global weakness, monetary divergence, and dollar strength. This week the Fed meets on monetary policy; and while no change in rates is expected, support for a 2015 rate increase is clearly fading.
The Bigger Picture
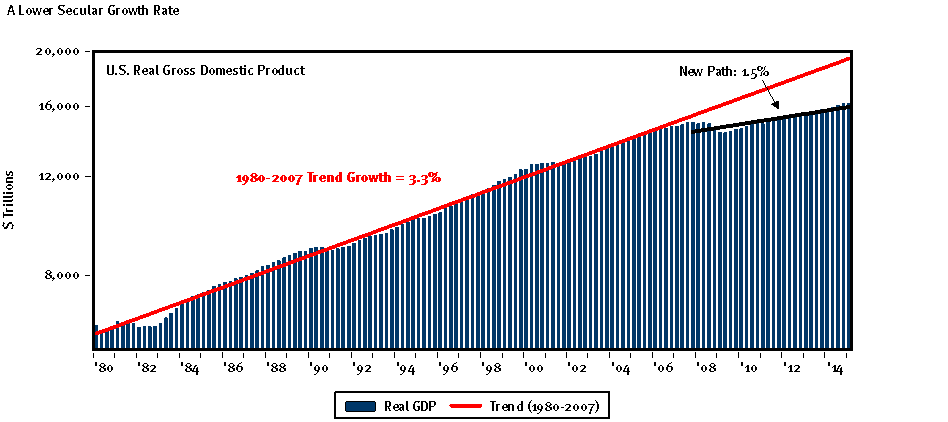
We want to take a moment and put the current global slowdown in a broader context. For several years now, growth has been a disappointment as the recovery did not match the vibrancy of past cycles. There are many possible reasons for this, but the credit boom that preceded the last recession and the private sector delveraging that followed explain a good part of issue. There are other reasons as well. Capital investment, labor, and productivity (the main long-run drivers of real growth) are all growing much slower than they did in the more heady 1980-2007 period. Labor growth is trending at 0.3%, versus 1.4% in the past. Capital investment is growing at a mere 2.4% trend, versus 5.6% in the past. Even productivity has slowed despite a host of technological advances in recent years. Economic theory would suggest that output growth and market returns would also be lower, and this is exactly what is happening. Real growth is trending near 1.5%, and equity returns over the last decade are far lower than the 1980s and 1990s.
[table id=17 /]
Taken together, the U.S. economy is on a lower overall growth path, and the shift relates to structural, not cyclical factors. The shift in the longer-run secular growth rate is easy to see when we view the real growth rate in the economy over a longer period of time. This chart very clearly shows a break following the 2007-2009 recession.
China
While the United States downshifted following the 2008-2009 recession, China’s growth was staggering. In dollar terms, the World Bank estimates that the Chinese economy more than doubled from $5.1 trillion GDP in 2009 to $10.4 trillion GDP by 2014. Adjusting for differences in price levels, China may well be as big as the United States in terms of output. China’s growth is, however, slowing.
We are also aware that China’s recent growth was augmented by a sharp rise in borrowings and credit (Table B, right). Like our mortgage boom, China grew outstanding credit by $15.7 trillion, to $24.9 trillion from $9.2 trillion. It did this in just six years, according to the Bank of International Settlements. For every one dollar in output growth (Gross Domestic Product), three dollars of borrowing took place. This pace is unsustainable and confirms the idea that China’s will continue to see growth moderate from here.
[table id=10 /]
Conclusion
Growth is positive but weak. This pattern has been in place since the start of recovery in 2009, and we expect it to continue. Adding to challenges this year is the overhang from slowing growth out of China and emerging markets. We see both cyclical and structural causes behind this slowdown. Of immediate interest is how the Fed, who meets this week, squares its stated intention to tighten with the fact that large parts of the world are undergoing significant stress.
Asset Allocation Portfolio Posture
LONG-RUN STRATEGIC POSTURE: Strategic allocations are set to reflect our long-run forecasts for key asset classes. We expect policy rates to remain low as central banks continue to push lower-for-longer rate strategies. Eventually, rates should rise back to more normal levels, but this is expected to happen gradually and unevenly. Fixed income returns are expected to lag current yields as rates rise. Equity returns will track moderate growth in global Gross Domestic Product (GDP) with little to no further lift from margin expansion (margins are already elevated). Equity valuations appear reasonable and in line with historic multiples, so no additional return is being attributed to margin expansion.
The information contained herein has been prepared from sources believed to be reliable but is not guaranteed by us and is not a complete summary or statement of all available data, nor is it considered an offer to buy or sell any securities referred to herein. Opinions expressed are subject to change without notice and do not take into account the particular investment objectives, financial situation, or needs of individual investors. There is no guarantee that the figures or opinions forecasted in this report will be realized or achieved. Employees of Stifel, Nicolaus & Company, Incorporated or its affiliates may, at times, release written or oral commentary, technical analysis, or trading strategies that differ from the opinions expressed within. Past performance is no guarantee of future results. Indices are unmanaged, and you cannot invest directly in an index.
Asset allocation and diversification do not ensure a profit and may not protect against loss. There are special considerations associated with international investing, including the risk of currency fluctuations and political and economic events. Investing in emerging markets may involve greater risk and volatility than investing in more developed countries. Due to their narrow focus, sector-based investments typically exhibit greater volatility. Small company stocks are typically more volatile and carry additional risks, since smaller companies generally are not as well established as larger companies. Property values can fall due to environmental, economic, or other reasons, and changes in interest rates can negatively impact the performance of real estate companies. When investing in bonds, it is important to note that as interest rates rise, bond prices will fall. High-yield bonds have greater credit risk than higher quality bonds. The risk of loss in trading commodities and futures can be substantial. You should therefore carefully consider whether such trading is suitable for you in light of your financial condition. The high degree of leverage that is often obtainable in commodity trading can work against you as well as for you. The use of leverage can lead to large losses as well as gains.
The WCA Fundamental Conditions Barometer measures the breadth of changes to a wide variety of fundamental data. The barometer measures the proportion of indicators under review that are moving up or down together. A barometer reading above 50 generally indicates a more bullish environment for the economy and equities, and a lower reading implies the opposite. Quantifying changes this way helps us incorporate new facts into our near-term outlook in an objective and unbiased way. More information on the barometer is found in our latest quarterly report, available at www.washingtoncrossingadvisors.com/insights.html.