Down to Earth?
On the surface, valuations appear to be coming back down to earth. The Standard & Poor’s 500 stock index has declined to nearly 4,000 from almost 4,800 in January. Back at the January peak, forecast year-ahead earnings for the index stood at $223, and now those forecasts are at $237. Today’s price-earnings ratio is 17x compared with 21x in January and in line with the 10-year average. So, stocks are moving down despite rising profit forecasts, resulting in better value.
Valuation Risk
The Federal Reserve (Fed), in its recent “Financial Stability Report,” expressed concern over asset values. According to the report, asset values appeared “elevated.” Moreover, the Fed sees valuations as “high relative to economic fundamentals or historical norms.” The report went on to show that stocks appeared expensive relative to earnings and real estate values were expensive compared to rents.
We agree with this assessment but point out that some adjustments are needed to make comparisons with history more meaningful.
Big Picture
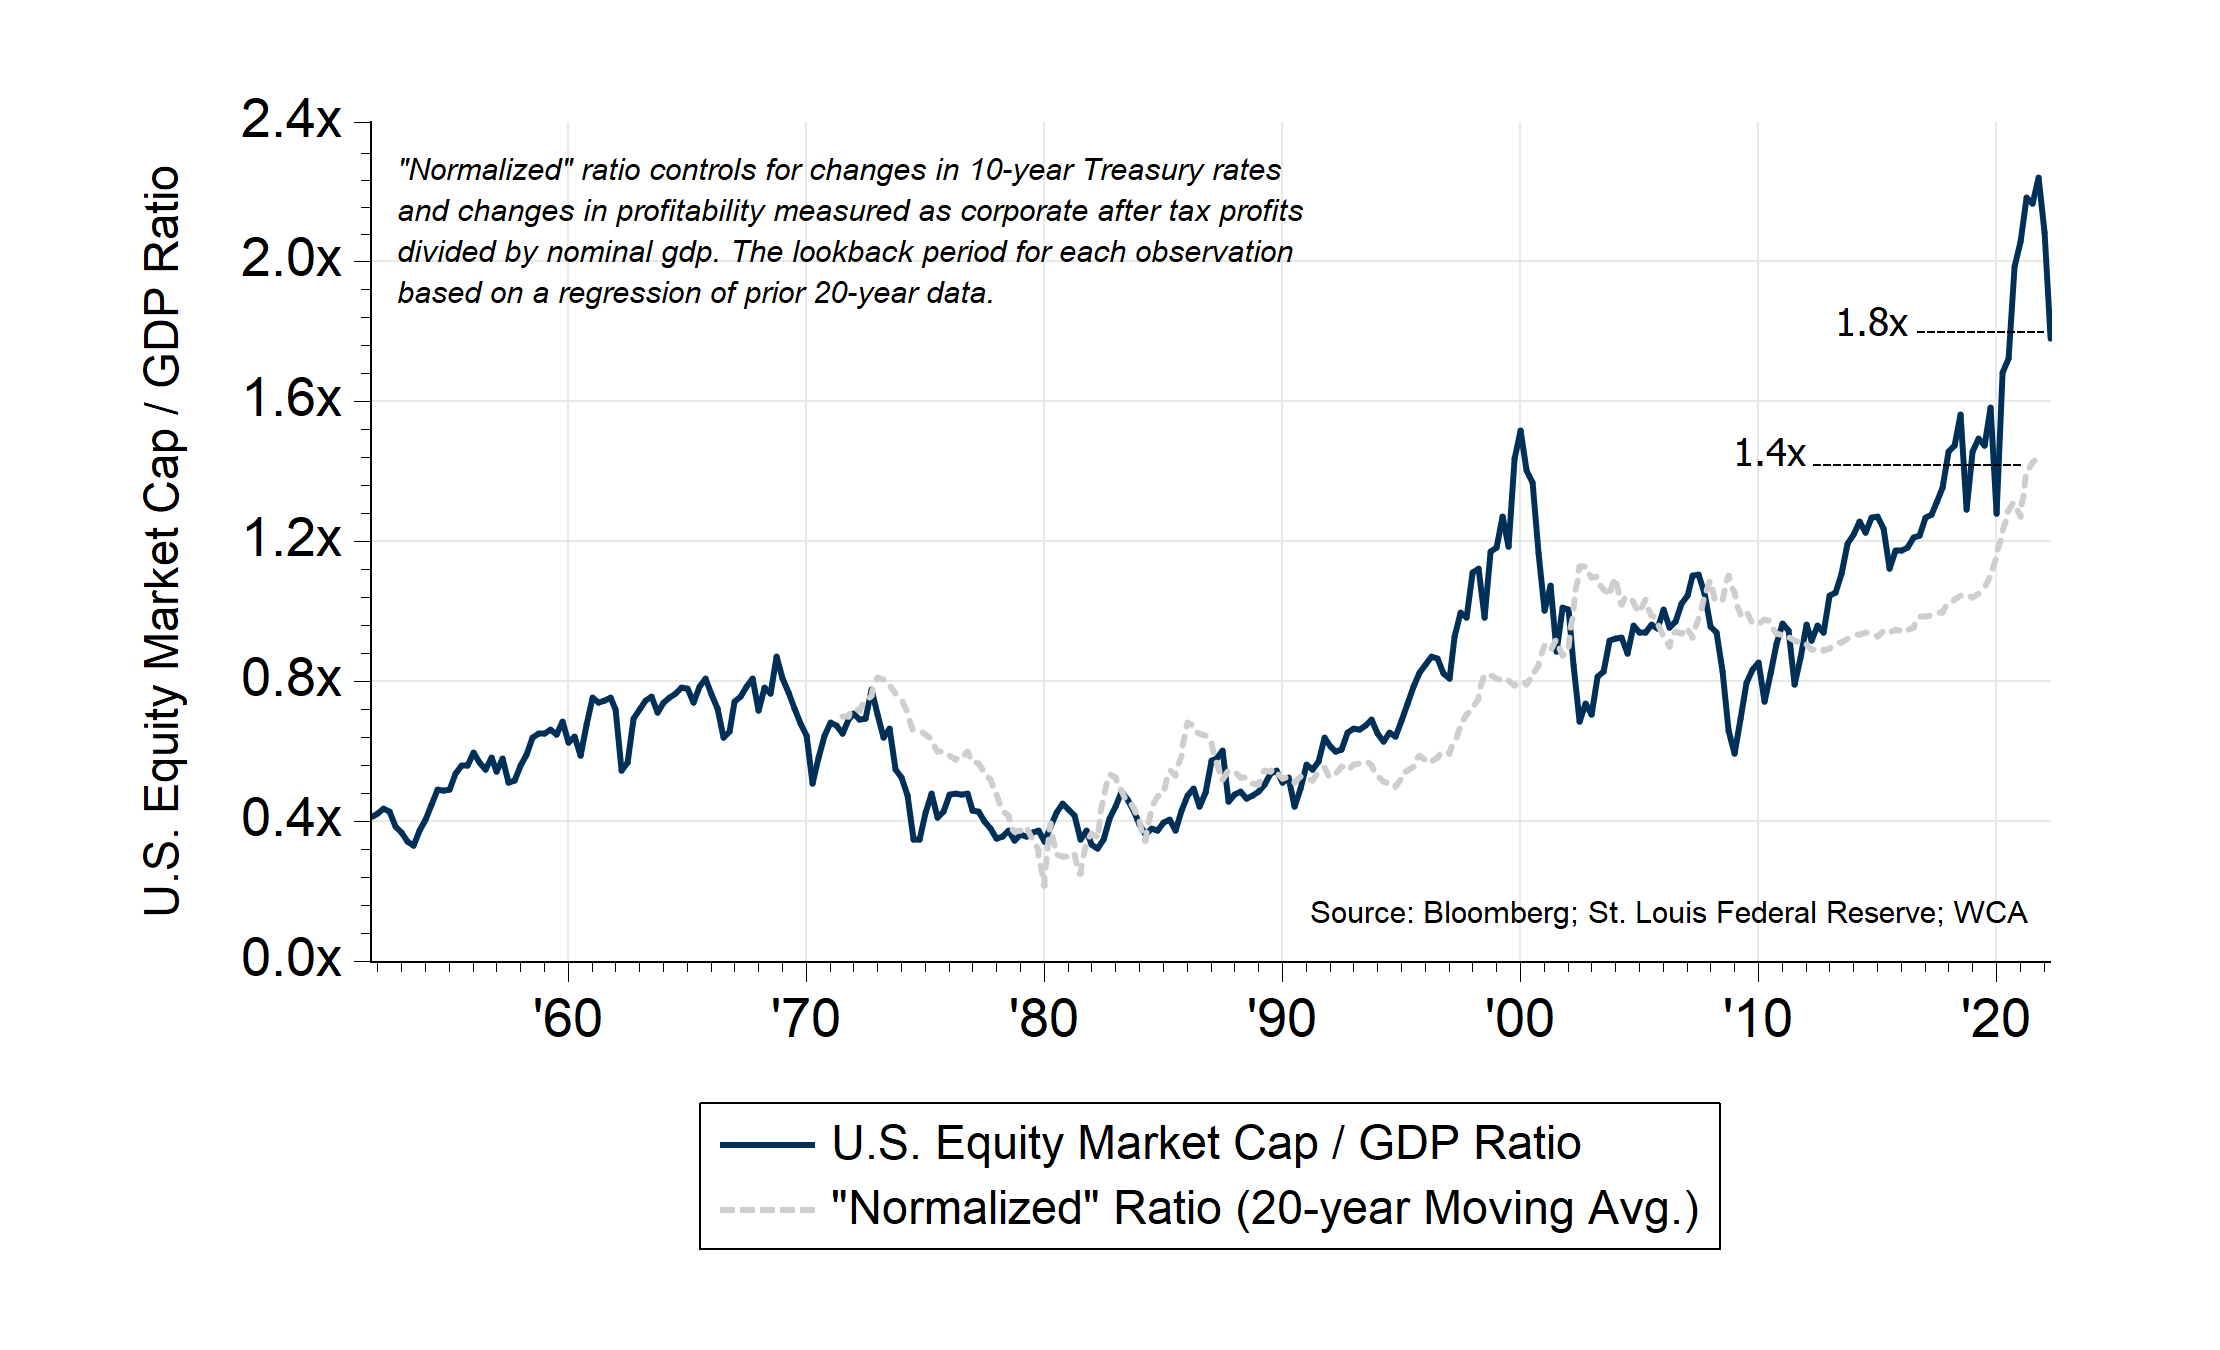
For U.S. stocks, we often compare the total value of domestic corporate equity to the economy’s size. Chart A below shows this relationship since 1950. Immediately, we see that, at 1.8x gross domestic product (GDP), stocks are not cheap. Yet, we must consider two critical factors: interest rates are still low, and profitability is high compared to the past.
The grey line in the graph “normalizes” the effect of low rates and profitability by examining the relationship between stock multiples, interest rates, and profitability over 20-year rolling periods. Even adjusting for these factors, today’s 1.8x multiple appears stretched compared to our “normalized” 1.4x multiple. So, even controlling for these two factors, we still end up with a market that seems expensive.
Chart A
The U.S. Market Cap to GDP Ratio
The Crux of the Matter
Concern over falling profits due to the war in Ukraine or inflation is not the cause of the 800 point decline in the S&P 500 from the January peak. Instead, a combination of rising interest rates and an increase in risk aversion is the crux of the matter. When Treasury rates rise, the bond market offers a more attractive alternative to stocks, all else being equal. Since the start of the year, the 10-year U.S. Treasury yield has jumped to near 3% from 1.75%. Naturally, stock investors are taking a second look at bonds, and the present value of future stock earnings is lower.
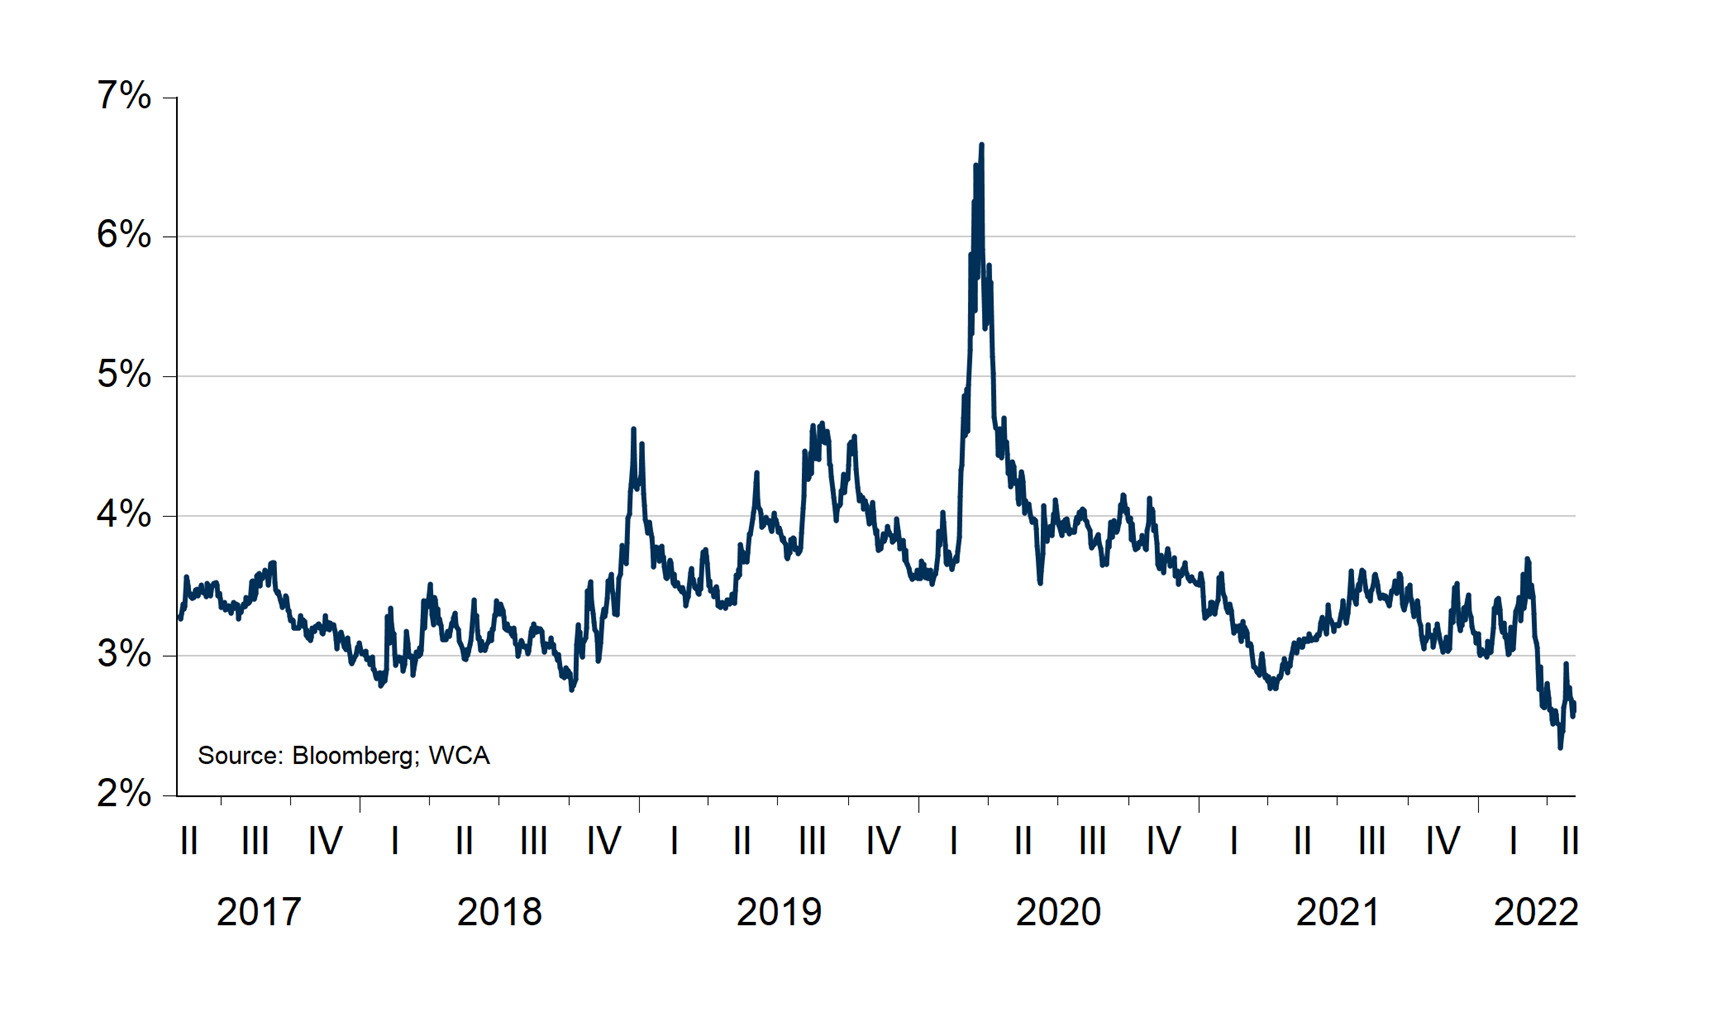
Excess enthusiasm has been cooling after throwing caution to the wind the past couple of years. Rising inflation and the Russia-Ukraine war also contribute to more caution among stock investors. A measure of the “equity risk premium” — the extra compensation that investors require for holding stocks relative to Treasury bonds — is still low. We calculate this by subtracting the 10-year Treasury yield from the forward S&P 500 earnings yield (Chart B, below). As you can see, there has been a slight uptick in the equity risk premium, but it remains low compared to the past.
Chart B
Equity Risk Premium
Conclusion
We agree with the Federal Reserve’s assessment that valuations for stocks and other assets appear rich. Moreover, these elevated valuations pose additional economic risks, especially as policy supports are wound down. The Fed’s task of engineering a “soft landing” is complicated by high inflation. Consequently, we believe it is essential to maintain a focus on owning highly flexible, durable, and predictable businesses at reasonable valuations. We hope to address some of the near-term risks that the Federal Reserve’s recent risk assessment points out by sticking with this long-held strategy.
Disclosures:
WCA Barometer – We regularly assess changes in fundamental conditions to help guide near-term asset allocation decisions. Analysis incorporates approximately 30 forward-looking indicators in categories ranging from Credit and Capital Markets to U.S. Economic Conditions and Foreign Conditions. From each category of data, we create three diffusion-style sub-indices that measure the trends in the underlying data. Sustained improvement that is spread across a wide variety of observations will produce index readings above 50 (potentially favoring stocks), while readings below 50 would indicate potential deterioration (potentially favoring bonds). The WCA Fundamental Conditions Index combines the three underlying categories into a single summary measure. This measure can be thought of as a “barometer” for changes in fundamental conditions.
Standard & Poor’s 500 Index (S&P 500) is a capitalization-weighted index that is generally considered representative of the U.S. large capitalization market.
S&P Global (SPGI) is a leading American provider of financial information, analytics, and credit ratings, headquartered in New York, NY. It operates major divisions including S&P Global Ratings, S&P Global Market Intelligence, S&P Global Commodity Insights, S&P Global Mobility, and S&P Dow Jones Indices.
The ICE BofA U.S. High Yield Index is an unmanaged index that tracks the performance of U.S. dollar denominated, below investment-grade rated corporate debt publicly issued in the U.S. domestic market.
The S&P 500 Growth measures constituents from the S&P 500 that are classified as growth stocks based on three factors: sales growth, the ratio of earnings change to price, and momentum.
The S&P 500 Value Index measures constituents from the S&P 500 that are classified as value stocks based on three factors: the ratios of book value, earnings and sales to price.
The S&P 500 Equal Weight Index is the equal-weight version of the widely regarded Standard & Poor’s 500 Index, which is generally considered representative of the U.S. large capitalization market. The index has the same constituents as the capitalization-weighted S&P 500, but each company in the index is allocated a fixed weight of 0.20% at each quarterly rebalancing.
The WCA Rising Dividend Custom Benchmark is a rules-based benchmark constructed by Washington Crossing Advisors to represent a universe of large capitalization U.S. companies that meet certain quality and dividend growth criteria, including proprietary screens for profitability, earnings consistency, and balance sheet strength, along with minimum market capitalization and dividend growth requirements. The benchmark is reconstituted and rebalanced quarterly and is intended to serve as a style-appropriate benchmark for the WCA Rising Dividend strategy.
The Washington Crossing Advisors’ High Quality Index and Low Quality Index are objective, quantitative measures designed to identify quality in the top 1,000 U.S. companies. Ranked by fundamental factors, WCA grades companies from “A” (top quintile) to “F” (bottom quintile). Factors include debt relative to equity, asset profitability, and consistency in performance. Companies with lower debt, higher profitability, and greater consistency earn higher grades. These indices are reconstituted annually and rebalanced daily. For informational purposes only, and WCA Quality Grade indices do not reflect the performance of any WCA investment strategy.
The risk of loss in trading commodities and futures can be substantial. You should therefore carefully consider whether such trading is suitable for you in light of your financial condition. The high degree of leverage that is often obtainable in commodity trading can work against you as well as for you. The use of leverage can lead to large losses as well as gains.
The information contained herein has been prepared from sources believed to be reliable but is not guaranteed by us and is not a complete summary or statement of all available data, nor is it considered an offer to buy or sell any securities referred to herein. Opinions expressed are subject to change without notice and do not take into account the particular investment objectives, financial situation, or needs of individual investors. There is no guarantee that the figures or opinions forecast in this report will be realized or achieved. Employees of Stifel, Nicolaus & Company, Incorporated or its affiliates may, at times, release written or oral commentary, technical analysis, or trading strategies that differ from the opinions expressed within. Past performance is no guarantee of future results. Indices are unmanaged, and you cannot invest directly in an index.
Asset allocation and diversification do not ensure a profit and may not protect against loss. There are special considerations associated with international investing, including the risk of currency fluctuations and political and economic events. Changes in market conditions or a company’s financial condition may impact a company’s ability to continue to pay dividends, and companies may also choose to discontinue dividend payments. Investing in emerging markets may involve greater risk and volatility than investing in more developed countries. Due to their narrow focus, sector-based investments typically exhibit greater volatility. Small-company stocks are typically more volatile and carry additional risks since smaller companies generally are not as well established as larger companies. Property values can fall due to environmental, economic, or other reasons, and changes in interest rates can negatively impact the performance of real estate companies. When investing in bonds, it is important to note that as interest rates rise, bond prices will fall. High-yield bonds have greater credit risk than higher-quality bonds. Bond laddering does not assure a profit or protect against loss in a declining market. The risk of loss in trading commodities and futures can be substantial. You should therefore carefully consider whether such trading is suitable for you in light of your financial condition. The high degree of leverage that is often obtainable in commodity trading can work against you as well as for you. The use of leverage can lead to large losses as well as gains. Changes in market conditions or a company’s financial condition may impact a company’s ability to continue to pay dividends, and companies may also choose to discontinue dividend payments.
All investments involve risk, including loss of principal, and there is no guarantee that investment objectives will be met. It is important to review your investment objectives, risk tolerance, and liquidity needs before choosing an investment style or manager. Equity investments are subject generally to market, market sector, market liquidity, issuer, and investment style risks, among other factors to varying degrees. Fixed Income investments are subject to market, market liquidity, issuer, investment style, interest rate, credit quality, and call risks, among other factors to varying degrees.
Beta is a measure of the volatility, or systematic risk, of a security or a portfolio relative to the market as a whole. A beta of one is considered as risky as the benchmark and is therefore likely to provide expected returns approximate to those of the benchmark during both up and down periods. A portfolio with a beta of two would move approximately twice as much as the benchmark.
Standard deviation is a measure of the volatility of a security’s or portfolio’s returns in relation to the mean return. The larger the standard deviation, the greater the volatility of return in relation to the mean return.
Changes in market conditions or a company’s financial condition may impact a company’s ability to continue to pay dividends, and companies may also choose to discontinue dividend payments
This commentary often expresses opinions about the direction of market, investment sector, and other trends. The opinions should not be considered predictions of future results. The information contained in this report is based on sources believed to be reliable, but is not guaranteed and not necessarily complete.
The securities discussed in this material were selected due to recent changes in the strategies. This selection criterion is not based on any measurement of performance of the underlying security.
Washington Crossing Advisors, LLC is a wholly-owned subsidiary and affiliated SEC Registered Investment Adviser of Stifel Financial Corp (NYSE: SF). Registration with the SEC implies no level of sophistication in investment management.


