Capital Spending & The Profit Cycle
Business investment has been a key driver of S&P 500 profits and performance over time (chart below). The story has two layers: a long-term structural trend of labor substitution through capital — a process underway for decades — and a sharper cyclical surge driven by AI investment today.
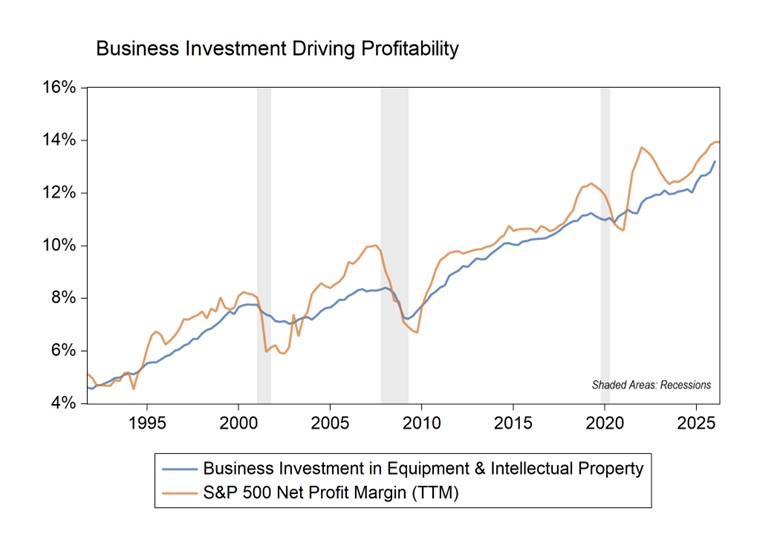
Source: WCA, Bloomberg
Over the past several decades, business investment in equipment and intellectual property has grown nearly twice as fast as the overall economy. But that long-run trend masks pronounced cycles, and history offers two useful reference points.
In the late 1990s, networking capital spending pushed business investment up roughly 14% per year from 1996 to 2000 — about double the economy’s growth rate. Corporate profits doubled as a share of GDP, rising from 5% to 8% between 1995 and 2000. Confidence in the future was running high. Then in 2001, capital spending slowed abruptly and unexpectedly; profits fell back to around 6% of GDP (a 25% relative decline), and the NASDAQ dropped 85%. Previous investments were questioned, and write-offs followed. The best opportunities for investors turned out to show up during the shakeout, not the run-up.
The mid-2000s repeated the pattern. Confidence returned, investment firmed, and profits rose again as a share of national income. Business investment reached about 8.5% of GDP by 2006, and profits advanced 70% through 2007 to a record 10% of the economy — up from under 6% in 2002. The five-year cycle ended suddenly when bad mortgage loans unexpectedly triggered the 2008–2009 financial crisis, and the S&P 500 fell nearly 60%. Again, the best opportunities came during the pullback.
Where We Are Today
With the brief exception of the COVID recession, we are now in an unprecedented cycle favoring capital over labor. U.S. public equity markets just hit $77 trillion, and private equity could add another $10–20 trillion. At a combined $87–97 trillion against roughly $32 trillion in national income, the value of equity capital markets relative to the economy is without precedent.
Much of this value creation traces back to a growing share of national income flowing to businesses, and much of that profitability traces back to business investment in equipment and, increasingly, intellectual property. The mega-trend reignited after the 2008–2009 crisis, continued through COVID, and has accelerated further with the AI boom that began in 2022–2023. Trends in S&P 500 net profit margins tie closely to business investment as a share of national income (see chart above). The glue that holds this whole process together is a sometimes fickle ingredient: confidence.
The AI Capital Cycle
Trillions of dollars are now committed to building AI capacity, much of it through massive data centers and through complex revenue-sharing and ownership arrangements between partners and customers. A 2025 McKinsey study estimated that roughly $5 trillion will be invested globally to build out AI capacity by 2030*. Some of this will generate substantial profit. Some will not. As markets evaluate which is which, the process is likely to be volatile — as it was in past technological cycles.
The valuation picture reinforces this concern because it reveals very lofty expectations. To measure how lofty expectations are, we might look at implied growth rates at today’s prices. For example, by subtracting a company’s operating cash flow yield from its weighted average cost of capital, one can derive the market’s long-run implied growth rate for each stock. Many companies clustered around the AI trade currently trade at implied growth rates in the mid-to-upper teens — two or more standard deviations above their own 10-year averages. The question this raises is straightforward: can this many companies, simultaneously, meet expectations this elevated? Some will. But if investment moderates — as capital spending cycles invariably do — meeting these expectations will be a tall order for the cluster as a whole.
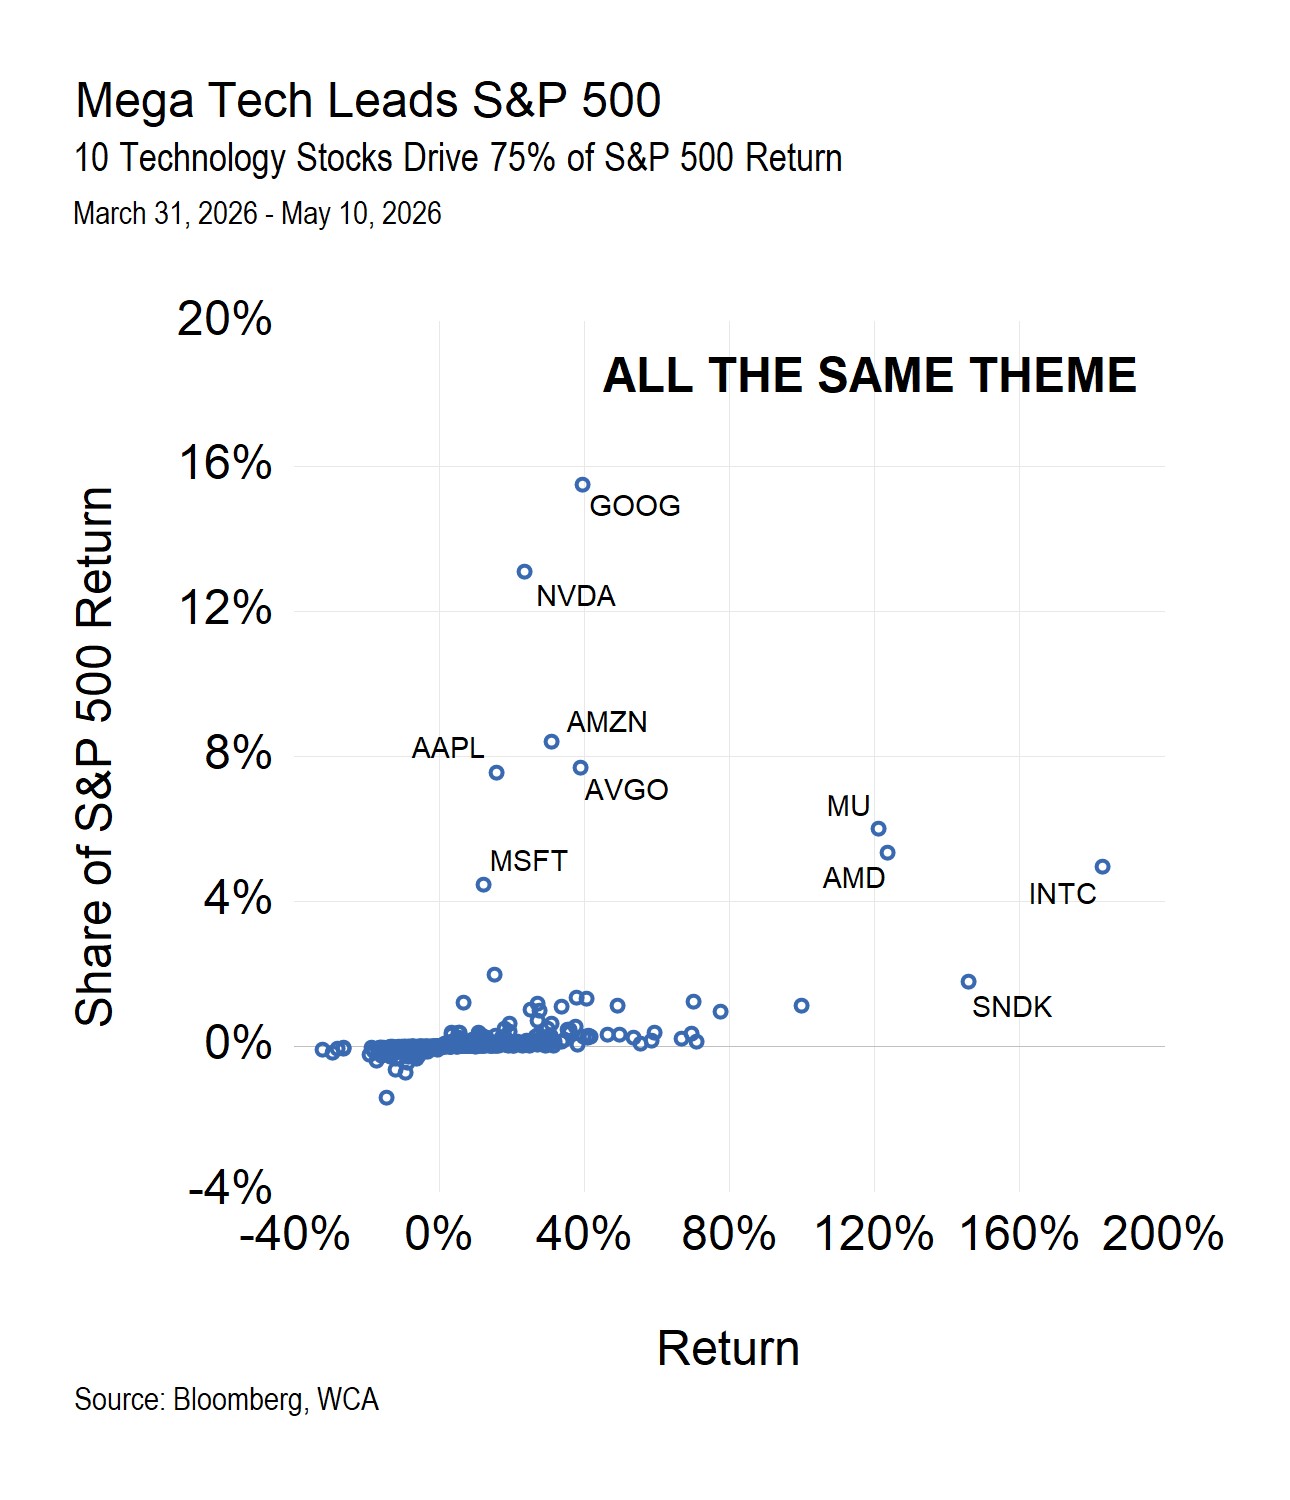
We must also point out that all the companies driving the market forward in recent weeks have been advancing on the exact same narrative. Every one of the top ten companies that have driven the S&P 500’s recent advance, for example, is directly tied to the technology / artificial intelligence theme (chart below). While long-run implied growth rates for these 10 companies have risen with the AI buildout, it is important to remember that they cannot grow faster than the economy into perpetuity. Conversely, other sectors of the economy have been neglected in this cycle. Where are the consumer companies? Or healthcare companies? Or industrials? These are conspicuously absent. The broader market has been largely left behind. As the chart below shows, 75% of the S&P 500’s recent gain has come from ten stocks — all of whom are advancing for similar reasons (AI investment). By the way, most of the other 25% of the market’s recent gains are also directly or indirectly attributable to the same theme. When one narrative theme is overwhelmingly responsible for moving the S&P 500, it is hard to consider an investment in “the market” as “well diversified.”
Instead, the S&P 500 clearly becomes a one-sided, narrowly focused, increasingly risky bet.
Implications for Investors
We remain bullish on the long-run productivity potential of AI and automation. But capital-spending-driven profit cycles can reverse abruptly, and they have historically ended with periods of disappointment before the next leg of productivity gains arrives.
This is why we stick with quality at a reasonable price. The best opportunities in past cycles revealed themselves during pullbacks, not during the run-up. Maintaining discipline on quality and price gives our strategy a good chance of delivering the steady returns and rising income our advisors and clients expect. Abandoning that discipline exposes portfolios to excessive and uncompensated risk. Applying risk management strategies through a cycle like this is not about giving up gains — it is about positioning to take advantage of quality and value when prices properly compensate for the risk taken. Additionally, risk management strategies are about cushioning the inevitable drawdown that will likely occur when the theme runs its course.
* McKinsey Quarterly: The Cost of Compute: A $7 Trillion Race to Scale Data Centers
Kevin R. Caron, CFA
Senior Portfolio Manager
973-549-4051
Chad Morganlander
Senior Portfolio Manager
973-549-4052
Steve Lerit, CFA
Head of Portfolio Risk
973-549-4028
Eric Needham
External Sales and Marketing
312-771-6010
Matthew Battipaglia
Portfolio Manager
973-549-4047
Jeffrey Battipaglia
Client Portfolio Manager
973-549-4031
Suzanne Ashley
Internal Relationship Manager
973-549-4168
Disclosures:
WCA Barometer – We regularly assess changes in fundamental conditions to help guide near-term asset allocation decisions. Analysis incorporates approximately 30 forward-looking indicators in categories ranging from Credit and Capital Markets to U.S. Economic Conditions and Foreign Conditions. From each category of data, we create three diffusion-style sub-indices that measure the trends in the underlying data. Sustained improvement that is spread across a wide variety of observations will produce index readings above 50 (potentially favoring stocks), while readings below 50 would indicate potential deterioration (potentially favoring bonds). The WCA Fundamental Conditions Index combines the three underlying categories into a single summary measure. This measure can be thought of as a “barometer” for changes in fundamental conditions.
Standard & Poor’s 500 Index (S&P 500) is a capitalization-weighted index that is generally considered representative of the U.S. large capitalization market.
The S&P 500® Information Technology comprises those companies included in the S&P 500 that are classified as members of the GICS® information technology sector.
S&P Global (SPGI) is a leading American provider of financial information, analytics, and credit ratings, headquartered in New York, NY. It operates major divisions including S&P Global Ratings, S&P Global Market Intelligence, S&P Global Commodity Insights, S&P Global Mobility, and S&P Dow Jones Indices.
The ICE BofA U.S. High Yield Index is an unmanaged index that tracks the performance of U.S. dollar denominated, below investment-grade rated corporate debt publicly issued in the U.S. domestic market.
The S&P 500 Growth measures constituents from the S&P 500 that are classified as growth stocks based on three factors: sales growth, the ratio of earnings change to price, and momentum.
The S&P 500 Value Index measures constituents from the S&P 500 that are classified as value stocks based on three factors: the ratios of book value, earnings and sales to price.
The S&P 500 Equal Weight Index is the equal-weight version of the widely regarded Standard & Poor’s 500 Index, which is generally considered representative of the U.S. large capitalization market. The index has the same constituents as the capitalization-weighted S&P 500, but each company in the index is allocated a fixed weight of 0.20% at each quarterly rebalancing.
The WCA Rising Dividend Custom Benchmark is a rules-based benchmark constructed by Washington Crossing Advisors to represent a universe of large capitalization U.S. companies that meet certain quality and dividend growth criteria, including proprietary screens for profitability, earnings consistency, and balance sheet strength, along with minimum market capitalization and dividend growth requirements. The benchmark is reconstituted and rebalanced quarterly and is intended to serve as a style-appropriate benchmark for the WCA Rising Dividend strategy.
The Washington Crossing Advisors’ High Quality Index and Low Quality Index are objective, quantitative measures designed to identify quality in the top 1,000 U.S. companies. Ranked by fundamental factors, WCA grades companies from “A” (top quintile) to “F” (bottom quintile). Factors include debt relative to equity, asset profitability, and consistency in performance. Companies with lower debt, higher profitability, and greater consistency earn higher grades. These indices are reconstituted annually and rebalanced daily. For informational purposes only, and WCA Quality Grade indices do not reflect the performance of any WCA investment strategy.
The risk of loss in trading commodities and futures can be substantial. You should therefore carefully consider whether such trading is suitable for you in light of your financial condition. The high degree of leverage that is often obtainable in commodity trading can work against you as well as for you. The use of leverage can lead to large losses as well as gains.
The information contained herein has been prepared from sources believed to be reliable but is not guaranteed by us and is not a complete summary or statement of all available data, nor is it considered an offer to buy or sell any securities referred to herein. Opinions expressed are subject to change without notice and do not take into account the particular investment objectives, financial situation, or needs of individual investors. There is no guarantee that the figures or opinions forecast in this report will be realized or achieved. Employees of Stifel, Nicolaus & Company, Incorporated or its affiliates may, at times, release written or oral commentary, technical analysis, or trading strategies that differ from the opinions expressed within. Past performance is no guarantee of future results. Indices are unmanaged, and you cannot invest directly in an index.
Asset allocation and diversification do not ensure a profit and may not protect against loss. There are special considerations associated with international investing, including the risk of currency fluctuations and political and economic events. Changes in market conditions or a company’s financial condition may impact a company’s ability to continue to pay dividends, and companies may also choose to discontinue dividend payments. Investing in emerging markets may involve greater risk and volatility than investing in more developed countries. Due to their narrow focus, sector-based investments typically exhibit greater volatility. Small-company stocks are typically more volatile and carry additional risks since smaller companies generally are not as well established as larger companies. Property values can fall due to environmental, economic, or other reasons, and changes in interest rates can negatively impact the performance of real estate companies. When investing in bonds, it is important to note that as interest rates rise, bond prices will fall. High-yield bonds have greater credit risk than higher-quality bonds. Bond laddering does not assure a profit or protect against loss in a declining market. The risk of loss in trading commodities and futures can be substantial. You should therefore carefully consider whether such trading is suitable for you in light of your financial condition. The high degree of leverage that is often obtainable in commodity trading can work against you as well as for you. The use of leverage can lead to large losses as well as gains. Changes in market conditions or a company’s financial condition may impact a company’s ability to continue to pay dividends, and companies may also choose to discontinue dividend payments.
All investments involve risk, including loss of principal, and there is no guarantee that investment objectives will be met. It is important to review your investment objectives, risk tolerance, and liquidity needs before choosing an investment style or manager. Equity investments are subject generally to market, market sector, market liquidity, issuer, and investment style risks, among other factors to varying degrees. Fixed Income investments are subject to market, market liquidity, issuer, investment style, interest rate, credit quality, and call risks, among other factors to varying degrees.
Beta is a measure of the volatility, or systematic risk, of a security or a portfolio relative to the market as a whole. A beta of one is considered as risky as the benchmark and is therefore likely to provide expected returns approximate to those of the benchmark during both up and down periods. A portfolio with a beta of two would move approximately twice as much as the benchmark.
Standard deviation is a measure of the volatility of a security’s or portfolio’s returns in relation to the mean return. The larger the standard deviation, the greater the volatility of return in relation to the mean return.
Changes in market conditions or a company’s financial condition may impact a company’s ability to continue to pay dividends, and companies may also choose to discontinue dividend payments
This commentary often expresses opinions about the direction of market, investment sector, and other trends. The opinions should not be considered predictions of future results. The information contained in this report is based on sources believed to be reliable, but is not guaranteed and not necessarily complete.
The securities discussed in this material were selected due to recent changes in the strategies. This selection criterion is not based on any measurement of performance of the underlying security.
Washington Crossing Advisors, LLC is a wholly-owned subsidiary and affiliated SEC Registered Investment Adviser of Stifel Financial Corp (NYSE: SF). Registration with the SEC implies no level of sophistication in investment management.