Breaking Down the Economic Scene: How Deficits Impact Your Portfolio
Imagine this: The U.S. economy had a stellar year last year, outperforming Europe with a robust 2.5% growth rate. This is a far better performance than almost anyone imagined. It was better than most economists, pundits, and forecasters thought possible a year ago. Yet, not only did the economy grow far better than expected, but investors got hooked on risk again. Novel AI technologies captured investor imaginations, leading the tech-heavy Nasdaq Composite Index to trade at a near-record 60% premium to the S&P 500 based on enterprise-value to cash flow multiples (Nasdaq now trades at 24.3x versus S&P 500 at 15.2x).
However, what’s hidden beneath these impressive numbers is a question that’s been on everyone’s minds lately – did this economic success come at the expense of ballooning deficits? This week, we’re diving deep into the world of deficits to uncover what it all means for your investment portfolio.
Soaring Deficits (And Debt)
Government deficits have been on a wild ride since the pandemic hit. In the five years before COVID-19, the deficit averaged just 3.5% of the economy’s size. But in the four years since the pandemic, that number skyrocketed to an eye-popping 9.7%, with 2023 still ringing in at nearly 6%. Tax revenues did increase (from 16.2% in 2019 to 18.2% in 2023), but spending surged even more (from 21% in 2019 to 24.2% in 2023).
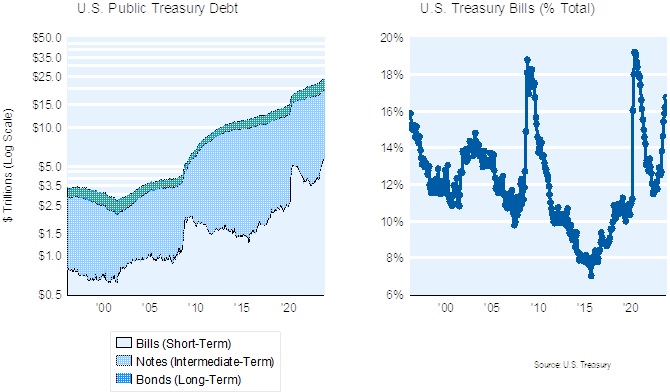
To fund these deficits, the U.S. had to borrow a jaw-dropping $11 trillion. Helpfully, the Federal Reserve (Fed) stepped up and bought a whopping $3.5 trillion (net) of that debt between 2020-2023. The public stepped up for the rest, shelling out $7.5 trillion. Fast forward to today, and the U.S. federal debt is now $34 trillion, 47% higher than pre-pandemic levels (chart, above-left). Over the last four years, the U.S. government borrowed almost $3 trillion annually to keep the deficit train chugging.
But here’s where it gets tricky. Servicing that debt is no walk in the park anymore. Interest rates aren’t near zero anymore, and the Fed isn’t inclined to buy more bonds soon. In 2023, interest expenses on the debt soared to a staggering $883 billion, gobbling up 3.4% of GDP. That’s pretty much the entire deficit that existed in the five years leading up to the pandemic (which was only 3.5%).
And the Treasury is in a tight spot, too. They found that long-term interest rates could spike without the Fed buying the mountain of bonds they issue. This is what happened last fall when 10-year Treasury rates hit 5%. A fix was for the Treasury to issue more short-term T-Bills (fast approaching 18% of debt), but this strategy is now pushing the government’s funding into the precarious position of too much exposure to potentially volatile short-term rates (chart, above right). So, we imagine future issuance will evolve toward longer-dated bonds, potentially throwing a wet blanket on the “return to low rate” scenario.
Unfortunately we’re not done yet. The trade deficit, that thorny issue that never seems to go away, is still very much in the picture. In 2023, it stood at nearly 3% of GDP, a hefty $217 billion. Sure, it’s less than the deficits we saw in 2022 and 2021, but it’s still there, despite all the efforts to kickstart a U.S. “manufacturing renaissance.”
A Trip Down Memory Lane
Now, let’s rewind the clock to a different era. Back in the 1980s, the concept of running continuous fiscal and trade deficits was relatively new. Economists created a new term, the “twin deficit,” to describe the situation of persistent fiscal and trade deficits. The term was made up because as recently as the 1960s, there was no significant “twin” deficit to be found. Why? That was the era of the Bretton Woods system, a time when most countries pegged their exchange rates to the U.S. dollar, and the dollar was convertible to gold. The system acted like an automatic financial pressure release valve that kept trade imbalances in check.
Moreover, the 1960s and 1970s were a period of more conservative government finances. Policymakers played it safe when it came to running large deficits, and there was a strong bipartisan agreement on the importance of fiscal responsibility. Fast forward to today, and things look a bit different. Ideological shifts and demographic changes have nudged spending priorities, and tax initiatives aren’t at all easy to sell to the American public as a way to pay for vast amounts of spending.
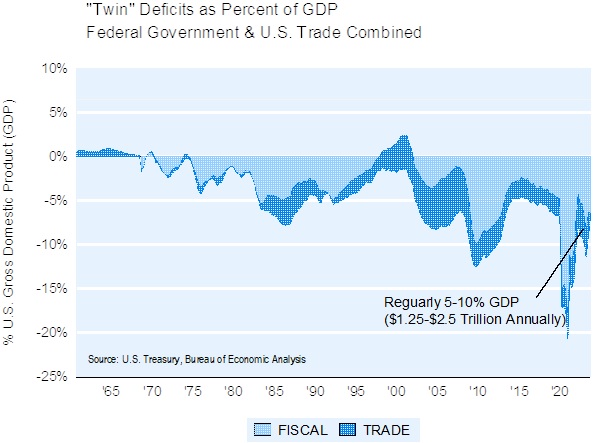
The chart below shows today’s “twin deficit.” Recently, the “twin deficit” has been running between a whopping 5-10% of GDP ($1.5 to $2.5 trillion year after year for several years now).
The Modern Twist on Deficits
Despite fears about ballooning federal debt, some economists argue that deficits aren’t all doom and gloom. After all, one party’s deficit can be another’s surplus. In other words, if the government and foreign sectors run deficits, the private sector can accumulate surpluses. A “twin deficit,” where both the government and foreign sectors are running big deficits, means the private domestic households and industry can receive big surpluses (savings and profits).
But, and there’s always a but, this process can also sow the seeds of financial instability. Overconfidence can lead to reckless borrowing, and depending on speculative gains, can make the system vulnerable to shocks. It’s a bit like walking a tightrope, where the wrong move could spell trouble (i.e., Hyman Minsy’s Financial Instability Hypothesis).
Navigating the Deficit Maze
So, what does all this mean for your portfolio? Well, it’s a mix of opportunities and risks. On the one hand, government and foreign deficits can be seen as surpluses to the private sector. For investors, that means potential opportunities to capitalize on these deficits by investing in businesses that benefit from an expanding economy. However, the road is not without its bumps, as deficits also carry the risk of financial instability.
So, here’s our game plan: we’re putting the spotlight on quality. Companies that are resilient, adaptable, and predictable are the building blocks of WCA equity portfolios. They have low debt, profitable assets, and steady businesses, which can help weather unexpected twists and turns in the financial world.
At Washington Crossing Advisors, our strategy revolves around these quality companies. We aim to build portfolios that not only deliver positive returns but also offer protection against the unexpected. So, while the U.S. economy appears to be on the rise, we’re keeping our focus on quality to ensure our portfolios stand the test of time.