Basic Math
Imagine two stock investments. We will call them Exciting Company and Boring Company. Exciting Company has lots of new and exciting prospects but faces lots of uncertainties. By contrast, Boring Company is a steady operator with some growth, but more is certain.
| Year | Exciting Company | Boring Company |
|---|---|---|
| Year 1 | +50% | +10% |
| Year 2 | -50% | -10% |
| Year 3 | +50% | +10% |
| Year 4 | -50% | -10% |
| Year 5 | +50% | +10% |
| Year 6 | -50% | -10% |
| Year 7 | +50% | +10% |
| Year 8 | -50% | -10% |
| Year 9 | +50% | +10% |
| Year 10 | -50% | -10% |
| ====== | ====== | |
| Average: | 0% | 0% |
Exciting Company: There were five years of 50% positive returns and five years of 50% negative returns. The average annual return was 0%, calculated by adding each return and dividing the sum by 10.
Boring Company: Five years of 10% positive returns and 10% negative annual returns. By the same math above, the average annual return was also 0%.
Not So Fast!
This is not how investing math works, unfortunately. A return of 50% in year one, followed by a 50% loss in year two, does not leave you back where you started — a zero return. If you start with $1 and it grows by 50% to $1.50 but then falls by 50%, you end up with $0.75, a 25% decline. If you start with $1.00 and it grows by 10% to $1.10 and then falls by 10% from that high-water mark, you end up with $0.99, a 1% decline.
Investing Math & The Power of Compounding
An average return over time in investing is not a simple average. It is actually equal to the average return minus the variability of the returns. Now, it is not essential to know the formula for a math test. Still, it is vital to appreciate how volatility can drag on returns. Over time, this volatility drag can be costly. In the example above, a 10-year investment in Exciting Company became worth $0.24 while the same investment in Boring Company turned into $0.99. The only difference between the two investments was volatility, not the size of returns.
The value of avoiding significant losses cannot be overestimated. The magnitude of gains required to offset losses is a textbook example of the power of compounding. As losses increase, the subsequent gain necessary to recover your losses increases exponentially. The underlying message is that the secret to wealth accumulation is not to simply generate returns but to generate consistent returns.
A Plan for Tough Markets
While some market risk is inevitable, other risks can be mitigated, at least to some extent. Specifically, we find that focusing on quality and price can go a long way to address such risk. The graphs below show how focusing on high-quality and low valuations can pay off, especially during challenging markets.
Valuations Are Important
Chart A shows how attention to valuation helped during the 2000-2002 bear market. In the years that led up to that debacle, technology stocks soared in value, far outpacing growth in sales and earnings. As prices soared, the S&P 500, a market capitalization-weighted index, became more and more exposed to very highly valued stocks. Left behind were less glamorous stocks with lower valuations. In this context, we define lower valuation companies as those stocks in 1999 that occupied the lower one-fifth of a listing of U.S. stocks ranked by their enterprise value to sales ratio (EV/Sales). The EV/Sales ratio is a standard valuation metric that compares the total value of a company’s stock, plus any net debt, to underlying sales.
Chart A
Low Valuation Company Returns vs. S&P 500
(2000-2002 Tech Bust)

What happened after the tech bubble burst? The S&P 500 fell by 40%, while the lowest 20% of companies by valuation generated a small positive return from 2000-2002.
Quality is Even More Important
During a challenging market, owning stocks that swing more than the market can spell trouble. But what makes one stock more volatile than another? We have found a strong connection between fundamental quality and the relative risk of a stock price (Chart B, below). Risk is measured by “beta,” which measures the degree to which a stock tends to swing with the market. Riskier stocks have a high “beta,” and less risky stocks have a low “beta.”
By “quality,” we are getting at the ideas of fundamental flexibility, predictability, and durability. We looked at the largest 1,000 domestic companies from 1999 to today and divided the market into quality “grades.” The criteria centered on debt levels, consistency of operations, and profitability of assets. The chart below shows that “A”-Quality companies (high quality) are far less risky than “F”-Quality companies.
As you can see, the lower debt, more consistent, more profitable “A-Quality” companies had a far lower risk (“beta”). By contrast, “F-Quality” companies with more debt, less consistent operations, and less profitability had much more significant risk (“beta”). This pattern holds true during bull and bear markets. Still, it proves especially valuable when low-quality beta unexpectedly rises during bear markets.
Note the following about the chart below:
- As quality deteriorates, the absolute level of risk (“beta”) rises in both bull and bear markets;
- The bigger the erosion in quality, the bigger the gap between bull and bear market risk (“beta”);
Thus, we observe that price increases in bull markets tend to be smaller in magnitude than price declines in bear markets. This “asymmetry” is more pronounced for low quality companies than high quality. Investors who look to avoid surprises, especially negative ones, should therefore carefully consider the fundamental quality of investments.
Chart B
Risk (Beta) by WCA Quality Score (2000-2020)

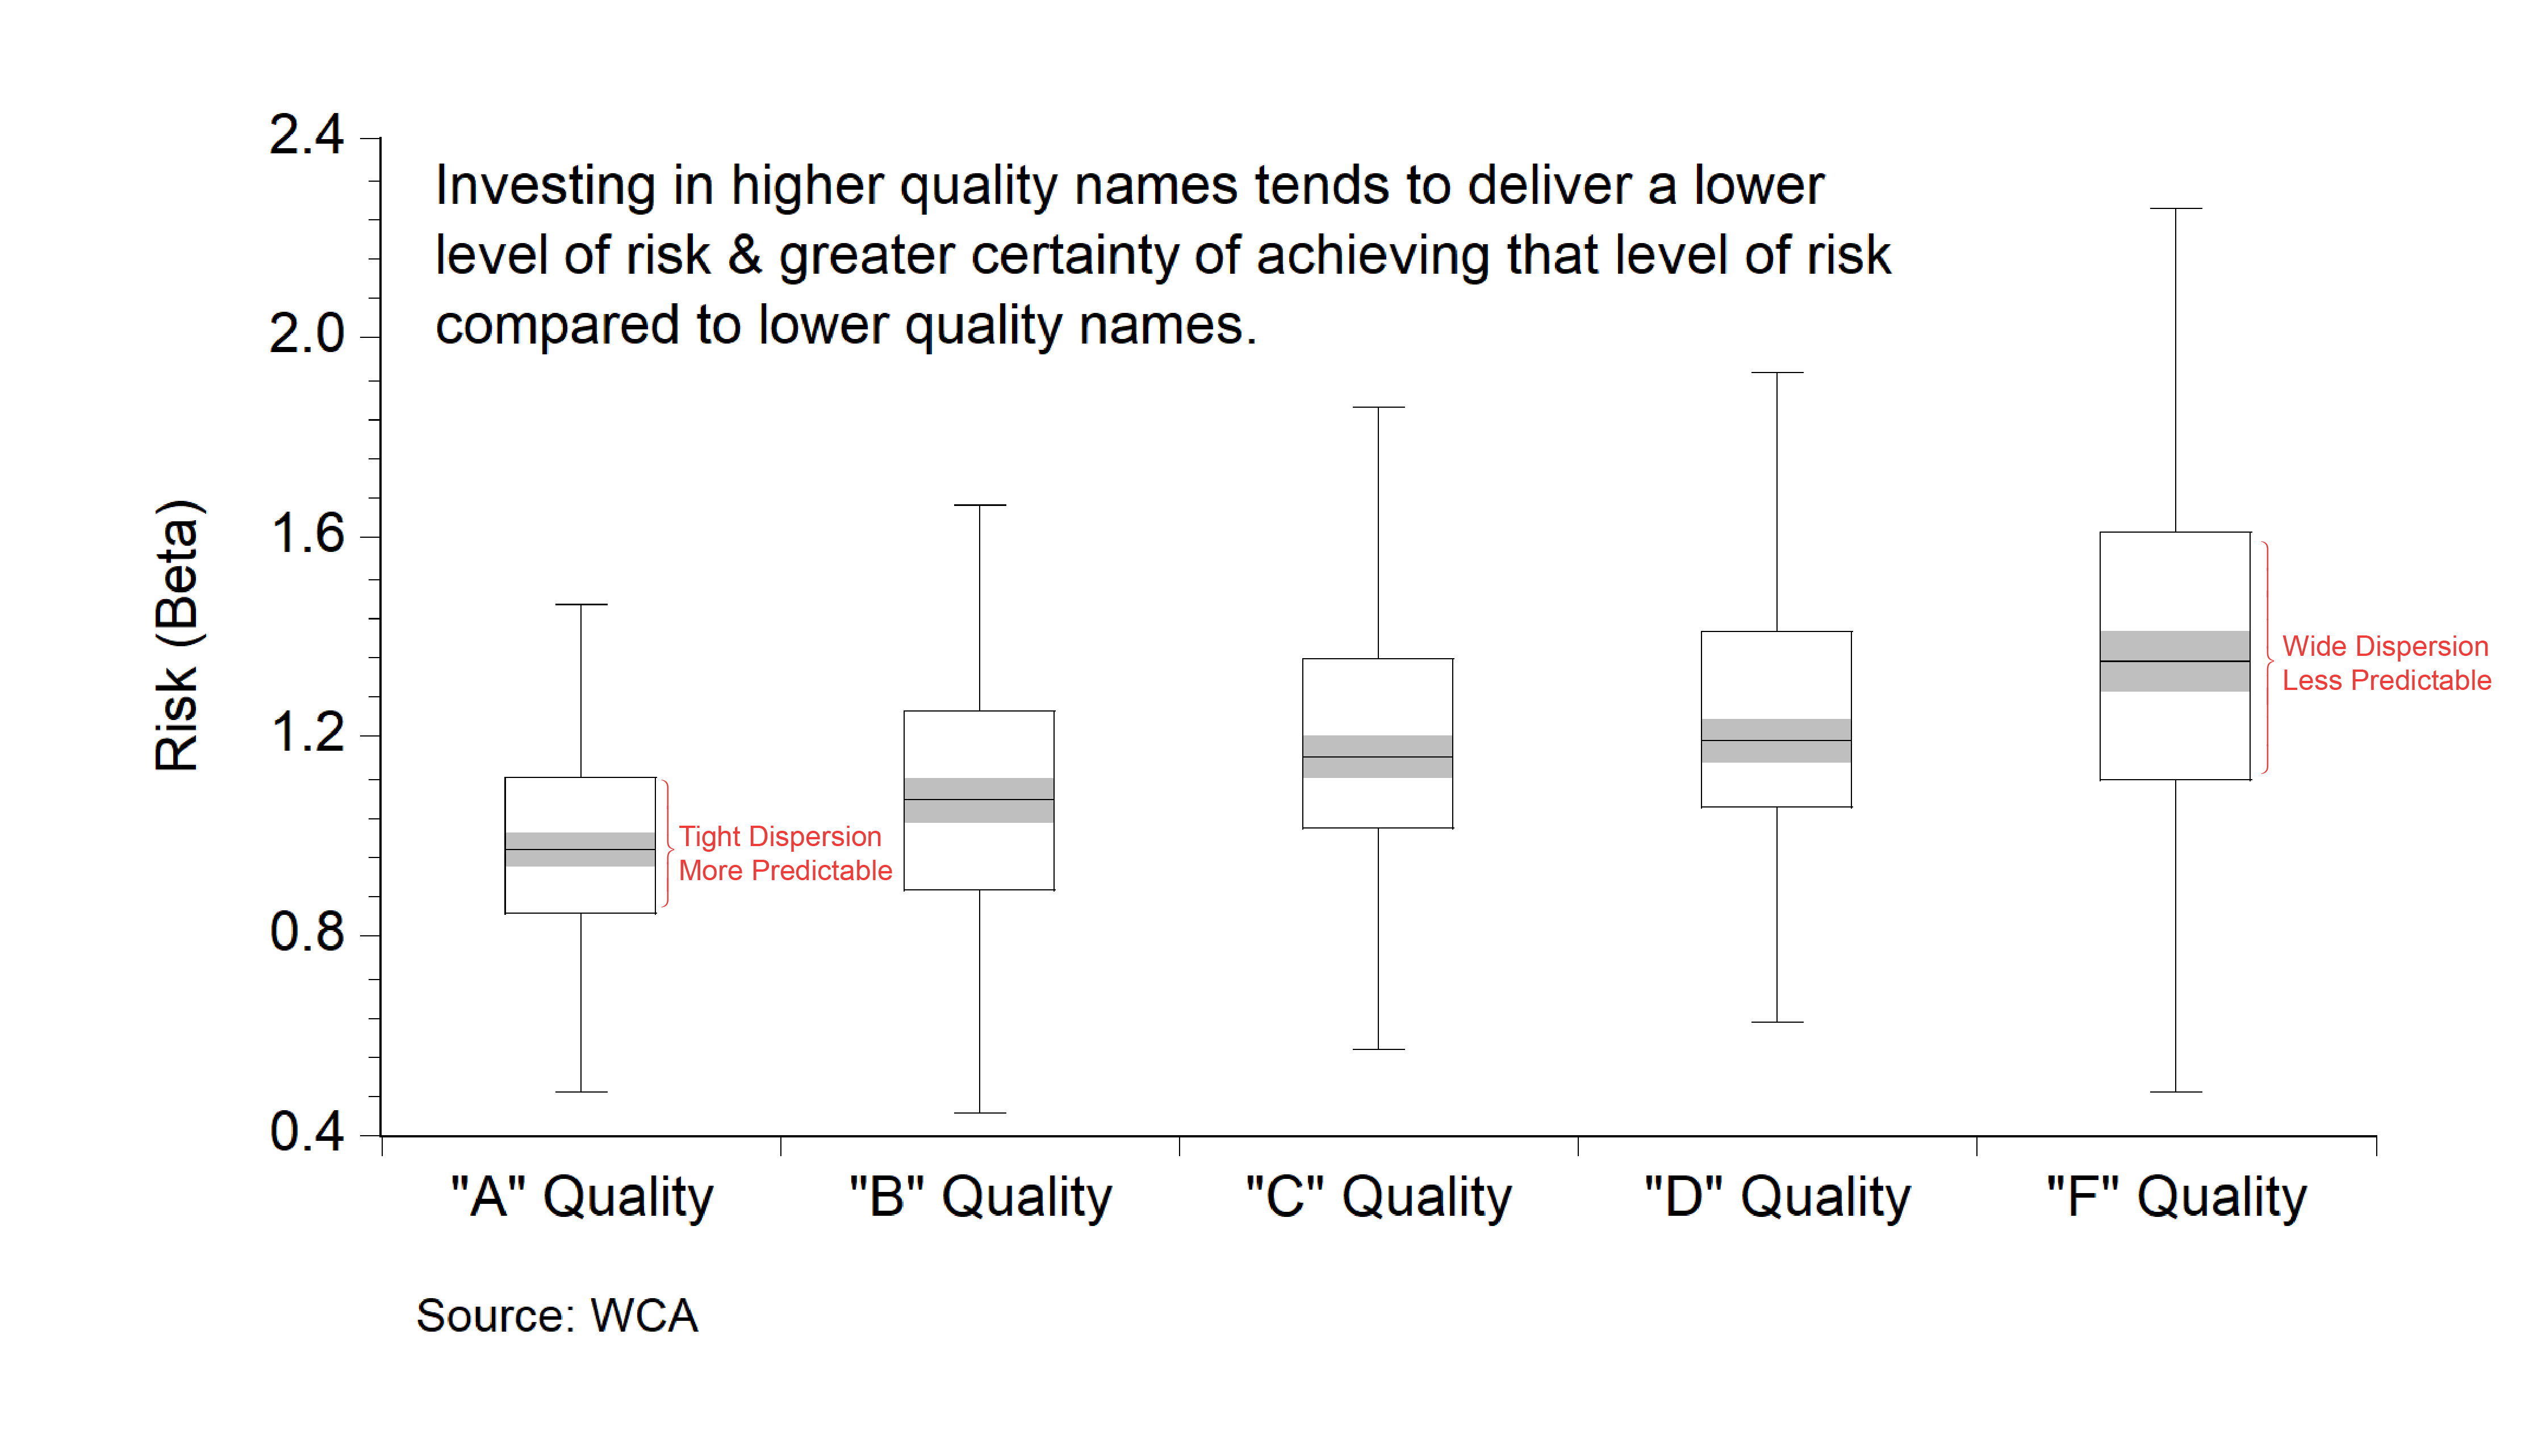
One last important point about quality has to do with the range of uncertainty surrounding risk (“beta”). Chart C below clearly shows how the level of risk varies among companies within each quality group. “A” quality companies tend to not only be lower risk, but more consistently so. By contrast, “F” quality companies not only tend to have a higher degree of risk, but also offer much less consistency around that higher level of risk. The combination of higher risk and less consistency and predictability have the potential to raise portfolio volatility which, as we said before, can significantly harm wealth accumulation over time.
Chart C
Dispersion of Risk Across Quality Categories
In Summary
Investing is not just about creating high returns but consistent returns. Therefore, we must contemplate how to address risk well in advance of demanding markets. For us, a fundamental approach emphasizing quality at a reasonable price offers a sound answer to this most difficult question.
As we continue to enjoy a bull market that has driven stock values to record highs, we think it makes sense to focus now on these essential investing basics.
Disclosures:
WCA Barometer – We regularly assess changes in fundamental conditions to help guide near-term asset allocation decisions. Analysis incorporates approximately 30 forward-looking indicators in categories ranging from Credit and Capital Markets to U.S. Economic Conditions and Foreign Conditions. From each category of data, we create three diffusion-style sub-indices that measure the trends in the underlying data. Sustained improvement that is spread across a wide variety of observations will produce index readings above 50 (potentially favoring stocks), while readings below 50 would indicate potential deterioration (potentially favoring bonds). The WCA Fundamental Conditions Index combines the three underlying categories into a single summary measure. This measure can be thought of as a “barometer” for changes in fundamental conditions.
Standard & Poor’s 500 Index (S&P 500) is a capitalization-weighted index that is generally considered representative of the U.S. large capitalization market.
S&P Global (SPGI) is a leading American provider of financial information, analytics, and credit ratings, headquartered in New York, NY. It operates major divisions including S&P Global Ratings, S&P Global Market Intelligence, S&P Global Commodity Insights, S&P Global Mobility, and S&P Dow Jones Indices.
The ICE BofA U.S. High Yield Index is an unmanaged index that tracks the performance of U.S. dollar denominated, below investment-grade rated corporate debt publicly issued in the U.S. domestic market.
The S&P 500 Growth measures constituents from the S&P 500 that are classified as growth stocks based on three factors: sales growth, the ratio of earnings change to price, and momentum.
The S&P 500 Value Index measures constituents from the S&P 500 that are classified as value stocks based on three factors: the ratios of book value, earnings and sales to price.
The S&P 500 Equal Weight Index is the equal-weight version of the widely regarded Standard & Poor’s 500 Index, which is generally considered representative of the U.S. large capitalization market. The index has the same constituents as the capitalization-weighted S&P 500, but each company in the index is allocated a fixed weight of 0.20% at each quarterly rebalancing.
The WCA Rising Dividend Custom Benchmark is a rules-based benchmark constructed by Washington Crossing Advisors to represent a universe of large capitalization U.S. companies that meet certain quality and dividend growth criteria, including proprietary screens for profitability, earnings consistency, and balance sheet strength, along with minimum market capitalization and dividend growth requirements. The benchmark is reconstituted and rebalanced quarterly and is intended to serve as a style-appropriate benchmark for the WCA Rising Dividend strategy.
The Washington Crossing Advisors’ High Quality Index and Low Quality Index are objective, quantitative measures designed to identify quality in the top 1,000 U.S. companies. Ranked by fundamental factors, WCA grades companies from “A” (top quintile) to “F” (bottom quintile). Factors include debt relative to equity, asset profitability, and consistency in performance. Companies with lower debt, higher profitability, and greater consistency earn higher grades. These indices are reconstituted annually and rebalanced daily. For informational purposes only, and WCA Quality Grade indices do not reflect the performance of any WCA investment strategy.
The risk of loss in trading commodities and futures can be substantial. You should therefore carefully consider whether such trading is suitable for you in light of your financial condition. The high degree of leverage that is often obtainable in commodity trading can work against you as well as for you. The use of leverage can lead to large losses as well as gains.
The information contained herein has been prepared from sources believed to be reliable but is not guaranteed by us and is not a complete summary or statement of all available data, nor is it considered an offer to buy or sell any securities referred to herein. Opinions expressed are subject to change without notice and do not take into account the particular investment objectives, financial situation, or needs of individual investors. There is no guarantee that the figures or opinions forecast in this report will be realized or achieved. Employees of Stifel, Nicolaus & Company, Incorporated or its affiliates may, at times, release written or oral commentary, technical analysis, or trading strategies that differ from the opinions expressed within. Past performance is no guarantee of future results. Indices are unmanaged, and you cannot invest directly in an index.
Asset allocation and diversification do not ensure a profit and may not protect against loss. There are special considerations associated with international investing, including the risk of currency fluctuations and political and economic events. Changes in market conditions or a company’s financial condition may impact a company’s ability to continue to pay dividends, and companies may also choose to discontinue dividend payments. Investing in emerging markets may involve greater risk and volatility than investing in more developed countries. Due to their narrow focus, sector-based investments typically exhibit greater volatility. Small-company stocks are typically more volatile and carry additional risks since smaller companies generally are not as well established as larger companies. Property values can fall due to environmental, economic, or other reasons, and changes in interest rates can negatively impact the performance of real estate companies. When investing in bonds, it is important to note that as interest rates rise, bond prices will fall. High-yield bonds have greater credit risk than higher-quality bonds. Bond laddering does not assure a profit or protect against loss in a declining market. The risk of loss in trading commodities and futures can be substantial. You should therefore carefully consider whether such trading is suitable for you in light of your financial condition. The high degree of leverage that is often obtainable in commodity trading can work against you as well as for you. The use of leverage can lead to large losses as well as gains. Changes in market conditions or a company’s financial condition may impact a company’s ability to continue to pay dividends, and companies may also choose to discontinue dividend payments.
All investments involve risk, including loss of principal, and there is no guarantee that investment objectives will be met. It is important to review your investment objectives, risk tolerance, and liquidity needs before choosing an investment style or manager. Equity investments are subject generally to market, market sector, market liquidity, issuer, and investment style risks, among other factors to varying degrees. Fixed Income investments are subject to market, market liquidity, issuer, investment style, interest rate, credit quality, and call risks, among other factors to varying degrees.
Beta is a measure of the volatility, or systematic risk, of a security or a portfolio relative to the market as a whole. A beta of one is considered as risky as the benchmark and is therefore likely to provide expected returns approximate to those of the benchmark during both up and down periods. A portfolio with a beta of two would move approximately twice as much as the benchmark.
Standard deviation is a measure of the volatility of a security’s or portfolio’s returns in relation to the mean return. The larger the standard deviation, the greater the volatility of return in relation to the mean return.
Changes in market conditions or a company’s financial condition may impact a company’s ability to continue to pay dividends, and companies may also choose to discontinue dividend payments
This commentary often expresses opinions about the direction of market, investment sector, and other trends. The opinions should not be considered predictions of future results. The information contained in this report is based on sources believed to be reliable, but is not guaranteed and not necessarily complete.
The securities discussed in this material were selected due to recent changes in the strategies. This selection criterion is not based on any measurement of performance of the underlying security.
Washington Crossing Advisors, LLC is a wholly-owned subsidiary and affiliated SEC Registered Investment Adviser of Stifel Financial Corp (NYSE: SF). Registration with the SEC implies no level of sophistication in investment management.


