An Appropriate Benchmark for Quality Investing
The investment industry often frames success as beating the S&P 500 or one of its style indices such as Value or Growth. However, most financial advisors and their clients are not trying to beat an index; they are trying to grow their wealth, generate income, and avoid large losses. Those are very different objectives, and they require a different way of thinking about benchmarks and portfolio construction.
It has been our experience that most advisors and investors we work with ask for a seemingly simple thing which is to “make money and try not to lose it.” Somehow, this simple idea gets translated into “beat the market” or “beat the S&P 500” or something else similar. However, none of these indices are designed with the original mission in mind, especially when it comes to the “try not to lose it” part because there is no plan for how to mitigate risk in any of the popular benchmark indices.
Not A Strategy
The popular benchmarks may be measurement tools, but they are not investment strategies. Our industry has unintentionally turned them into goals, but they should not be. Indices like the S&P 500 do not manage risk, they do not care about valuations, debt, profitability, they do not make any attempt to avoid losses. They just own companies in proportion to their size. So, if someone says to us “I am just looking to make money and try not to lose it”, the benchmarks miss the point entirely.
A New Way: A Benchmark Aligned With Our Strategy
We think there’s a better way with a guidepost leading us to where you want to go in the way you want to get there. We want to make sure that quality is central to the strategy because we have found quality helps provide both an attractive offense and defense. The offense comes from the growth that tends to follow profits of companies bought at reasonable prices. The defense comes from the durability and flexibility that is afforded by low debt and predictable businesses.
For us the question then becomes, how do we demonstrate that we are focused on these types of quality companies? The answer is to design a benchmark that encompasses the same universe from which we draw quality investments, that has the same underlying selection philosophy, and is investable, rules based, and weighted consistent with our process.
To ensure our custom yardstick meets institutional standards, we adhere to the SAMURAI* criteria:
• Specified in Advance: Employed from the start
• Accountable: Reflects the manager’s investing style
• Measurable: Easy to calculate on a regular basis
• Unambiguous: Clearly defined and rules based (see WCA Quality universe construction on following page)
• Reflective: Reflects the actual investing process
• Appropriate: Style-matched to the mandate
• Investable: Historically replicable with disciplined execution
*J.V. Bailey and D.E. Tierney, “Controlling Misfit Risk in Multiple-Manager Investment Programs,” The Research Foundation of The Institute of Chartered Financial Analysts, March 1998
At WCA, we find the most important overlooked feature of investing is quality. To prove the point, bond investors do this automatically, so why not equity investors?
We believe that an effective investment strategy needs to embrace a defense while protecting a growing stream of income against the backdrop of seeking to maximize risk-adjusted return. Since traditional benchmark indices do not offer an investment strategy, much less risk management, we must design one that does. We start with what we believe is the most important investment attribute, i.e., quality.
How We Define Quality
We believe that Quality should hold up better in down markets, provide more consistent results over time, provide room for growth, and should be less exposed to extreme negative events. This is what we find that most investors really want. This is why we build our own benchmark and manage to it.
WCA defines a High-Quality firm through a proprietary algorithm focused on three non-negotiable pillars:
• Profitability: We prioritize firms with high asset utilization and strong operational efficiency.
• Historically Predictable Cash Flows: We seek companies with reliable cash generation that support sustainable capital allocation.
• Low Debt (Financial Flexibility): We explicitly penalize excessive leverage. As seen in the 2008 financial crisis, indices often reward highly leveraged firms right up until the point of collapse. We believe strong balance sheets are the ultimate defense in volatile markets.
We find the benefits of building a custom benchmark to be (1) it does a better job of improving risk-adjusted return, (2) it provides a cushion in down markets, (3) it facilitates the production of a steady stream of cash flow and (4) it minimizes drawdown.
WCA constructs its quality universe (and therefore its custom benchmark) in the following sequence:
- Start with a universe of the 1000 largest domestic companies
- Create equal sized buckets of companies by quality grade (A, B, C, D and F with A being of the highest quality) based on our combined rankings of profitability, predictability, and leverage. We then limit exposure to only A or B graded companies.
- Remove all companies with market capitalization below $20 billion
- Exclude all companies that fail to produce rising dividends for the previous five years
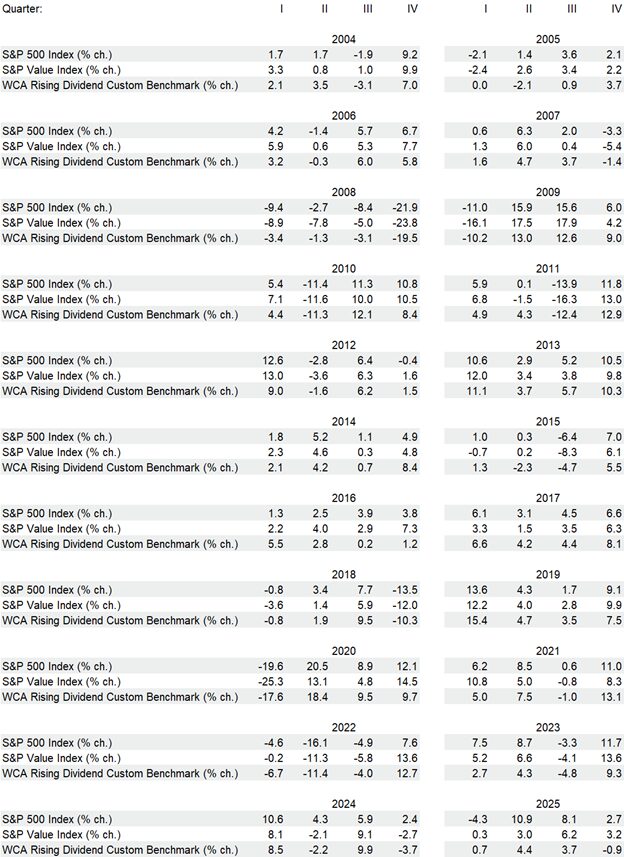
The above process produces a high-quality selection universe (and custom benchmark) of about 100-120 names. Critically, WCA invests in only the highest quality names, i.e., A and B as shown in the following bar charts. The quarterly returns of the WCA Rising Dividend Custom Benchmarks are shown alongside S&P 500 and S&P Value index returns in Appendix A below.
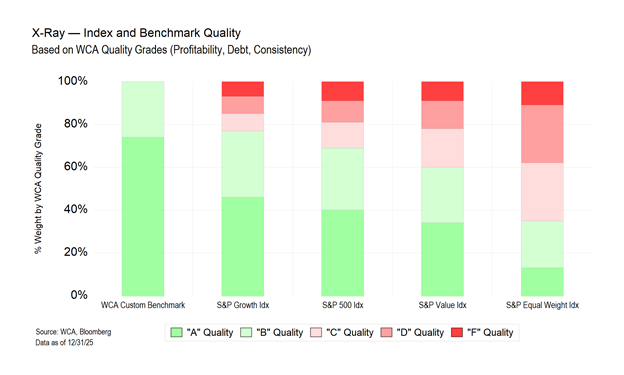
Towards a High-Quality Only Benchmark
The chart below provides an “X-ray” of several popular indices compared to our custom benchmark using our internal quality grading system. What becomes immediately clear is that our custom benchmark is structurally very different from traditional indices. While major indices hold a significant percentage of lower quality companies, our benchmark is heavily concentrated in A and B quality businesses. This difference is intentional and reflects our belief that long-term investment success is driven by owning profitable companies with predictable cash flows and strong balance sheets.
Measuring Skill, Not Style
By managing portfolios relative to a quality-based benchmark rather than a broad market index, we believe that we can better determine whether value is being added through security selection and portfolio construction rather than simply benefiting from the usual style exposure. In other words, the benchmark helps allow us to measure our investment process more accurately.
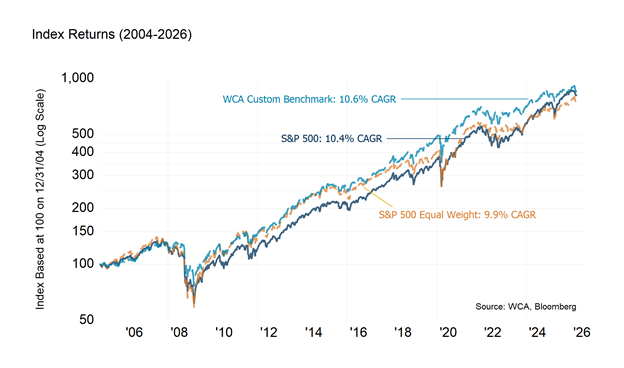
Quality Does Not Mean Lower Returns
The chart below compares the long-term performance of our custom benchmark to the S&P 500 and the S&P Equal Weight Index since 2004. Despite being constructed from higher quality companies with stronger balance sheets and more predictable earnings, the custom benchmark has delivered returns comparable to, and slightly better than, the broader market over time. In our view, this demonstrates that, over time, it has been possible for an index of high quality dividend growers to deliver attractive returns without incurring unnecessary risk.
When High Quality Lags (The “Junk Rally”)
What if we get it wrong by designing a custom benchmark that fails to keep pace with the S&P 500? After all, there have been times when that happens, e.g., speculative bull markets or the early stages of recovery from a crisis. Key periods of quality underperformance include:
The Dot-Com Bubble (Late 1990s – March 2000): During the peak of the technology bubble, speculative growth stocks with little or no earnings skyrocketed, while high-quality, profitable companies were often ignored by the market.
• Post-Global Financial Crisis Recovery (2009–2010): High-quality stocks underperformed significantly during the “junk rally” that followed the 2008 crash. As risk tolerance returned, the most distressed and “low-quality” companies saw the sharpest rebounds, leaving stable, high-quality firms behind.
• The COVID-19 Recovery (2020–2021): Similar to 2009, the massive stimulus and “reopening” trade in late 2020 and 2021 favored high-beta and speculative stocks over defensive, high-quality names.
• Post Rate Rise “Low-Quality” Rally (2023-2025): More recently, unprofitable and small-cap stocks outperformed high-quality ones after suffering steep losses in 2022 as the Federal Reserve raised interest rates in 2022. Eighty five percent of the S&P 500’s return between early 2023 and 2025 came from above average risk and low quality stocks.
High-quality strategies tend to struggle in two specific environments:
1. Extreme Risk-On Regimes: When investor sentiment is highly speculative, the market prioritizes rapid growth or “moonshot” potential over steady profitability.
2. Early Cycle Recoveries: When the economy first emerges from a recession, “low-quality” stocks (those with high debt or cyclical earnings) often surge more because they were the most beaten down during the preceding crash.
High quality tends to underperform during these periods because recovery phases are defined by high-risk tolerance and broad-based market improvement, which favors more volatile assets. We find that markets follow cycles whereby leadership can alternate between low and high quality. Over time, however, we have found superior risk adjusted returns among the high-quality group (see WCA Commentary: “Quality Under Pressure, Patience Required“)
When Quality Shines
Nevertheless, we believe that quality is still the right strategy to provide both an effective offense and defense. As noted by legendary Alabama football coach Paul “Bear” Bryant “offense sells tickets, but defense wins championships.” Over time, quality has done its job by delivering (1) solid results, (2) steady increases in income, (3) superior performance in challenging markets and (4) defense when it really matters.
We believe we have successfully demonstrated that building a purpose-built guidepost (a quality-based custom benchmark) is a better way to assess the value added of our investment portfolio construction and risk management process than relying on standard off-the-shelf indices.
Conclusion: The Right Way to Evaluate a Quality Strategy
Investing without a style-appropriate benchmark is like judging a marathon runner against a sprinter. The S&P 500 is not wrong necessarily — it is just not designed for what most investors are actually are trying to accomplish — to try and make money while also attempting to hold on to the wealth already created. And to do this, a strategy and a benchmark must think equally about risk and return.
So instead of chasing an index, we built a benchmark that reflects the way we invest and aims to deliver the long-run outcomes most advisors and their clients are actually looking to achieve.
This is a more appropriate way to evaluate our strategy.
Appendix A – Index Return Table
Kevin R. Caron, CFA
Senior Portfolio Manager
973-549-4051
Chad Morganlander
Senior Portfolio Manager
973-549-4052
Steve Lerit, CFA
Head of Portfolio Risk
973-549-4028
Eric Needham
External Sales and Marketing
312-771-6010
Matthew Battipaglia
Portfolio Manager
973-549-4047
Jeffrey Battipaglia
Client Portfolio Manager
973-549-4031
Suzanne Ashley
Internal Relationship Manager
973-549-4168
Disclosures:
WCA Barometer – We regularly assess changes in fundamental conditions to help guide near-term asset allocation decisions. Analysis incorporates approximately 30 forward-looking indicators in categories ranging from Credit and Capital Markets to U.S. Economic Conditions and Foreign Conditions. From each category of data, we create three diffusion-style sub-indices that measure the trends in the underlying data. Sustained improvement that is spread across a wide variety of observations will produce index readings above 50 (potentially favoring stocks), while readings below 50 would indicate potential deterioration (potentially favoring bonds). The WCA Fundamental Conditions Index combines the three underlying categories into a single summary measure. This measure can be thought of as a “barometer” for changes in fundamental conditions.
Standard & Poor’s 500 Index (S&P 500) is a capitalization-weighted index that is generally considered representative of the U.S. large capitalization market.
S&P Global (SPGI) is a leading American provider of financial information, analytics, and credit ratings, headquartered in New York, NY. It operates major divisions including S&P Global Ratings, S&P Global Market Intelligence, S&P Global Commodity Insights, S&P Global Mobility, and S&P Dow Jones Indices.
The ICE BofA U.S. High Yield Index is an unmanaged index that tracks the performance of U.S. dollar denominated, below investment-grade rated corporate debt publicly issued in the U.S. domestic market.
The S&P 500 Growth measures constituents from the S&P 500 that are classified as growth stocks based on three factors: sales growth, the ratio of earnings change to price, and momentum.
The S&P 500 Value Index measures constituents from the S&P 500 that are classified as value stocks based on three factors: the ratios of book value, earnings and sales to price.
The S&P 500 Equal Weight Index is the equal-weight version of the widely regarded Standard & Poor’s 500 Index, which is generally considered representative of the U.S. large capitalization market. The index has the same constituents as the capitalization-weighted S&P 500, but each company in the index is allocated a fixed weight of 0.20% at each quarterly rebalancing.
The WCA Rising Dividend Custom Benchmark is a rules-based benchmark constructed by Washington Crossing Advisors to represent a universe of large capitalization U.S. companies that meet certain quality and dividend growth criteria, including proprietary screens for profitability, earnings consistency, and balance sheet strength, along with minimum market capitalization and dividend growth requirements. The benchmark is reconstituted and rebalanced quarterly and is intended to serve as a style-appropriate benchmark for the WCA Rising Dividend strategy.
The Washington Crossing Advisors’ High Quality Index and Low Quality Index are objective, quantitative measures designed to identify quality in the top 1,000 U.S. companies. Ranked by fundamental factors, WCA grades companies from “A” (top quintile) to “F” (bottom quintile). Factors include debt relative to equity, asset profitability, and consistency in performance. Companies with lower debt, higher profitability, and greater consistency earn higher grades. These indices are reconstituted annually and rebalanced daily. For informational purposes only, and WCA Quality Grade indices do not reflect the performance of any WCA investment strategy.
The risk of loss in trading commodities and futures can be substantial. You should therefore carefully consider whether such trading is suitable for you in light of your financial condition. The high degree of leverage that is often obtainable in commodity trading can work against you as well as for you. The use of leverage can lead to large losses as well as gains.
The information contained herein has been prepared from sources believed to be reliable but is not guaranteed by us and is not a complete summary or statement of all available data, nor is it considered an offer to buy or sell any securities referred to herein. Opinions expressed are subject to change without notice and do not take into account the particular investment objectives, financial situation, or needs of individual investors. There is no guarantee that the figures or opinions forecast in this report will be realized or achieved. Employees of Stifel, Nicolaus & Company, Incorporated or its affiliates may, at times, release written or oral commentary, technical analysis, or trading strategies that differ from the opinions expressed within. Past performance is no guarantee of future results. Indices are unmanaged, and you cannot invest directly in an index.
Asset allocation and diversification do not ensure a profit and may not protect against loss. There are special considerations associated with international investing, including the risk of currency fluctuations and political and economic events. Changes in market conditions or a company’s financial condition may impact a company’s ability to continue to pay dividends, and companies may also choose to discontinue dividend payments. Investing in emerging markets may involve greater risk and volatility than investing in more developed countries. Due to their narrow focus, sector-based investments typically exhibit greater volatility. Small-company stocks are typically more volatile and carry additional risks since smaller companies generally are not as well established as larger companies. Property values can fall due to environmental, economic, or other reasons, and changes in interest rates can negatively impact the performance of real estate companies. When investing in bonds, it is important to note that as interest rates rise, bond prices will fall. High-yield bonds have greater credit risk than higher-quality bonds. Bond laddering does not assure a profit or protect against loss in a declining market. The risk of loss in trading commodities and futures can be substantial. You should therefore carefully consider whether such trading is suitable for you in light of your financial condition. The high degree of leverage that is often obtainable in commodity trading can work against you as well as for you. The use of leverage can lead to large losses as well as gains. Changes in market conditions or a company’s financial condition may impact a company’s ability to continue to pay dividends, and companies may also choose to discontinue dividend payments.
All investments involve risk, including loss of principal, and there is no guarantee that investment objectives will be met. It is important to review your investment objectives, risk tolerance, and liquidity needs before choosing an investment style or manager. Equity investments are subject generally to market, market sector, market liquidity, issuer, and investment style risks, among other factors to varying degrees. Fixed Income investments are subject to market, market liquidity, issuer, investment style, interest rate, credit quality, and call risks, among other factors to varying degrees.
Beta is a measure of the volatility, or systematic risk, of a security or a portfolio relative to the market as a whole. A beta of one is considered as risky as the benchmark and is therefore likely to provide expected returns approximate to those of the benchmark during both up and down periods. A portfolio with a beta of two would move approximately twice as much as the benchmark.
Standard deviation is a measure of the volatility of a security’s or portfolio’s returns in relation to the mean return. The larger the standard deviation, the greater the volatility of return in relation to the mean return.
Changes in market conditions or a company’s financial condition may impact a company’s ability to continue to pay dividends, and companies may also choose to discontinue dividend payments
This commentary often expresses opinions about the direction of market, investment sector, and other trends. The opinions should not be considered predictions of future results. The information contained in this report is based on sources believed to be reliable, but is not guaranteed and not necessarily complete.
The securities discussed in this material were selected due to recent changes in the strategies. This selection criterion is not based on any measurement of performance of the underlying security.
Washington Crossing Advisors, LLC is a wholly-owned subsidiary and affiliated SEC Registered Investment Adviser of Stifel Financial Corp (NYSE: SF). Registration with the SEC implies no level of sophistication in investment management.


