A Month’s Time
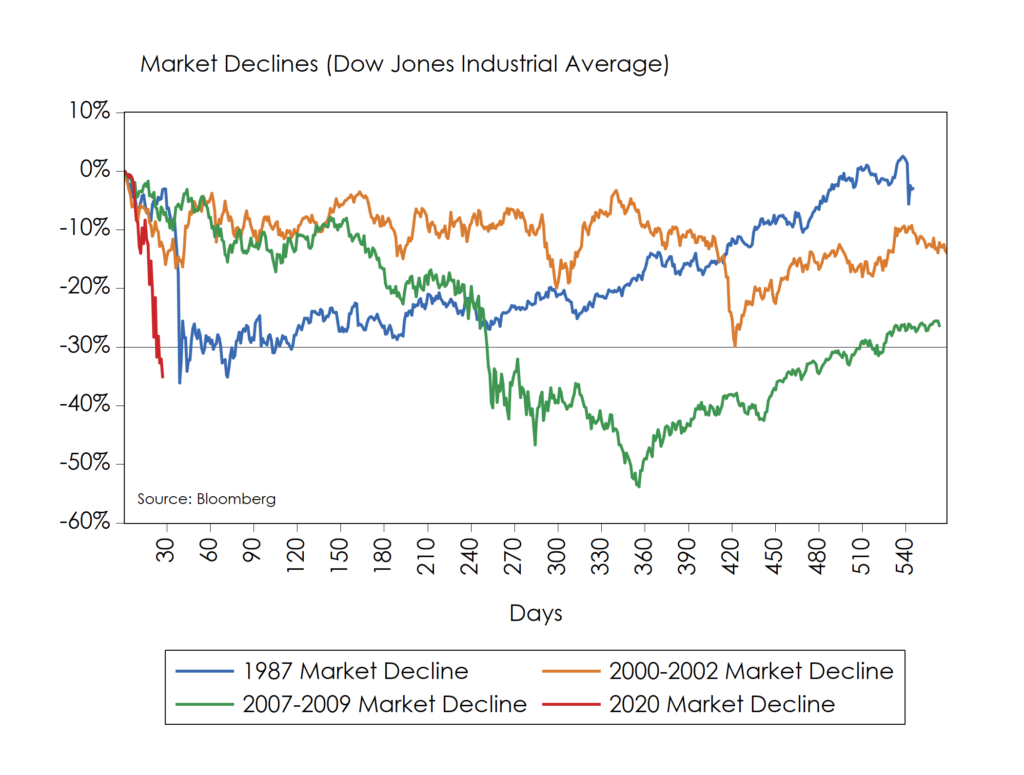
In just a month’s time, the U.S. stock market’s value is back to where it was in late 2018. The speed and intensity of the recent decline is unusual as the United States’ equity markets lost $11 trillion (30%) in just one month. This 30% decline is also reflected in the Dow Jones Industrial Average seen below. The chart shows how this episode compares with past notable declines. In contrast to a month’s time, it took eight months for the Dow to give up 30% during the 2000-2002 market decline and fourteen months for the index to shed that amount in the 2007-2009 financial crisis.
Intensity of ’87
The intensity of the current market dislocation compares better to the October 1987 market drop. That episode saw the Dow Jones Industrial Average drop to 1,738 on October 19, 1987 from a pre-decline peak of 2,722 on August 25, 1987 for a 36% total decline in a little over a month’s time. Of course, the 10-year Treasury rate was near 9% back then, giving policymakers more latitude to implement traditional policy responses.
Unlike the situation in 1987 the cause of today’s situation is different as are available policy tools. Today’s policy response toolkit needs to be more expansive given extremely low interest rates and recent decline in credit market liquidity. We have seen the Federal Reserve turn to asset purchases and an array of direct lending programs designed to support liquidity in credit markets. A range of backstops, guarantees, and fiscal initiatives are also being discussed and are likely on the way. In time, we expect these actions and market dynamics to help restore liquidity to credit markets.
Direction of Causality
Another distinguishing characteristic of this latest crisis is the direction of causality between the economy and markets. Unlike past crises, which often spread from financial markets to the real economy, this one is moving the other way. The Covid-19 virus is a biological and social health-crisis which requires the shutting down of activities that not only drive the spread of the disease but also parts of the economy. When restaurants, health clubs, malls, places of employment, etc. are shut down, incomes are lost. Businesses with significant fixed costs, including interest payments on debt, are potentially most exposed to losses and most at risk of default. Employment is also likely to be significantly impacted in coming weeks especially in front-line occupations like retail and restaurants. This economic process will not take more than a month’s time to show up in the data.
Disruption and Survival
Profits for most firms are going to be disrupted for a while. We maintain, however, that companies going in to this crisis with higher growth, higher profitability, and more efficient investment are better positioned to survive this crisis than those who have lower growth, lower profitability, and less efficient investment. How much debt companies has is also very important. All else equal, the more a company borrowed pre-crisis, the more at risk the company is of not making it through the crisis. While debt can increase a firms return on equity, the addition of debt to a company’s capital structure can also increase fixed interest costs, lower net income by the amount of interest expense, and lower bond ratings. The degree to which the debt is efficiently employed is key in understanding the difference between “good” and “bad” debt. Moreover, the effect of debt should be considered under conditions of worsened business conditions as well as normal conditions. During tough times, it becomes clear that debt shifts risks onto equity investors as it has in just a month’s time.
According to the credit ratings firm Moody’s Investor Services, baseline default rates are moving up. From Moody’s website on March 10: “The global speculative-grade default rate remained unchanged at 3.1% in February. However, we have raised our baseline default rate projection for year-end 2020 to 3.6% from 3.4% based on rising risks to growth, commodity prices and financial markets amid the coronavirus outbreak. Under a more pessimistic scenario, the default rate would go up to 9.7%.” While the 3.7% base case would be below the 20-year average of 3.7%, the 9.7% figure would be consistent with the 2000-2002 and 2007-2009 recessions.
Liquidity and Solvency
It is important to distinguish between liquidity and solvency issues when the economy becomes challenged as it is now. We believe tight liquidity conditions in credit will eventually normalize as markets adjust and policymakers enact supports. Companies with less indebtedness, greater profitability, and stable cash flow should prove more resilient and durable than those with significant debts coming due. As we mentioned last week, more profitable and less leveraged firms have suffered less during this period of stress. Accordingly, we continue to look for opportunities in this difficult period with a continued emphasis on creditworthiness, profitability, and consistency of operating results.
Opportunities can also be created in a month’s time!
S&P 500 — The Standard & Poor’s 500 Index is a capitalization-weighted index that is generally considered representative of the U.S. large capitalization market.
Indices are unmanaged, and it is not possible to invest directly in an index. All benchmark returns presented are provided to represent the investment environment existing during the time periods shown. Actual investment performance will vary due to fees and expenses. For comparison purposes, the benchmarks include the reinvestment of income. The benchmarks are unmanaged and unavailable for direct investment.
The S&P 500 High Beta Index measures the performance of 100 constituents in the S&P 500 that are most sensitive to changes in the market. Constituents are weighted relative to their level of market sensitivity, with each stock assigned a weight proportional to its beta.
The S&P 500 Low Volatility Index measures performance of the 100 least volatile stocks in the S&P 500. The index benchmarks low volatility or low variance strategies for the U.S. stock market. Constituents are weighted relative to the inverse of their corresponding volatility, with the least volatile stocks receiving the highest weights.
Disclosures:
WCA Barometer – We regularly assess changes in fundamental conditions to help guide near-term asset allocation decisions. Analysis incorporates approximately 30 forward-looking indicators in categories ranging from Credit and Capital Markets to U.S. Economic Conditions and Foreign Conditions. From each category of data, we create three diffusion-style sub-indices that measure the trends in the underlying data. Sustained improvement that is spread across a wide variety of observations will produce index readings above 50 (potentially favoring stocks), while readings below 50 would indicate potential deterioration (potentially favoring bonds). The WCA Fundamental Conditions Index combines the three underlying categories into a single summary measure. This measure can be thought of as a “barometer” for changes in fundamental conditions.
Standard & Poor’s 500 Index (S&P 500) is a capitalization-weighted index that is generally considered representative of the U.S. large capitalization market.
S&P Global (SPGI) is a leading American provider of financial information, analytics, and credit ratings, headquartered in New York, NY. It operates major divisions including S&P Global Ratings, S&P Global Market Intelligence, S&P Global Commodity Insights, S&P Global Mobility, and S&P Dow Jones Indices.
The ICE BofA U.S. High Yield Index is an unmanaged index that tracks the performance of U.S. dollar denominated, below investment-grade rated corporate debt publicly issued in the U.S. domestic market.
The S&P 500 Growth measures constituents from the S&P 500 that are classified as growth stocks based on three factors: sales growth, the ratio of earnings change to price, and momentum.
The S&P 500 Value Index measures constituents from the S&P 500 that are classified as value stocks based on three factors: the ratios of book value, earnings and sales to price.
The S&P 500 Equal Weight Index is the equal-weight version of the widely regarded Standard & Poor’s 500 Index, which is generally considered representative of the U.S. large capitalization market. The index has the same constituents as the capitalization-weighted S&P 500, but each company in the index is allocated a fixed weight of 0.20% at each quarterly rebalancing.
The WCA Rising Dividend Custom Benchmark is a rules-based benchmark constructed by Washington Crossing Advisors to represent a universe of large capitalization U.S. companies that meet certain quality and dividend growth criteria, including proprietary screens for profitability, earnings consistency, and balance sheet strength, along with minimum market capitalization and dividend growth requirements. The benchmark is reconstituted and rebalanced quarterly and is intended to serve as a style-appropriate benchmark for the WCA Rising Dividend strategy.
The Washington Crossing Advisors’ High Quality Index and Low Quality Index are objective, quantitative measures designed to identify quality in the top 1,000 U.S. companies. Ranked by fundamental factors, WCA grades companies from “A” (top quintile) to “F” (bottom quintile). Factors include debt relative to equity, asset profitability, and consistency in performance. Companies with lower debt, higher profitability, and greater consistency earn higher grades. These indices are reconstituted annually and rebalanced daily. For informational purposes only, and WCA Quality Grade indices do not reflect the performance of any WCA investment strategy.
The risk of loss in trading commodities and futures can be substantial. You should therefore carefully consider whether such trading is suitable for you in light of your financial condition. The high degree of leverage that is often obtainable in commodity trading can work against you as well as for you. The use of leverage can lead to large losses as well as gains.
The information contained herein has been prepared from sources believed to be reliable but is not guaranteed by us and is not a complete summary or statement of all available data, nor is it considered an offer to buy or sell any securities referred to herein. Opinions expressed are subject to change without notice and do not take into account the particular investment objectives, financial situation, or needs of individual investors. There is no guarantee that the figures or opinions forecast in this report will be realized or achieved. Employees of Stifel, Nicolaus & Company, Incorporated or its affiliates may, at times, release written or oral commentary, technical analysis, or trading strategies that differ from the opinions expressed within. Past performance is no guarantee of future results. Indices are unmanaged, and you cannot invest directly in an index.
Asset allocation and diversification do not ensure a profit and may not protect against loss. There are special considerations associated with international investing, including the risk of currency fluctuations and political and economic events. Changes in market conditions or a company’s financial condition may impact a company’s ability to continue to pay dividends, and companies may also choose to discontinue dividend payments. Investing in emerging markets may involve greater risk and volatility than investing in more developed countries. Due to their narrow focus, sector-based investments typically exhibit greater volatility. Small-company stocks are typically more volatile and carry additional risks since smaller companies generally are not as well established as larger companies. Property values can fall due to environmental, economic, or other reasons, and changes in interest rates can negatively impact the performance of real estate companies. When investing in bonds, it is important to note that as interest rates rise, bond prices will fall. High-yield bonds have greater credit risk than higher-quality bonds. Bond laddering does not assure a profit or protect against loss in a declining market. The risk of loss in trading commodities and futures can be substantial. You should therefore carefully consider whether such trading is suitable for you in light of your financial condition. The high degree of leverage that is often obtainable in commodity trading can work against you as well as for you. The use of leverage can lead to large losses as well as gains. Changes in market conditions or a company’s financial condition may impact a company’s ability to continue to pay dividends, and companies may also choose to discontinue dividend payments.
All investments involve risk, including loss of principal, and there is no guarantee that investment objectives will be met. It is important to review your investment objectives, risk tolerance, and liquidity needs before choosing an investment style or manager. Equity investments are subject generally to market, market sector, market liquidity, issuer, and investment style risks, among other factors to varying degrees. Fixed Income investments are subject to market, market liquidity, issuer, investment style, interest rate, credit quality, and call risks, among other factors to varying degrees.
Beta is a measure of the volatility, or systematic risk, of a security or a portfolio relative to the market as a whole. A beta of one is considered as risky as the benchmark and is therefore likely to provide expected returns approximate to those of the benchmark during both up and down periods. A portfolio with a beta of two would move approximately twice as much as the benchmark.
Standard deviation is a measure of the volatility of a security’s or portfolio’s returns in relation to the mean return. The larger the standard deviation, the greater the volatility of return in relation to the mean return.
Changes in market conditions or a company’s financial condition may impact a company’s ability to continue to pay dividends, and companies may also choose to discontinue dividend payments
This commentary often expresses opinions about the direction of market, investment sector, and other trends. The opinions should not be considered predictions of future results. The information contained in this report is based on sources believed to be reliable, but is not guaranteed and not necessarily complete.
The securities discussed in this material were selected due to recent changes in the strategies. This selection criterion is not based on any measurement of performance of the underlying security.
Washington Crossing Advisors, LLC is a wholly-owned subsidiary and affiliated SEC Registered Investment Adviser of Stifel Financial Corp (NYSE: SF). Registration with the SEC implies no level of sophistication in investment management.


