A Market’s Tall Order
Following the shortest recession on record, earnings for U.S. companies are soaring. Analysts now expect S&P 500 earnings to reach $214 over the next 12-months. This marks a 20% advance versus the $178 estimate that prevailed pre-pandemic and 54% above the pandemic low of $140. Unprecedented stimulus and the vaccination rollout explain boosting economic growth, too. According to the most recent figures from the New York Federal Reserve, current period economic growth is near 4%. While down from the 6.6% annualized pace of last quarter, 4% is still a healthy pace of improvement. A rapid rate of economic rebound is a primary driver behind the surge in profit forecasts.
Soaring Values
The combination of accelerating growth, near-zero interest rates, and soaring profits is not lost on the market. The total value of U.S. stocks is now over $51 trillion, a $16 trillion rise from a $35 trillion total valuation pre-pandemic. To put today’s $16 trillion advance in further perspective, recall that it took over two hundred years — from the founding of the earliest U.S. stock exchange in 1790 to just before the 2007-2009 financial crisis — for the U.S. stock market to create $16 trillion in value. The post-pandemic rally is remarkable because of the magnitude of the gains and because the gains happened during a recession and global health crisis.
Wealth Sets Records
The wealth created by the stock market is likely feeding back into the economy. A 2001 paper by Federal Reserve Board members concludes that changes in wealth directly boost consumption growth, but changes in wealth do not necessarily predict future changes in household income. This is important today because of the powerful one-two punch of massive stimulus checks plus large increases in stock (and real estate) wealth. According to Federal Reserve data, U.S. household net worth rose by $25 trillion last year to $142 trillion (a 22% gain). This 22% gain was the largest rise since the early 1950s. Moreover, household income rose by a record $1 trillion, mainly due to stimulus payments. Personal savings also surged to a record $2.3 trillion in 2020 from $1.2 trillion in 1999.
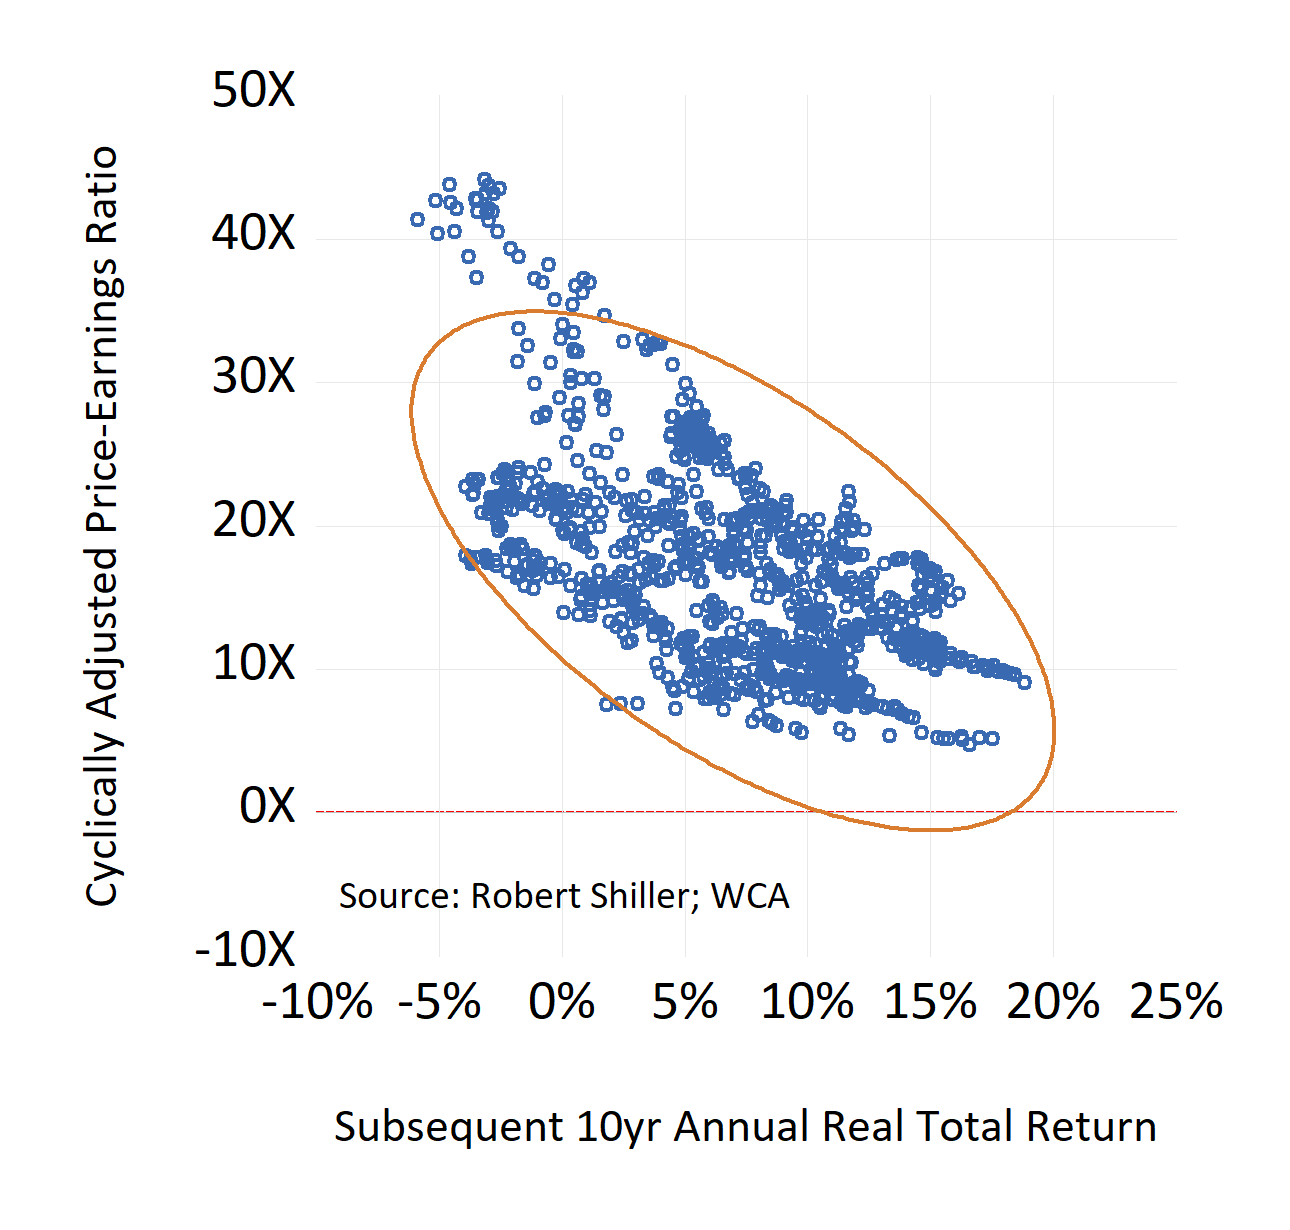
With higher wealth comes higher starting valuations for many assets, including stocks. As we move toward the end of the year, it is essential to look at valuations because they can have a meaningful impact on returns (Chart A, below). The chart below shows how valuations and subsequent returns are related. Inflation-adjusted returns over the ensuing 10-year period tend to fall as valuations rise, based on cyclically-adjusted earnings multiples. The opposite holds when valuations fall, with returns tending to be higher in the following years. What we pay for an asset does matter for most of us over most of our time horizons.
Chart A
Starting Market Valuations and Returns
Driving Up Valuations
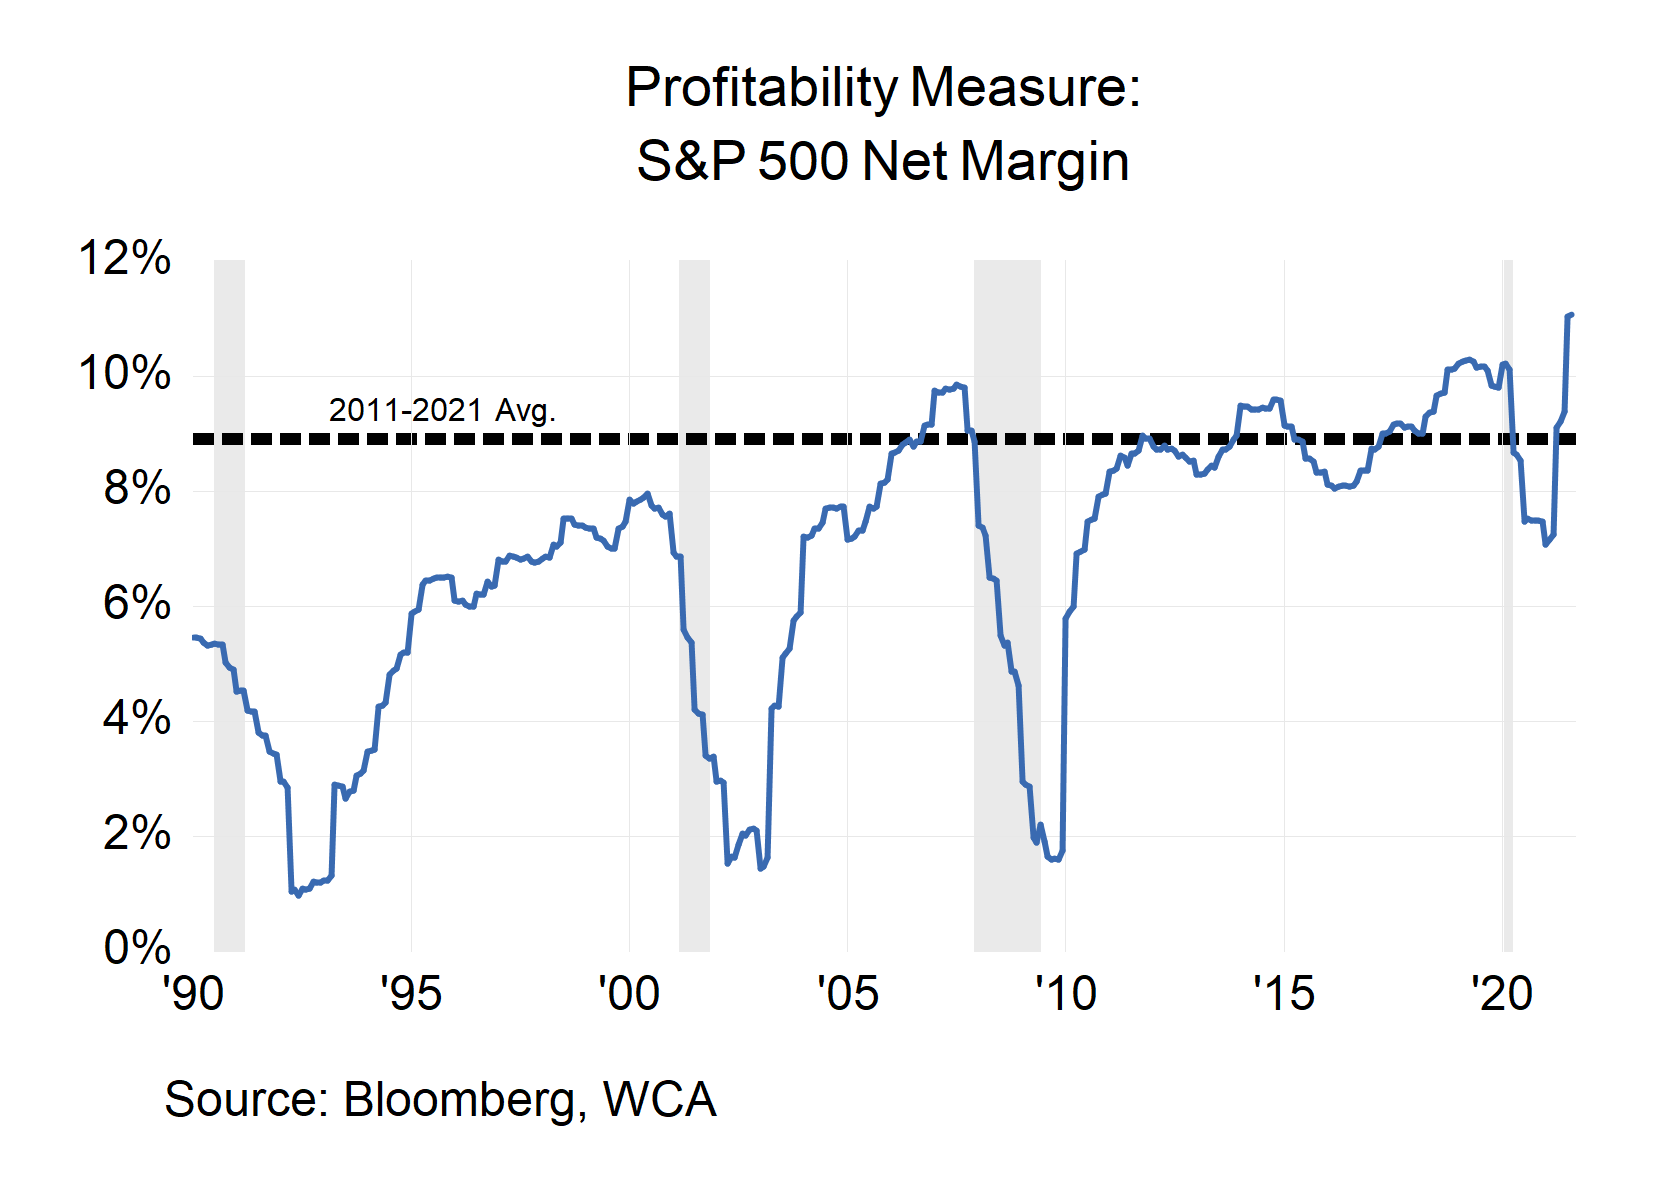
Today, valuations appear elevated and approaching levels last seen in 1999 (Chart B, below). We expect this to weigh on future returns. But note that profitability is also elevated (Chart C, below), given the astonishing rise of technology’s place in our economy. Further lifting multiples are low interest rates and a high degree of liquidity. The Federal Reserve kept short-term rates at 0% last week, and outstanding global debt with negative yields is $14 trillion, for example. Such an absence of competing “safe” savings yields further drives demand for riskier stocks. Low yields also mean future earnings become more valuable when discounted back to the present.
Chart B
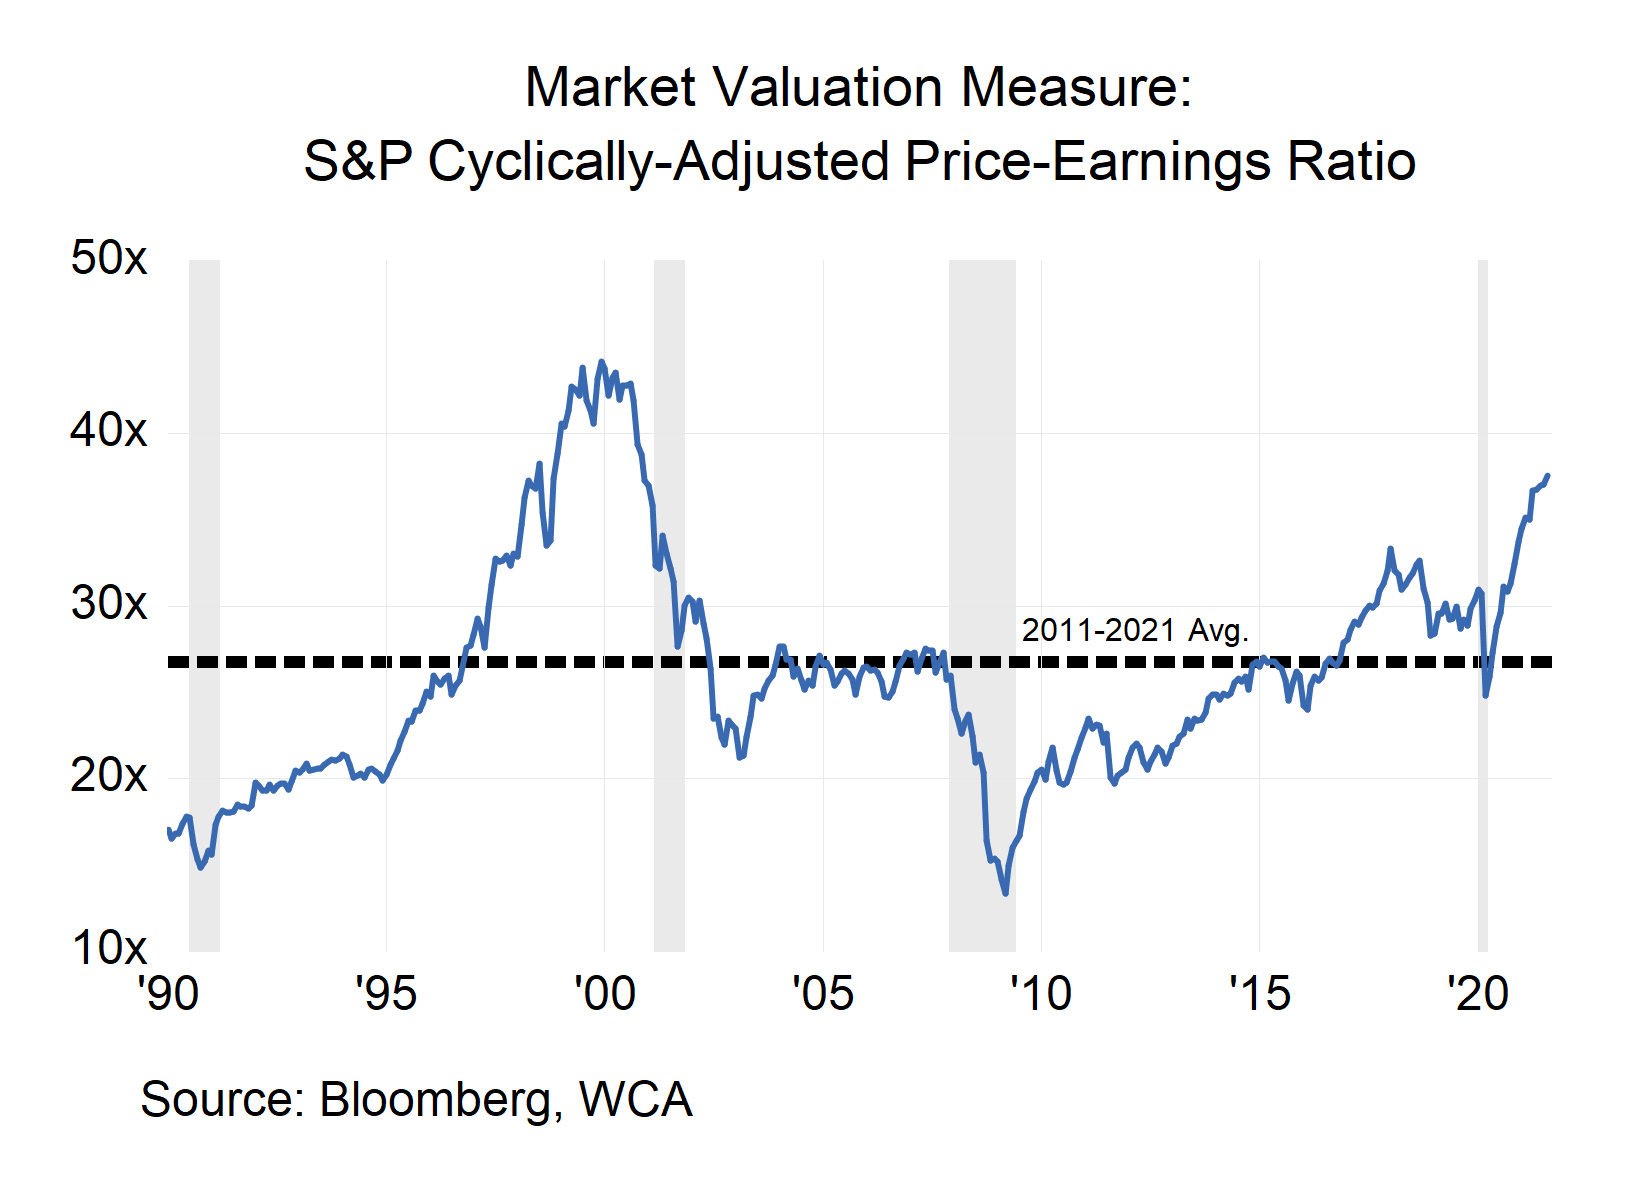
Chart C
Another place we see evidence of stretched valuation is in the area of dividends. For example, the dividend yield on the S&P 500, based on forecast dividends over the next 12 months, is at 1.5%, a new low (Chart D, below). While the yield could fall further, it could also revert to the historical average. If that were to happen, if stocks were to reprice so that the market’s dividend yield was in line with the historical 2.17% average, the stock market would need to decline by 30%. This is why recovery must continue, dividends must be maintained, and financial conditions must stay supportive.
Chart D

Conclusion and Recommendations
Given the tall order asked of markets in today’s environment, we recommend the following portfolio actions:
- For overall asset allocation, consider a flexible but disciplined, tactical approach that is forward looking and can respond to changing market conditions;
- For equity investing, focus on flexibility, durability, and predictability over things like high dividend yields, chasing momentum, and “story” stocks;
- For fixed income, avoid guessing about interest rates and consider a carefully constructed ladder of high-grade issuers that can adapt to changing rates.
We believe these “big organizing ideas” offer a well-reasoned and practical approach to addressing today’s unique challenges as we emerge from an era unprecedented macroeconomic policy.
Disclosures:
WCA Barometer – We regularly assess changes in fundamental conditions to help guide near-term asset allocation decisions. Analysis incorporates approximately 30 forward-looking indicators in categories ranging from Credit and Capital Markets to U.S. Economic Conditions and Foreign Conditions. From each category of data, we create three diffusion-style sub-indices that measure the trends in the underlying data. Sustained improvement that is spread across a wide variety of observations will produce index readings above 50 (potentially favoring stocks), while readings below 50 would indicate potential deterioration (potentially favoring bonds). The WCA Fundamental Conditions Index combines the three underlying categories into a single summary measure. This measure can be thought of as a “barometer” for changes in fundamental conditions.
Standard & Poor’s 500 Index (S&P 500) is a capitalization-weighted index that is generally considered representative of the U.S. large capitalization market.
The S&P 500® Information Technology comprises those companies included in the S&P 500 that are classified as members of the GICS® information technology sector.
S&P Global (SPGI) is a leading American provider of financial information, analytics, and credit ratings, headquartered in New York, NY. It operates major divisions including S&P Global Ratings, S&P Global Market Intelligence, S&P Global Commodity Insights, S&P Global Mobility, and S&P Dow Jones Indices.
The ICE BofA U.S. High Yield Index is an unmanaged index that tracks the performance of U.S. dollar denominated, below investment-grade rated corporate debt publicly issued in the U.S. domestic market.
The S&P 500 Growth measures constituents from the S&P 500 that are classified as growth stocks based on three factors: sales growth, the ratio of earnings change to price, and momentum.
The S&P 500 Value Index measures constituents from the S&P 500 that are classified as value stocks based on three factors: the ratios of book value, earnings and sales to price.
The S&P 500 Equal Weight Index is the equal-weight version of the widely regarded Standard & Poor’s 500 Index, which is generally considered representative of the U.S. large capitalization market. The index has the same constituents as the capitalization-weighted S&P 500, but each company in the index is allocated a fixed weight of 0.20% at each quarterly rebalancing.
The WCA Rising Dividend Custom Benchmark is a rules-based benchmark constructed by Washington Crossing Advisors to represent a universe of large capitalization U.S. companies that meet certain quality and dividend growth criteria, including proprietary screens for profitability, earnings consistency, and balance sheet strength, along with minimum market capitalization and dividend growth requirements. The benchmark is reconstituted and rebalanced quarterly and is intended to serve as a style-appropriate benchmark for the WCA Rising Dividend strategy.
The Washington Crossing Advisors’ High Quality Index and Low Quality Index are objective, quantitative measures designed to identify quality in the top 1,000 U.S. companies. Ranked by fundamental factors, WCA grades companies from “A” (top quintile) to “F” (bottom quintile). Factors include debt relative to equity, asset profitability, and consistency in performance. Companies with lower debt, higher profitability, and greater consistency earn higher grades. These indices are reconstituted annually and rebalanced daily. For informational purposes only, and WCA Quality Grade indices do not reflect the performance of any WCA investment strategy.
The risk of loss in trading commodities and futures can be substantial. You should therefore carefully consider whether such trading is suitable for you in light of your financial condition. The high degree of leverage that is often obtainable in commodity trading can work against you as well as for you. The use of leverage can lead to large losses as well as gains.
The information contained herein has been prepared from sources believed to be reliable but is not guaranteed by us and is not a complete summary or statement of all available data, nor is it considered an offer to buy or sell any securities referred to herein. Opinions expressed are subject to change without notice and do not take into account the particular investment objectives, financial situation, or needs of individual investors. There is no guarantee that the figures or opinions forecast in this report will be realized or achieved. Employees of Stifel, Nicolaus & Company, Incorporated or its affiliates may, at times, release written or oral commentary, technical analysis, or trading strategies that differ from the opinions expressed within. Past performance is no guarantee of future results. Indices are unmanaged, and you cannot invest directly in an index.
Asset allocation and diversification do not ensure a profit and may not protect against loss. There are special considerations associated with international investing, including the risk of currency fluctuations and political and economic events. Changes in market conditions or a company’s financial condition may impact a company’s ability to continue to pay dividends, and companies may also choose to discontinue dividend payments. Investing in emerging markets may involve greater risk and volatility than investing in more developed countries. Due to their narrow focus, sector-based investments typically exhibit greater volatility. Small-company stocks are typically more volatile and carry additional risks since smaller companies generally are not as well established as larger companies. Property values can fall due to environmental, economic, or other reasons, and changes in interest rates can negatively impact the performance of real estate companies. When investing in bonds, it is important to note that as interest rates rise, bond prices will fall. High-yield bonds have greater credit risk than higher-quality bonds. Bond laddering does not assure a profit or protect against loss in a declining market. The risk of loss in trading commodities and futures can be substantial. You should therefore carefully consider whether such trading is suitable for you in light of your financial condition. The high degree of leverage that is often obtainable in commodity trading can work against you as well as for you. The use of leverage can lead to large losses as well as gains. Changes in market conditions or a company’s financial condition may impact a company’s ability to continue to pay dividends, and companies may also choose to discontinue dividend payments.
All investments involve risk, including loss of principal, and there is no guarantee that investment objectives will be met. It is important to review your investment objectives, risk tolerance, and liquidity needs before choosing an investment style or manager. Equity investments are subject generally to market, market sector, market liquidity, issuer, and investment style risks, among other factors to varying degrees. Fixed Income investments are subject to market, market liquidity, issuer, investment style, interest rate, credit quality, and call risks, among other factors to varying degrees.
Beta is a measure of the volatility, or systematic risk, of a security or a portfolio relative to the market as a whole. A beta of one is considered as risky as the benchmark and is therefore likely to provide expected returns approximate to those of the benchmark during both up and down periods. A portfolio with a beta of two would move approximately twice as much as the benchmark.
Standard deviation is a measure of the volatility of a security’s or portfolio’s returns in relation to the mean return. The larger the standard deviation, the greater the volatility of return in relation to the mean return.
Changes in market conditions or a company’s financial condition may impact a company’s ability to continue to pay dividends, and companies may also choose to discontinue dividend payments
This commentary often expresses opinions about the direction of market, investment sector, and other trends. The opinions should not be considered predictions of future results. The information contained in this report is based on sources believed to be reliable, but is not guaranteed and not necessarily complete.
The securities discussed in this material were selected due to recent changes in the strategies. This selection criterion is not based on any measurement of performance of the underlying security.
Washington Crossing Advisors, LLC is a wholly-owned subsidiary and affiliated SEC Registered Investment Adviser of Stifel Financial Corp (NYSE: SF). Registration with the SEC implies no level of sophistication in investment management.