A Host of Contradictions

This morning’s lead story in the Wall Street Journal is about the resilient U.S. economy. According to the report, strong hiring, consumer spending, stock market, and housing trends are all helping. Yet, a closer look shows some peculiar disconnects. Productivity fell again last quarter, manufacturing is rolling over, and the money supply is falling. Moreover, higher interest rates pose a challenge as the S&P 500 moves toward bull market territory.
Case for Growth
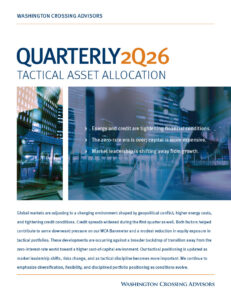
Last week, a scorching hot May jobs report showed the U.S. economy adding 339,000 jobs, far above expectations. Private payrolls grew 283,000, up 2.7% from a year ago (chart A, below). In recent cycles, recessions tend to follow whenever private job growth falls below a 1% “stall speed.” We are well above that level today.
Chart A: U.S. Private Payroll Growth
With an unemployment rate near 3.7% and employers eager to find workers, it is hard to argue the economy is weak. A separate report from payroll provider Automatic Data Processing shows those staying in their job saw a 6.5% pay rise from a year ago. More interestingly, job changers earned 12.1% more than a year ago.
The article further explains that consumers are flush with cash and spending. The author cites a Federal Reserve Bank of San Francisco report. That report posits that people in the United States have about $500 billion of “excess savings” — the amount above what would have been expected had pre-pandemic trends persisted. Rising incomes, plentiful jobs, and flush savings explain why consumption is up a whopping 7% from a year ago. In the ten years before the pandemic, average spending growth ranged from 2.75-3.75%.
Lastly, we see asset prices showing some tentative signs of firming up. For example, the S&P 500 at 4,293 is up 20% from the October 6, 2022 low of 3,577. A sustained 20% rise from a market bottom would constitute the bookend of a bear market drop. Generally, a 20% rise over at least a few months would be considered a “bull market.” And sales of new homes rose last month to 683,000 units from a multi-year low of 534,000 units last July. Even the S&P CoreLogic Case-Shiller U.S. National Home Price Index increased in the past two months.
The strong job market, persistence in consumption spending, and resilience in asset values undergird the bull case for the economy and markets.
Some Caveats
Three caveats come to mind that give us pause, despite the journal’s analysis:
- We know that policy tightening, such as the Federal Reserve’s (Fed’s) past year’s rate hikes, works with a lag.
- There is evidence the cyclical parts of the economy are now struggling.
- The stock market’s advance lowers return expectations exactly as cash returns rise.
Borrowers Pinched
The market expected interest rates to remain around 1% early last year. As the Fed rapidly increased rates, the expectation for what could be earned holding cash or equivalents also rose. Today, forwards markets expect cash returns a year from now to be about 5%, up about 0.5% from a few weeks ago.
Higher rates mean that the cost of borrowing money is on the rise. For example, according to Bankrate, the average rate on a 30-year mortgage is now near 7% versus 3% a little over a year ago. This means a $250,000 mortgage payment is now $1,663 versus $1,054 a year ago (a 60% increase). It also means the cumulative interest payments on the $250,000 principal would be $348,000 today versus $129,000 in early 2022 (a 170% increase). It is far harder to justify purchasing a home with borrowed money today.
Conflicting Signs
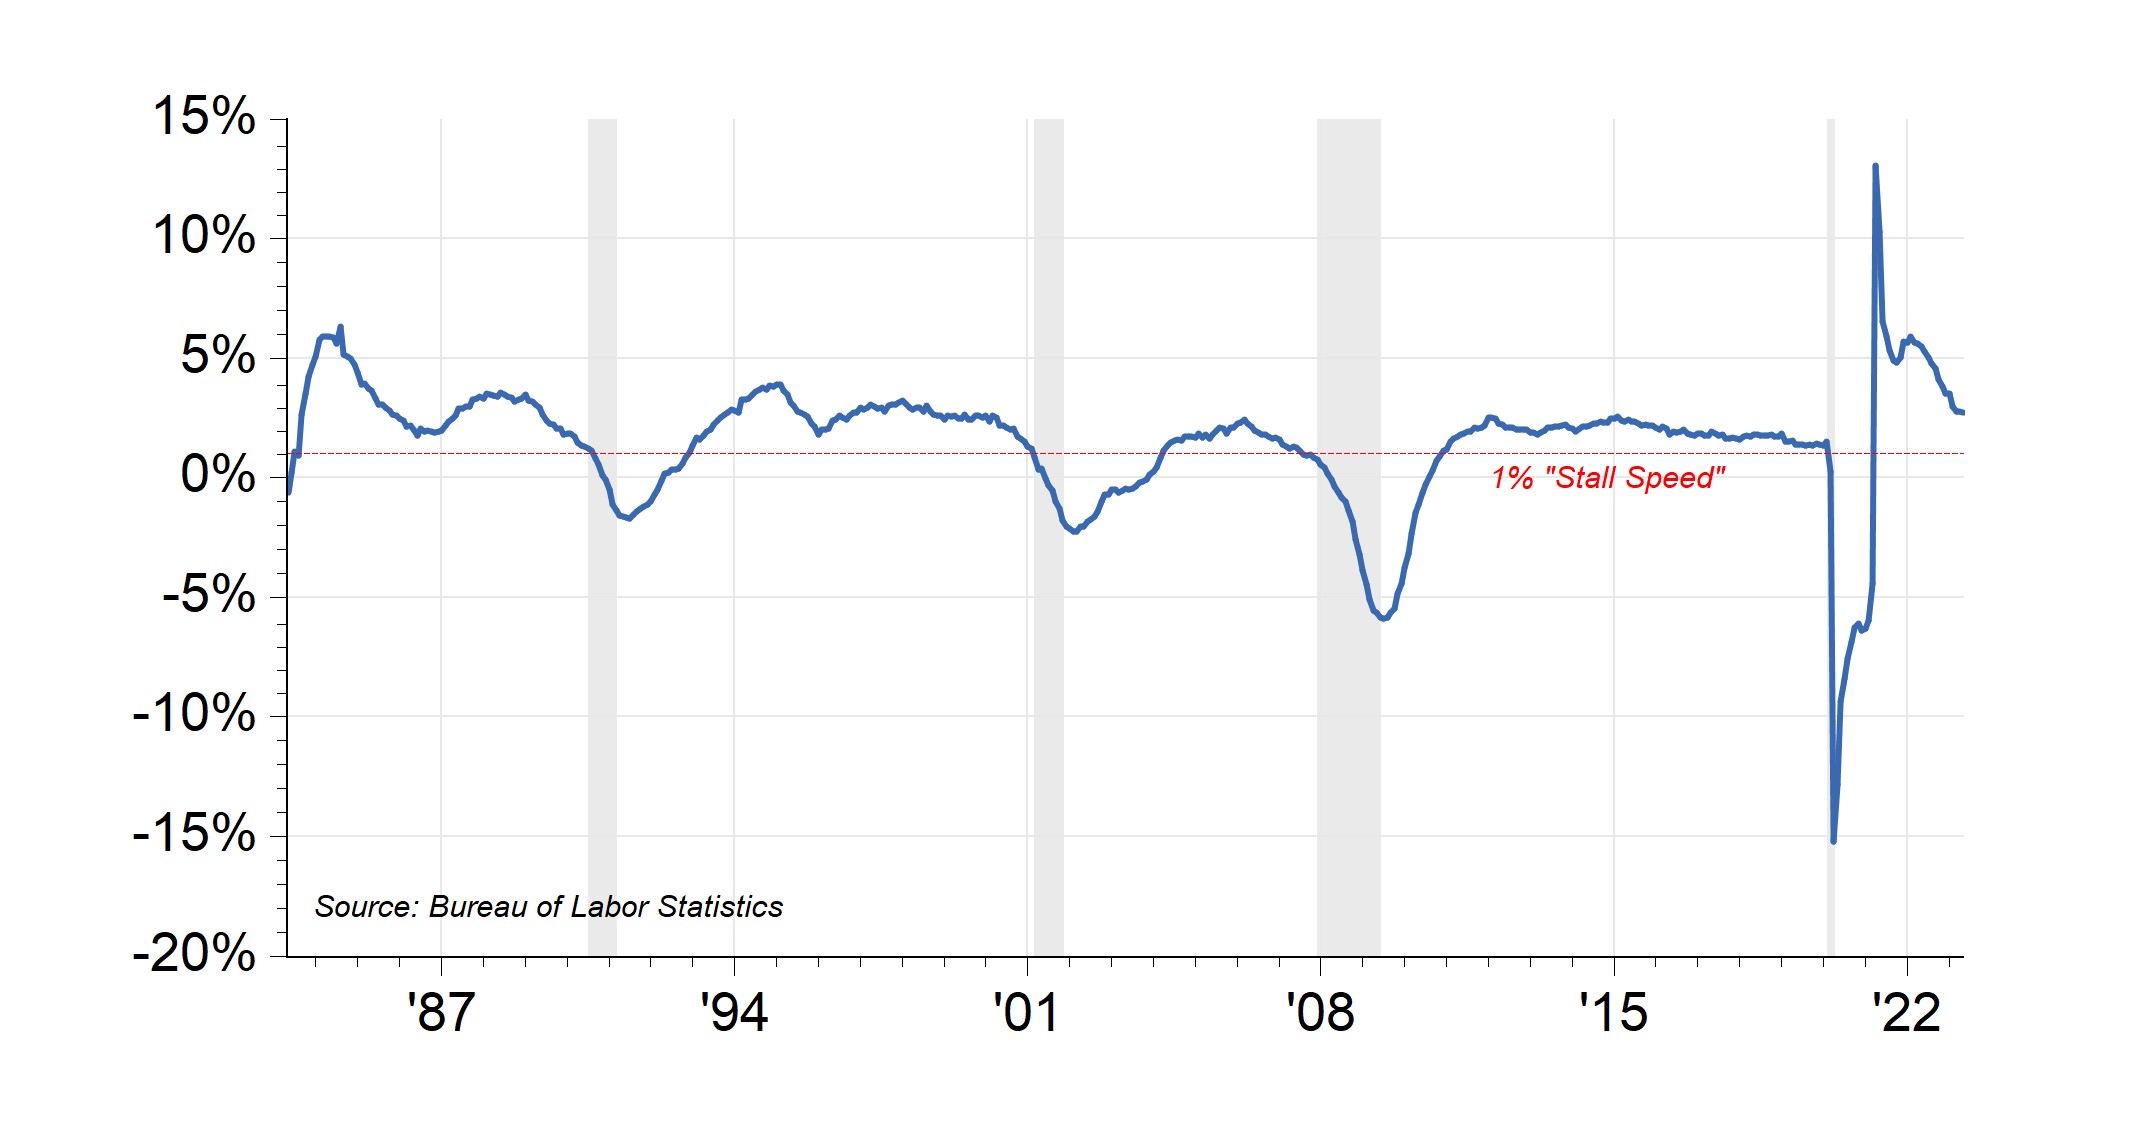
In contrast to the employment report, last week’s Institute of Supply Management’s (ISM) manufacturing survey was weak (Chart B, below). As you can see, new orders for manufactured goods are now at recessionary levels. The May release was the ninth month of sub-50 readings (contractionary), and the 3-month average of 44.2 is the lowest since the pandemic hit.
Chart B: ISM Manufacturing Survey Contraction
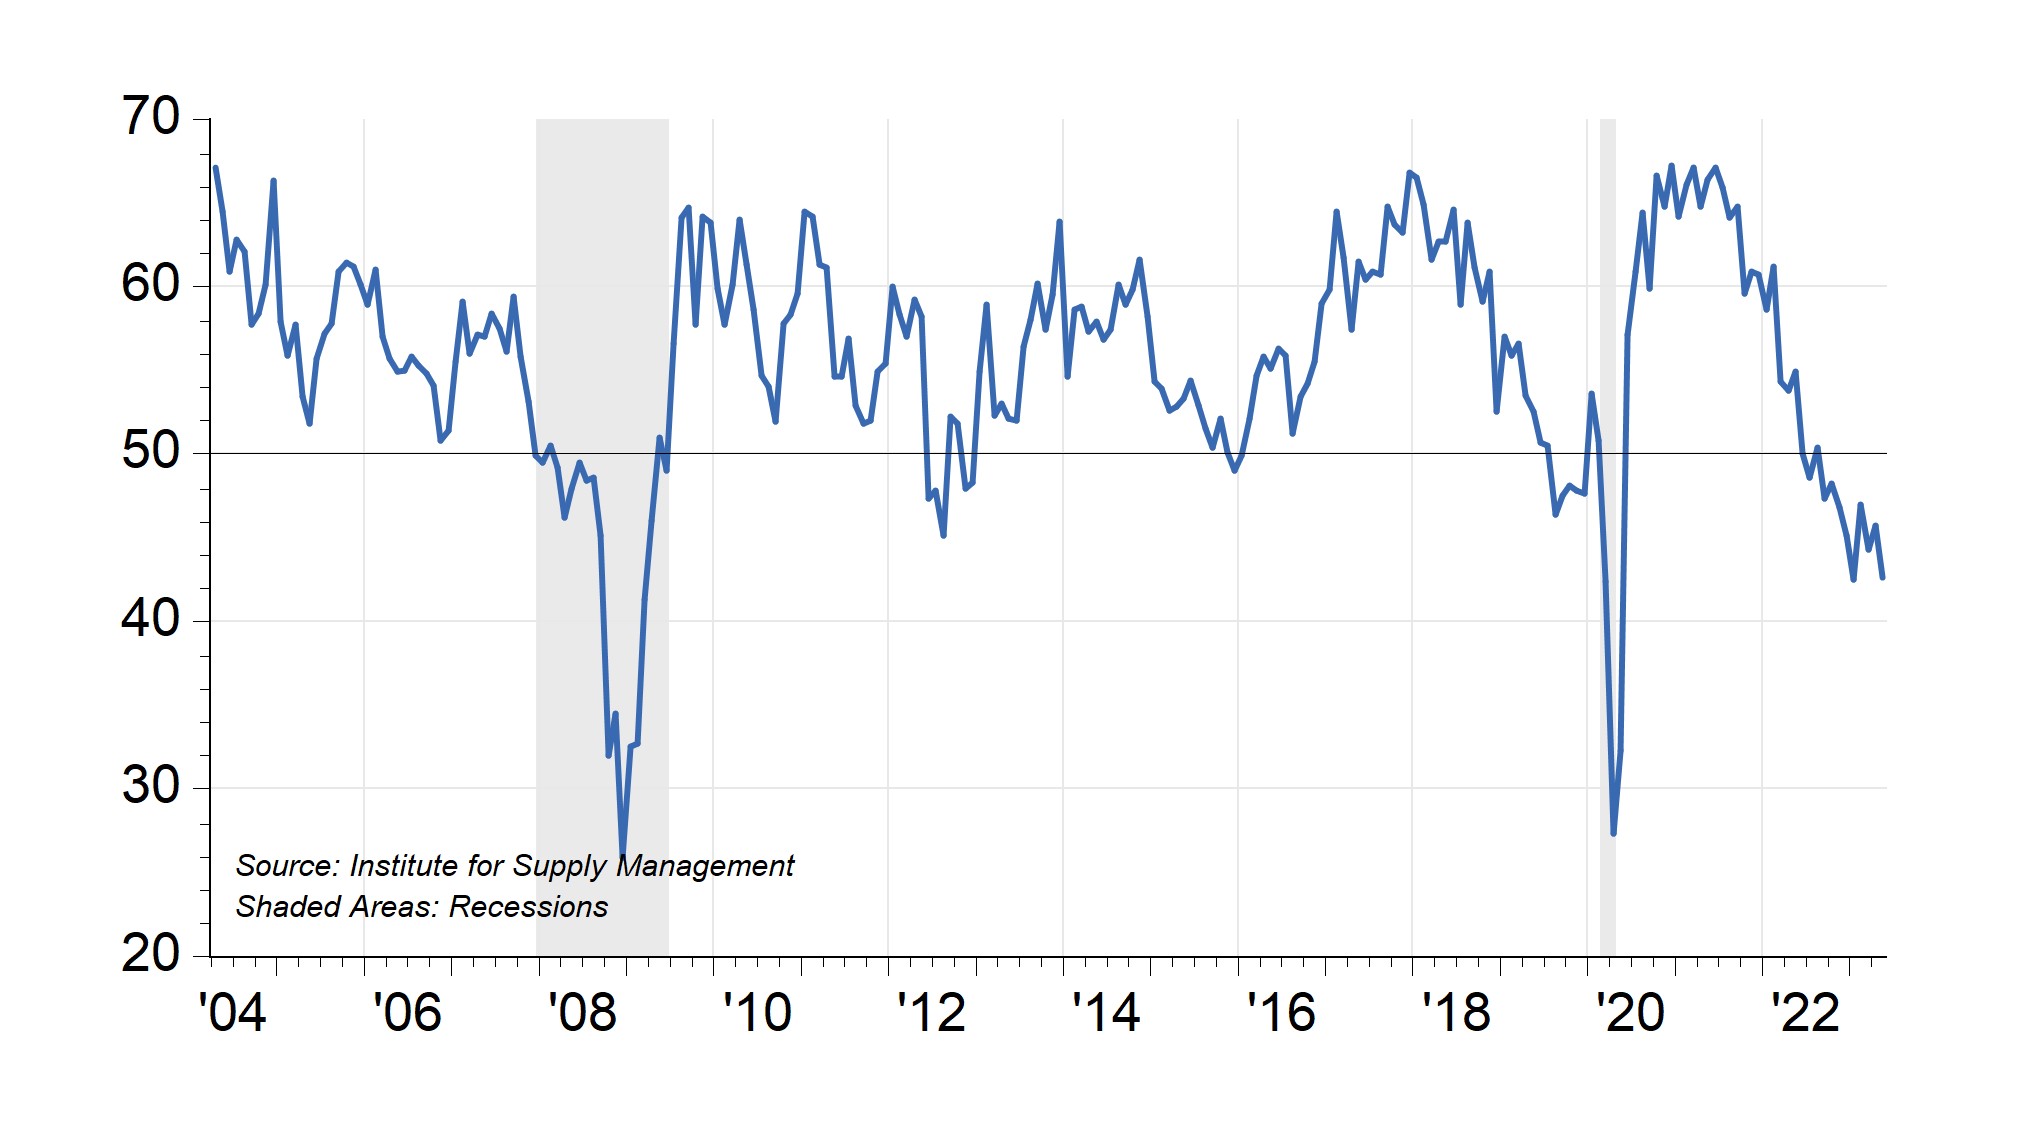
There is a strong historical correlation between this index and corporate earnings. The chart below shows the past relationship between forecast earnings for the S&P 500 and the ISM Manufacturing index (Chart C, below). It should be noted that the past few weeks have seen the two indices move in different directions. While the manufacturing index has been moving lower, the past month has seen the S&P 500 forward 12-month operating earnings estimate rise to $228 from $224. Either the economy gets a lift to justify higher earnings or the earnings will likely suffer.
Chart C: Correlation Between ISM and S&P Earnings
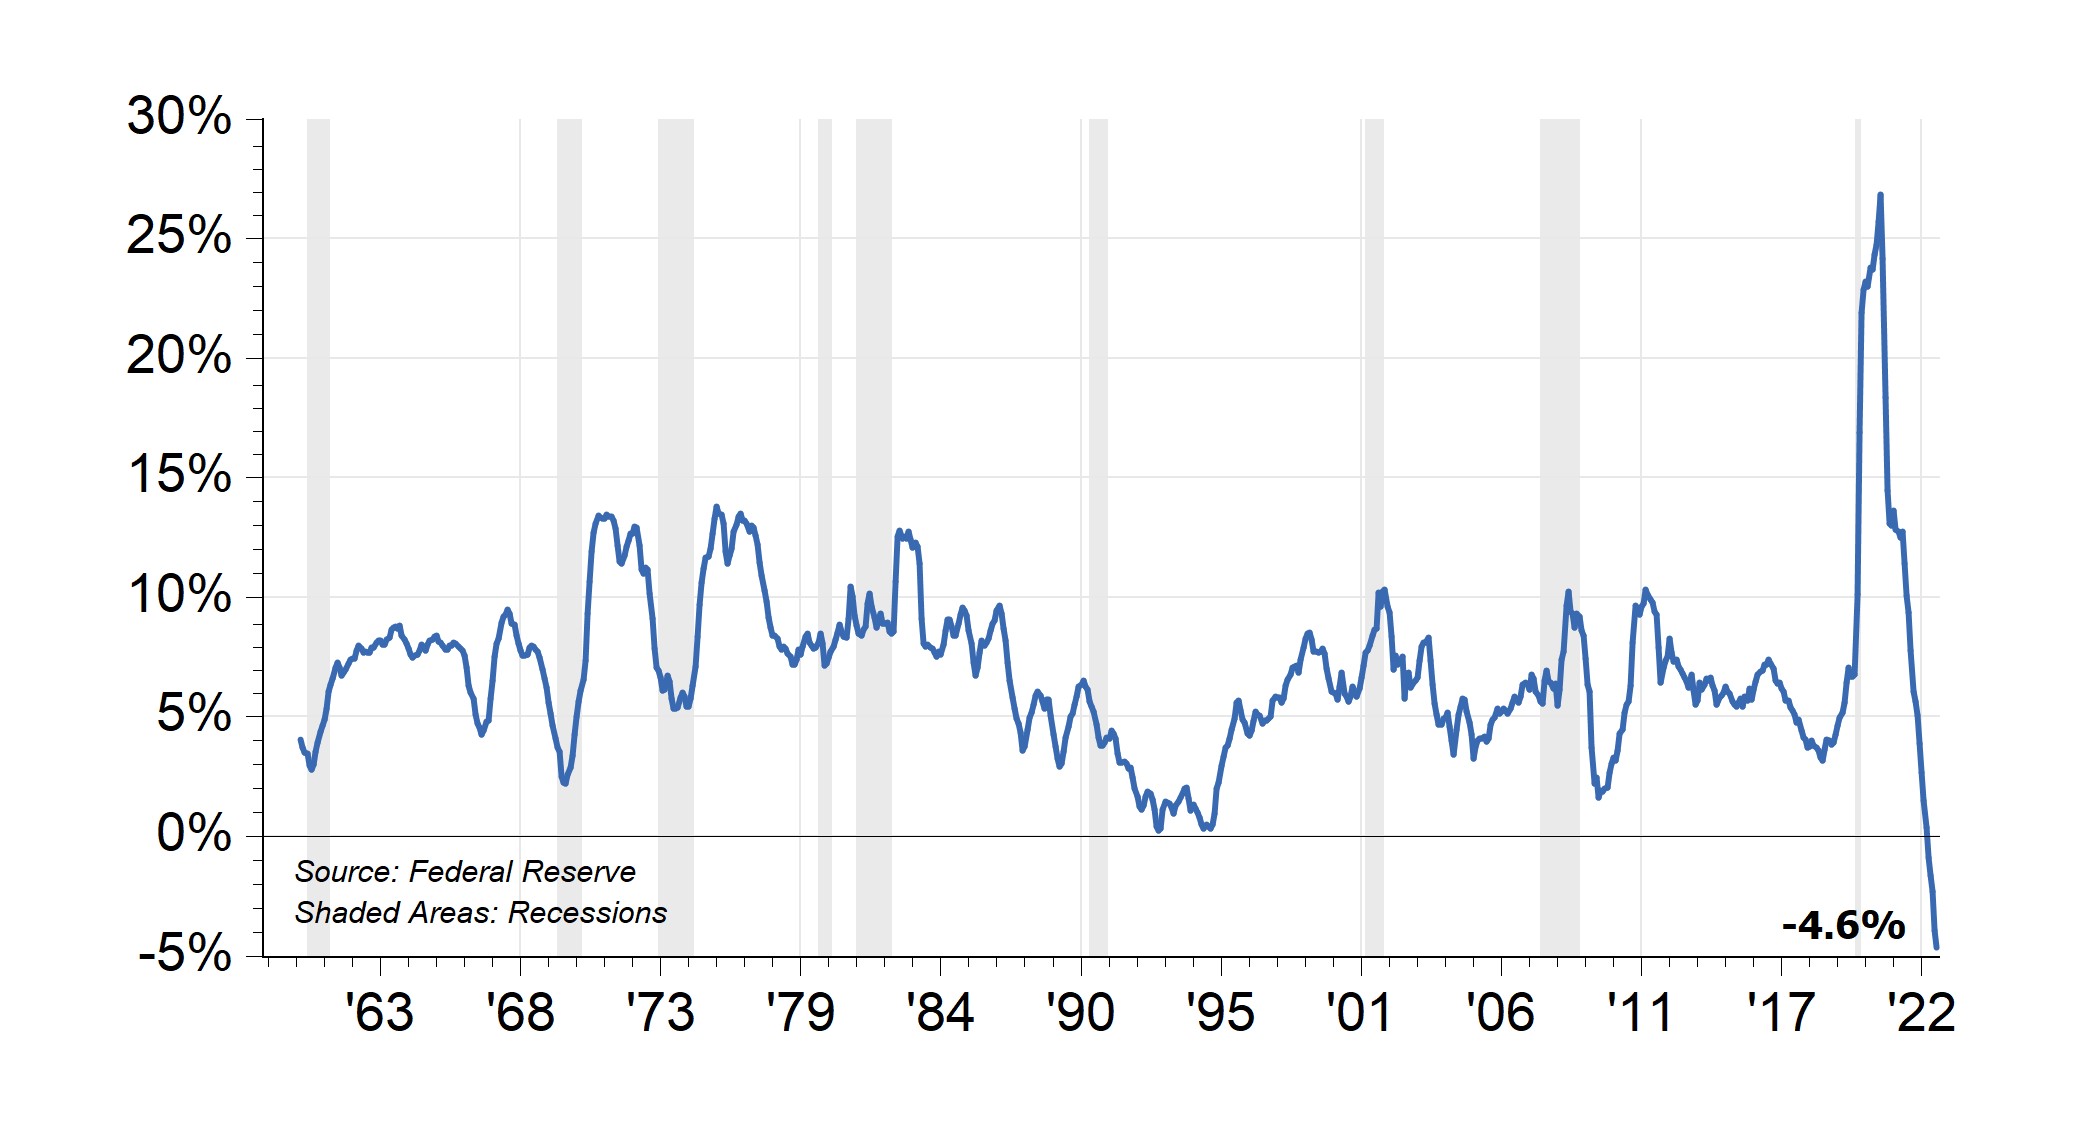
Another sign that conflicts with the growth scenario is the supply of money. As the Chart D below shows, a historic contraction in the money supply, measured as cash and ready cash in bank accounts, is now falling (after a sharp pandemic-era rise). The economist’s measure of money supply, known simply as “M2,” is down 4.5% in the past year, something not seen before since records began. Contracting money supply generally points toward deflation and economic contraction, not inflation and economic expansion.
Chart D: Money Supply’s Historic Contraction
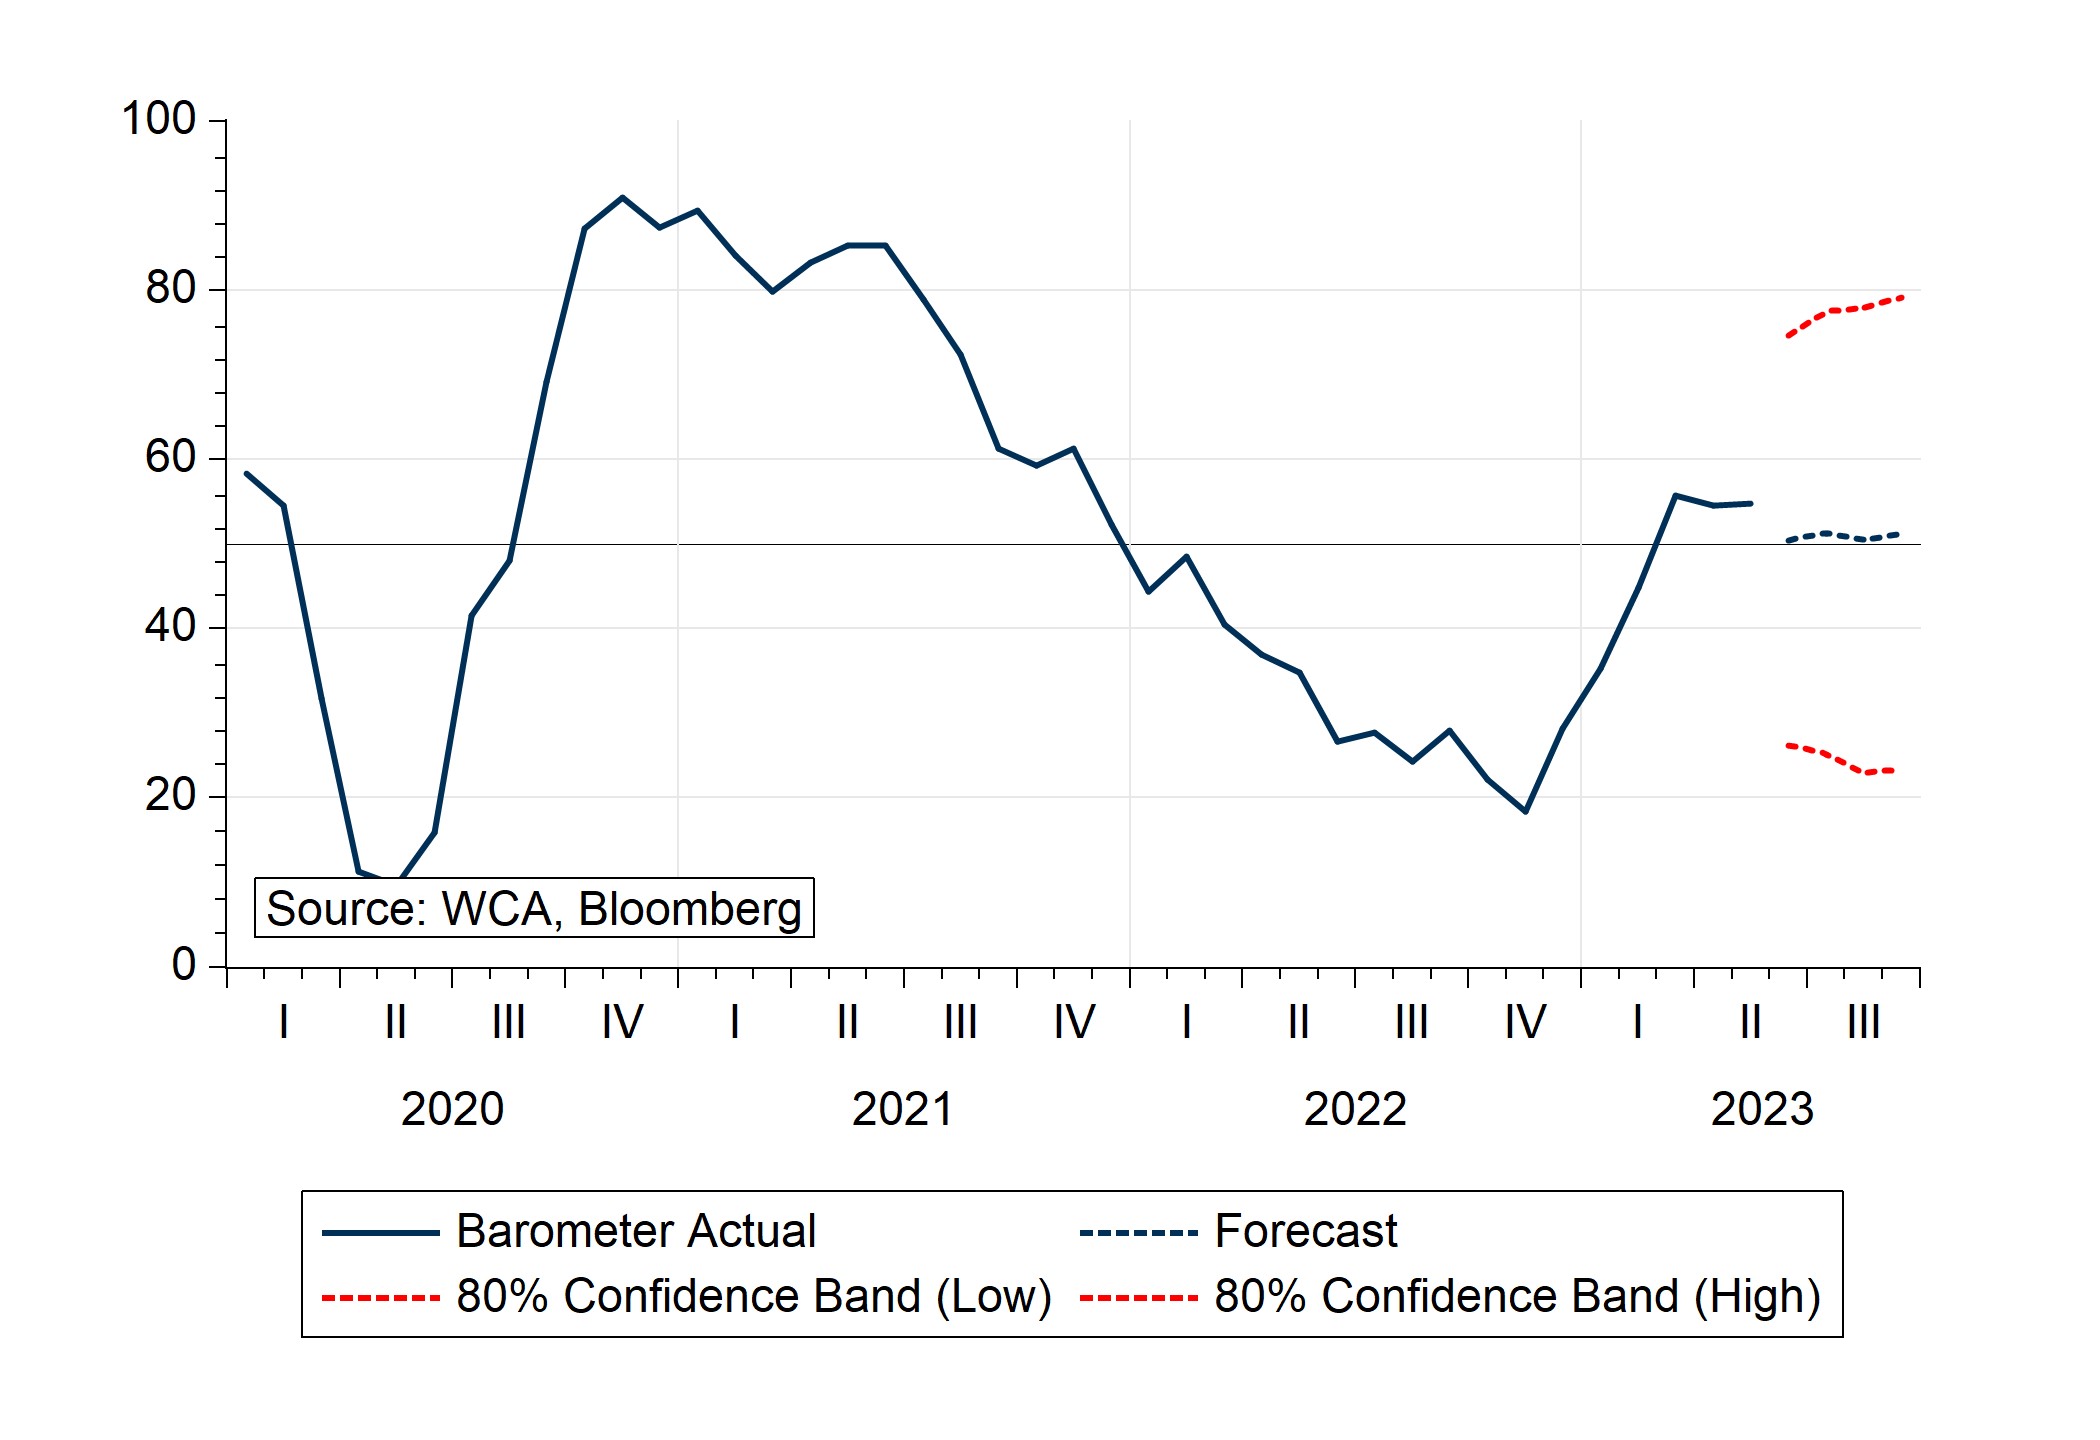
Finally, our WCA Barometer remains near 50, with a significant margin of error and high uncertainty around the forecast (Chart E, below). This means the mix of positive and negative signals is about 50/50%. Moreover, the mix has been directionless for the past few months. We have no strong view about the near-term direction of the economy and market conditions. Consequently, stock and bond exposure in tactical portfolios is very close to benchmarks.
Chart E: WCA Barometer
Challenging Market Expectations
Lastly, the S&P 500’s rally now places the index above the average Wall Street strategist’s year-end forecast. The average year-end S&P 500 forecast by strategists is 3,966. With the S&P 500 trading at 4,293 as of this writing, this implies an average expected market price return of -7.6% for the remainder of the year. Against a T-Bill return of about 5.3%, the difference is a positive 12.9% in favor of cash over stocks (assuming we believe the strategists).
Conclusion
Although last month’s employment report bolsters the case for the economy, we see lots of crosscurrents. These crosscurrents make it difficult to conclude that the progress seen to date will be sustained. The cumulative effects of rate hikes are not yet fully impacting the economy; there are signs of weakness in some critical parts of the economy, and the market’s rally likely limits the upside. For these reasons, we continue to emphasize the importance of quality. We are also staying close to benchmarks in our tactical positioning until more clarity emerges.