A Decade of Performance — U.S. Proves Naysayers Wrong
Last Monday, the National Bureau of Economic Research declared the longest economic expansion in U.S. history over. After beginning in June 2009, the expansion lasted for 128 months through February. Born in the depths of a severe financial crisis that started at home, many worried the U.S. would suffer a long decline. In the ten and one-half years that followed, the U.S. economy and markets outpaced most others, leaving domestic stocks with premium valuations.
Even though U.S. stocks appear relatively expensive, we should remain tactically overweight domestic assets for now because dollar-denominated assets can convey significant benefits during times of uncertainty and because the U.S. economy remains more robust, durable, and better balanced than others.
Domestic Stocks at a Premium Valuation
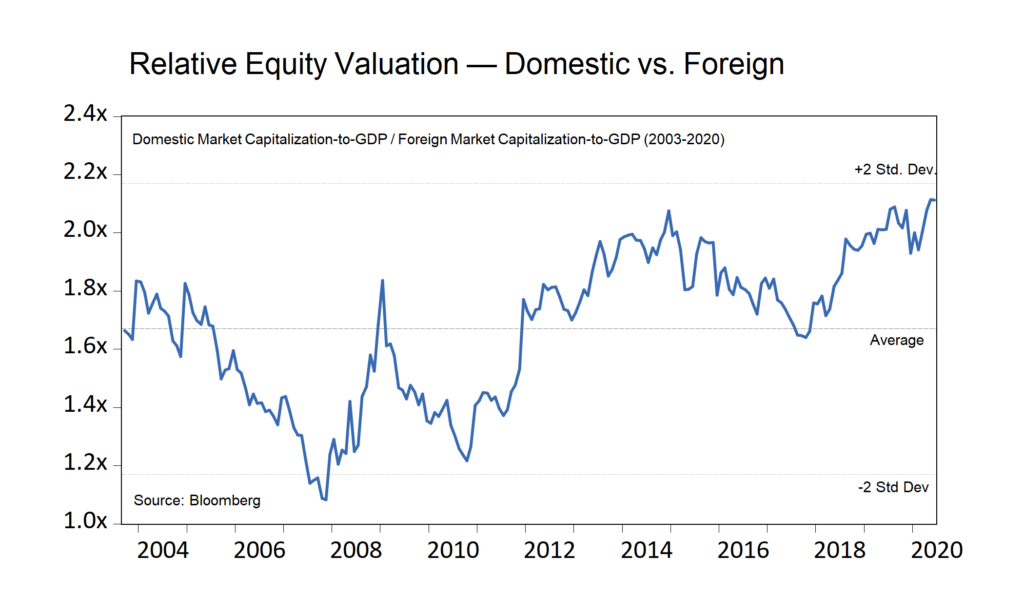
One way to measure the relative valuation of a nation’s equity market is to compare the stock market value to its economy’s output. This measure is a crude one, but a reasonable place to start. At $32 trillion, the U.S. stock market is worth 1.5 times annual gross domestic product (GDP) of $22 trillion. Non-U.S. markets are valued at about 0.7 times GDP, roughly half of domestic valuations. The relative valuation is therefore 2.1 times (1.5x / 0.7x = 2.1x). It is not unusual for the U.S. to trade at a premium valuation. Historically, foreign stock market valuations were typically 30-50% of U.S. valuations. Still, we find that today’s valuation levels place the United States’ equity market at the upper end of the historical range (chart, below). This premium valuation should reduce the long-run expected return of U.S. stocks relative to foreign somewhat.
Dollar Benefits
Even though U.S. stocks appear relatively expensive, we should remain tactically overweight domestic assets because dollar-denominated assets can convey significant benefits — especially during times of uncertainty.
The United States dollar provides the world with a vast, liquid, dependable market for foreign exchange. Despite protests, the world appears unwilling to give up the dollar. Today, 60% of countries peg their currency to the greenback (versus 30% in 1950). 90% of global financial transactions take place in dollars. 75% of foreigner’s borrowing takes place in U.S. dollars. The dollar is also the currency in which most nations hold reserves.
When fears arise, the dollar is often seen as a “safe harbor” currency. Consider that in 2011, when Standard & Poor’s downgraded U.S. sovereign debt, the dollar rallied by 20% in the months that followed. More recently, when Coronavirus hobbled the global economy, foreigners worried they might not be able to get enough dollars. We see the dollar as the go-to funding currency that will likely be in demand during times of stress.
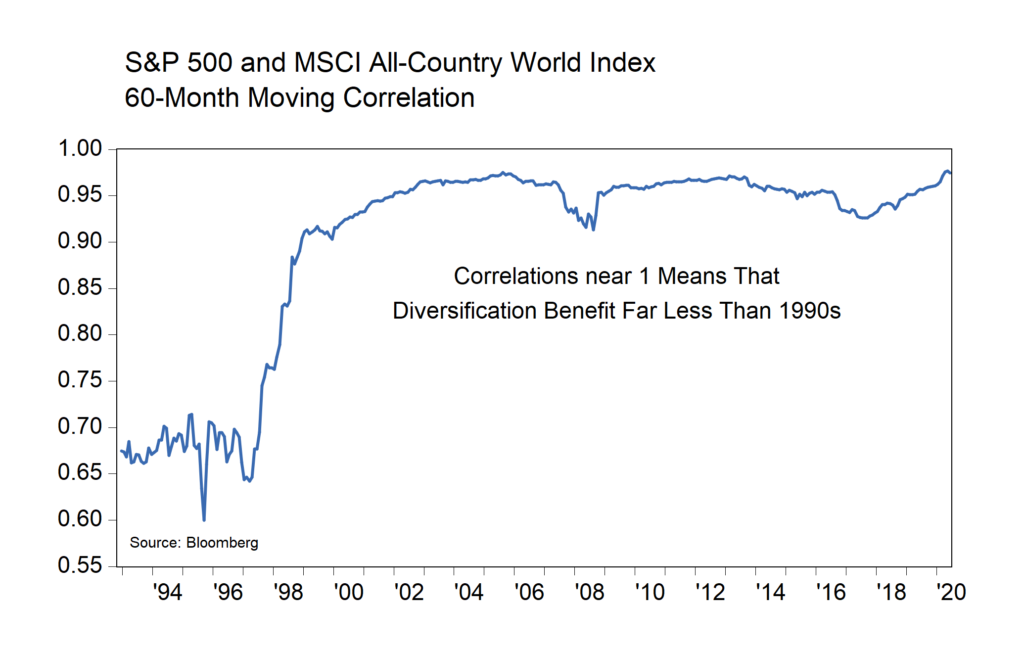
Some make the case for non-dollar equity holdings on the basis of a presumed diversification benefit. Here, we see much less benefit than in the past. The chart below shows the 60-month rolling correlation between the S&P 500 (domestic stocks) and the MSCI All-Country World Index (global stocks). As you can see, the correlation jumped to nearly 1 in the mid-1990s. This means that the degree of diversification benefit is much less today than it was in the past.
Lastly, the dollar is the currency that most Americans will need for future purchases. Unless planning to live abroad in retirement, most Americans will be making purchases in dollars. Investing in assets denominated in the same currency as the future liabilities simplifies the task of financial planning.
A Relatively Strong Economy
The most important reason we should remain tactically overweight domestic assets is that the United States’ economy appears stronger than many others.
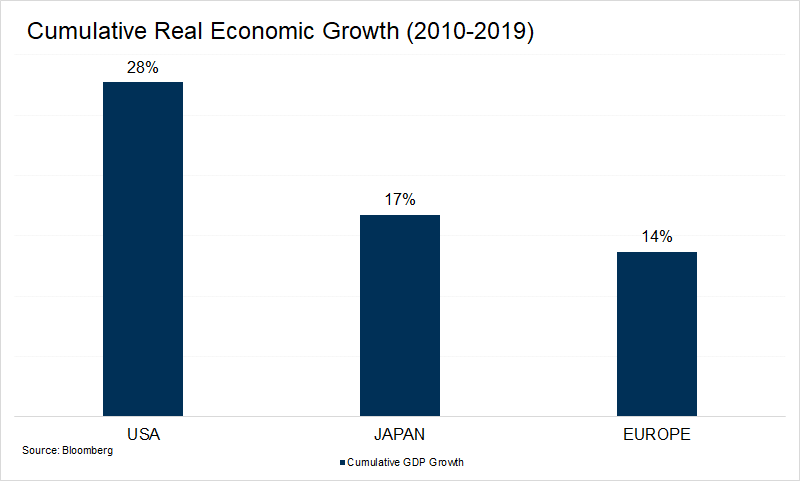
From June 2009 through February, U.S. stocks returned 300% (S&P 500) while global stocks returned 160% (MSCI All-Country World Index). China’s stock market returned a mere 23% in total. In real terms, the U.S. economy expanded 28% versus 17% and 14% for Japan and Europe, respectively (chart, below). The domestic stock market dominated global returns for the last decade. The strong market performance reflects the relative strength of the U.S. economy in our view.
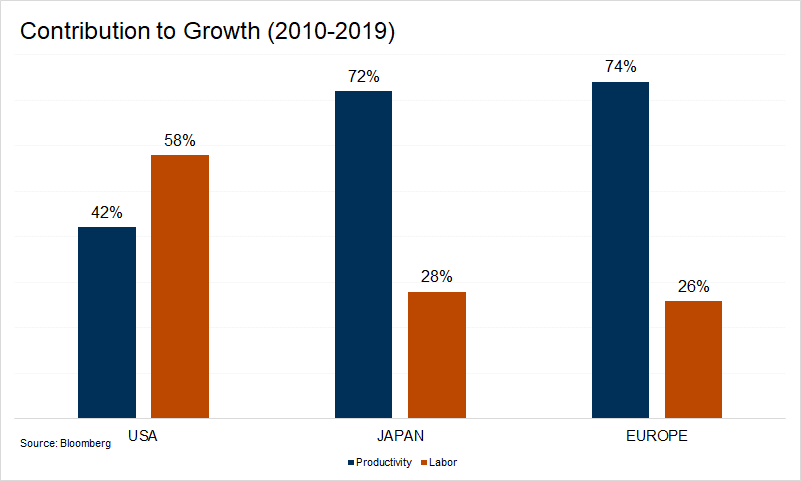
Additionally, the sources of growth in the U.S. appear well balanced. Over time, growth comes from one of two sources — increases in labor or growth in productivity. As the chart below shows, the last decade’s domestic growth came from a balanced mix of productivity and labor growth. Japan and Europe’s labor forces are experiencing stagnating growth. Whatever growth these nations can muster must come from productivity alone. More balanced growth in the United States reduces risks that come from over-dependence on a single growth factor.
Conclusion
Although U.S. stocks appear relatively expensive on the surface, we should remain overweight domestic assets for two main reasons. First, dollar-denominated assets can convey essential benefits. But most importantly, the United States economy appears more robust, durable, and better balanced than many others.
While many thought the U.S. would suffer a lost decade, the past ten-plus years has been anything but “lost.” This fact does not mean that the next year or next decade must be a repeat, but it does remind us always to keep an open mind to possibilities.
The longest expansion on record has officially ended. The months ahead will present a world of new challenges and new opportunities. One of the crucial decisions for investors to make involves the choice of investing at home or abroad. For now, we remain with our long-held tactical tilt in favor of domestic assets over foreign as uncertainties abound regarding the pace of global growth, shifting demographics, and rising debt.
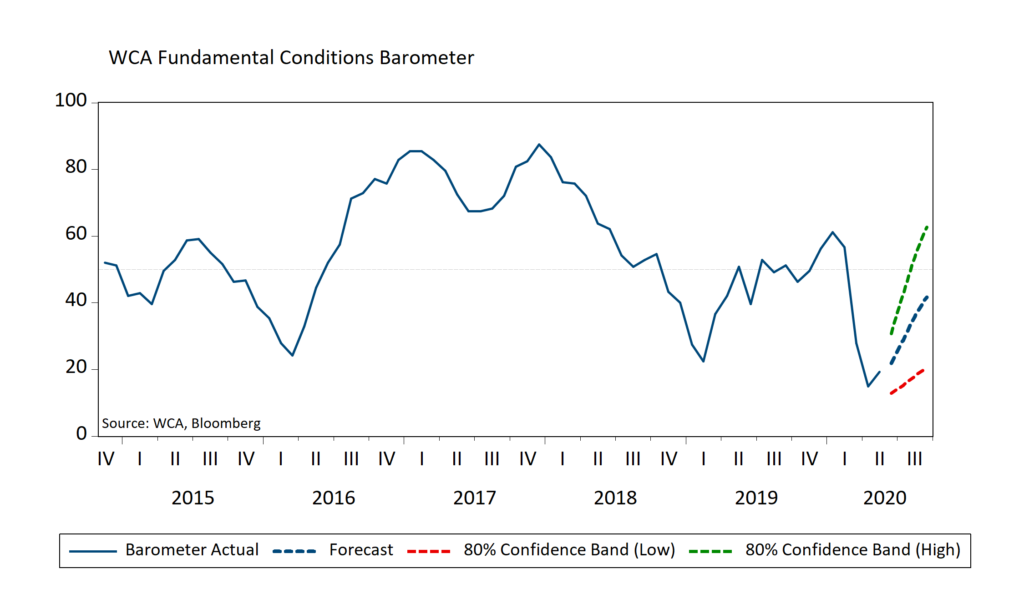
WCA Barometer Update: We update our monthly WCA Fundamental Conditions barometer early each month. The data continues to reflect the impact of Covid-19 and shutdowns. From severely depressed levels, we forecast some pickup ahead (chart, below). We caution that the sudden nature of the onset of the pandemic makes month-to-month trend analysis difficult. To accommodate this, we are also following a set of weekly data and update our readers regularly on virus trends, mobility, and higher-frequency economic data.
S&P 500 — The Standard & Poor’s 500 Index is a capitalization-weighted index that is generally considered representative of the U.S. large capitalization market.
Indices are unmanaged, and it is not possible to invest directly in an index. All benchmark returns presented are provided to represent the investment environment existing during the time periods shown. Actual investment performance will vary due to fees and expenses. For comparison purposes, the benchmarks include the reinvestment of income. The benchmarks are unmanaged and unavailable for direct investment.
The S&P 500 High Beta Index measures the performance of 100 constituents in the S&P 500 that are most sensitive to changes in the market. Constituents are weighted relative to their level of market sensitivity, with each stock assigned a weight proportional to its beta.
The S&P 500 Low Volatility Index measures performance of the 100 least volatile stocks in the S&P 500. The index benchmarks low volatility or low variance strategies for the U.S. stock market. Constituents are weighted relative to the inverse of their corresponding volatility, with the least volatile stocks receiving the highest weights.
Disclosures:
WCA Barometer – We regularly assess changes in fundamental conditions to help guide near-term asset allocation decisions. Analysis incorporates approximately 30 forward-looking indicators in categories ranging from Credit and Capital Markets to U.S. Economic Conditions and Foreign Conditions. From each category of data, we create three diffusion-style sub-indices that measure the trends in the underlying data. Sustained improvement that is spread across a wide variety of observations will produce index readings above 50 (potentially favoring stocks), while readings below 50 would indicate potential deterioration (potentially favoring bonds). The WCA Fundamental Conditions Index combines the three underlying categories into a single summary measure. This measure can be thought of as a “barometer” for changes in fundamental conditions.
Standard & Poor’s 500 Index (S&P 500) is a capitalization-weighted index that is generally considered representative of the U.S. large capitalization market.
S&P Global (SPGI) is a leading American provider of financial information, analytics, and credit ratings, headquartered in New York, NY. It operates major divisions including S&P Global Ratings, S&P Global Market Intelligence, S&P Global Commodity Insights, S&P Global Mobility, and S&P Dow Jones Indices.
The ICE BofA U.S. High Yield Index is an unmanaged index that tracks the performance of U.S. dollar denominated, below investment-grade rated corporate debt publicly issued in the U.S. domestic market.
The S&P 500 Growth measures constituents from the S&P 500 that are classified as growth stocks based on three factors: sales growth, the ratio of earnings change to price, and momentum.
The S&P 500 Value Index measures constituents from the S&P 500 that are classified as value stocks based on three factors: the ratios of book value, earnings and sales to price.
The S&P 500 Equal Weight Index is the equal-weight version of the widely regarded Standard & Poor’s 500 Index, which is generally considered representative of the U.S. large capitalization market. The index has the same constituents as the capitalization-weighted S&P 500, but each company in the index is allocated a fixed weight of 0.20% at each quarterly rebalancing.
The WCA Rising Dividend Custom Benchmark is a rules-based benchmark constructed by Washington Crossing Advisors to represent a universe of large capitalization U.S. companies that meet certain quality and dividend growth criteria, including proprietary screens for profitability, earnings consistency, and balance sheet strength, along with minimum market capitalization and dividend growth requirements. The benchmark is reconstituted and rebalanced quarterly and is intended to serve as a style-appropriate benchmark for the WCA Rising Dividend strategy.
The Washington Crossing Advisors’ High Quality Index and Low Quality Index are objective, quantitative measures designed to identify quality in the top 1,000 U.S. companies. Ranked by fundamental factors, WCA grades companies from “A” (top quintile) to “F” (bottom quintile). Factors include debt relative to equity, asset profitability, and consistency in performance. Companies with lower debt, higher profitability, and greater consistency earn higher grades. These indices are reconstituted annually and rebalanced daily. For informational purposes only, and WCA Quality Grade indices do not reflect the performance of any WCA investment strategy.
The risk of loss in trading commodities and futures can be substantial. You should therefore carefully consider whether such trading is suitable for you in light of your financial condition. The high degree of leverage that is often obtainable in commodity trading can work against you as well as for you. The use of leverage can lead to large losses as well as gains.
The information contained herein has been prepared from sources believed to be reliable but is not guaranteed by us and is not a complete summary or statement of all available data, nor is it considered an offer to buy or sell any securities referred to herein. Opinions expressed are subject to change without notice and do not take into account the particular investment objectives, financial situation, or needs of individual investors. There is no guarantee that the figures or opinions forecast in this report will be realized or achieved. Employees of Stifel, Nicolaus & Company, Incorporated or its affiliates may, at times, release written or oral commentary, technical analysis, or trading strategies that differ from the opinions expressed within. Past performance is no guarantee of future results. Indices are unmanaged, and you cannot invest directly in an index.
Asset allocation and diversification do not ensure a profit and may not protect against loss. There are special considerations associated with international investing, including the risk of currency fluctuations and political and economic events. Changes in market conditions or a company’s financial condition may impact a company’s ability to continue to pay dividends, and companies may also choose to discontinue dividend payments. Investing in emerging markets may involve greater risk and volatility than investing in more developed countries. Due to their narrow focus, sector-based investments typically exhibit greater volatility. Small-company stocks are typically more volatile and carry additional risks since smaller companies generally are not as well established as larger companies. Property values can fall due to environmental, economic, or other reasons, and changes in interest rates can negatively impact the performance of real estate companies. When investing in bonds, it is important to note that as interest rates rise, bond prices will fall. High-yield bonds have greater credit risk than higher-quality bonds. Bond laddering does not assure a profit or protect against loss in a declining market. The risk of loss in trading commodities and futures can be substantial. You should therefore carefully consider whether such trading is suitable for you in light of your financial condition. The high degree of leverage that is often obtainable in commodity trading can work against you as well as for you. The use of leverage can lead to large losses as well as gains. Changes in market conditions or a company’s financial condition may impact a company’s ability to continue to pay dividends, and companies may also choose to discontinue dividend payments.
All investments involve risk, including loss of principal, and there is no guarantee that investment objectives will be met. It is important to review your investment objectives, risk tolerance, and liquidity needs before choosing an investment style or manager. Equity investments are subject generally to market, market sector, market liquidity, issuer, and investment style risks, among other factors to varying degrees. Fixed Income investments are subject to market, market liquidity, issuer, investment style, interest rate, credit quality, and call risks, among other factors to varying degrees.
Beta is a measure of the volatility, or systematic risk, of a security or a portfolio relative to the market as a whole. A beta of one is considered as risky as the benchmark and is therefore likely to provide expected returns approximate to those of the benchmark during both up and down periods. A portfolio with a beta of two would move approximately twice as much as the benchmark.
Standard deviation is a measure of the volatility of a security’s or portfolio’s returns in relation to the mean return. The larger the standard deviation, the greater the volatility of return in relation to the mean return.
Changes in market conditions or a company’s financial condition may impact a company’s ability to continue to pay dividends, and companies may also choose to discontinue dividend payments
This commentary often expresses opinions about the direction of market, investment sector, and other trends. The opinions should not be considered predictions of future results. The information contained in this report is based on sources believed to be reliable, but is not guaranteed and not necessarily complete.
The securities discussed in this material were selected due to recent changes in the strategies. This selection criterion is not based on any measurement of performance of the underlying security.
Washington Crossing Advisors, LLC is a wholly-owned subsidiary and affiliated SEC Registered Investment Adviser of Stifel Financial Corp (NYSE: SF). Registration with the SEC implies no level of sophistication in investment management.


