The AI Investment Boom And The Profit Cycle
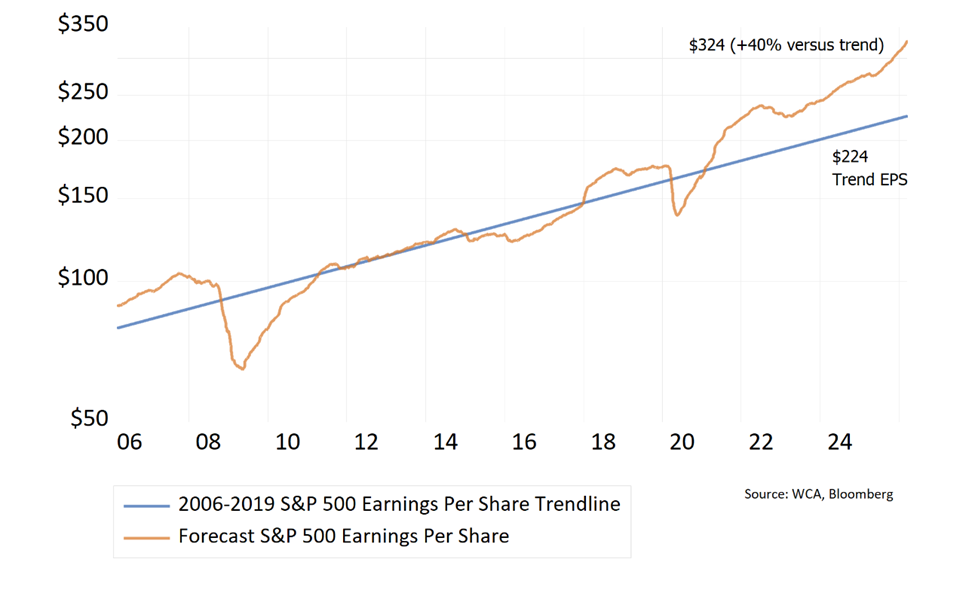
It is now all about earnings. Surging capital spending has been the main driver of profit expectations and the stock market. Despite all the worry about oil, Iran, stagflation, and AI Disruption, the forward view of earnings is still strong and the S&P 500 trades at a higher than average multiple of expected earnings. Since earnings growth has driven about two-thirds of the gain in the S&P 500 post 2019 and almost all of the gain since the end of 2024, what happens over the upcoming earnings season should be of utmost importance (see Chart A). Expectations are high as analysts are looking to extend the profit growth winning streak to six straight double-digit EPS gains in a row.
Chart A: S&P 500 Earnings Forecasts vs Trend
Investment in Capital Expenditures as Driver
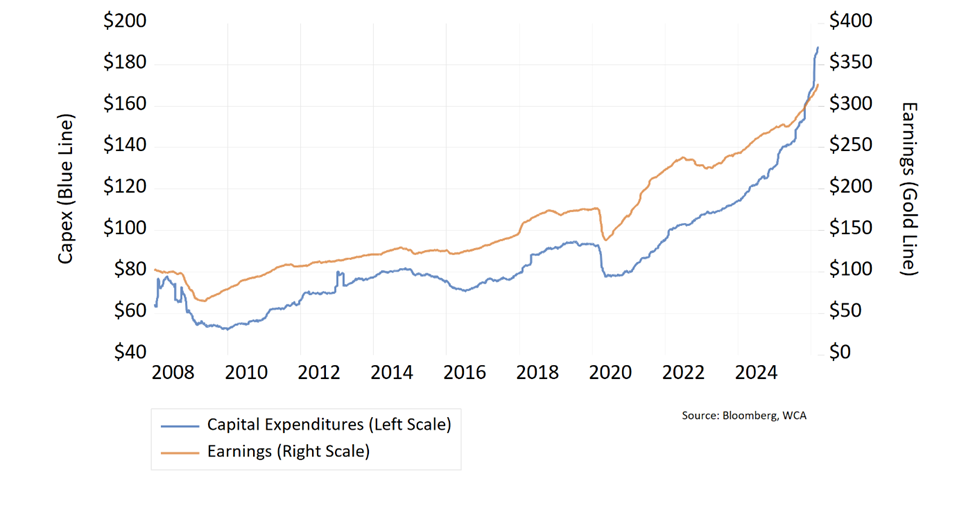
It is abundantly clear that spending on artificial intelligence and related infrastructure is reshaping the landscape. Since the launch of ChatGPT in 2022, capital expenditures on datacenters, energy infrastructure, and semiconductors have exploded (chart B, below). Global technology spending growth was over 12% last year, one of the strongest growth levels in the past 25-30 years, according to S&P Global. As businesses spend to expand, these capex dollars are recycled into profits because investment by one company becomes revenue for another, turning spending on data centers, semiconductors, and power infrastructure into profits across corporate America. Capital spending feeds the profit cycle, reinforcing expectations for growth, and fosters the risk appetite necessary to fund investments. Surging investment in artificial intelligence is driving the cycle today much like railroads did in the late 1800s, electrification did in the 1920s, and the internet did in the 1990s. Each era produced a wave of infrastructure spending that lifted profits across the economy. While AI technology is new, the phenomenon of investment-led profit and credit growth is not.
Chart B: S&P 500 Capital Expenditure Growth Leading Earnings (Profits)
The AI Supercycle and Credit Connection
Increasingly, investments in artificial intelligence require financing beyond operating cash flow. Hyperscalers are increasingly turning to debt and leases to finance AI capacity. Ratings agency S&P Global forecasts the five largest companies in this arena (Amazon, Microsoft, Alphabet, Meta, Oracle) will spend over $700 billion this year, and the present value of hyperscaler lease obligations is also estimated to be near $700 billion. Fortunately, these same companies, in total, produced more gross cash flow than capital expenditures, but the speed of capital deployment, coupled with wide ranging uncertainty about the ultimate profitability of the investments, raise both risk and opportunity.
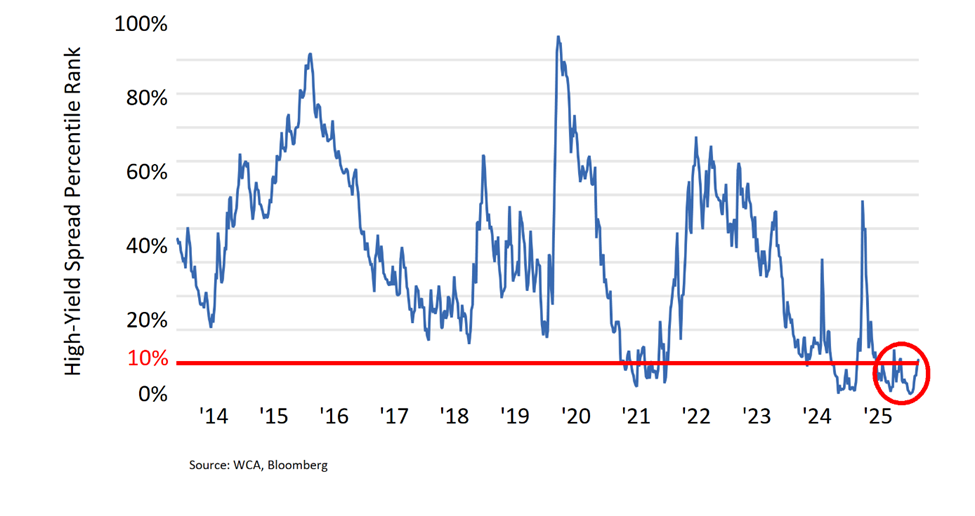
The risk cuts both ways. If a hyperscaler fails to invest enough, it risks falling behind competitors. But if it invests too aggressively, it risks creating excess capacity and writing down investments later. In our view, most CEOs are of the opinion that underinvestment is the bigger risk, which means that risks are likely skewed to producing overcapacity, falling prices, and write-downs once the AI capex Supercycle crests. These developments do not appear priced into credit markets as credit spreads among the highest risk borrowers remain in the lowest decile relative to historic spreads (Chart C, below).
Chart C: High Yield Corporate Spreads in Lowest Decile (Percentile Ranking of OAS High Yield Corporate Bond Spread)
Markets Digesting New Risks
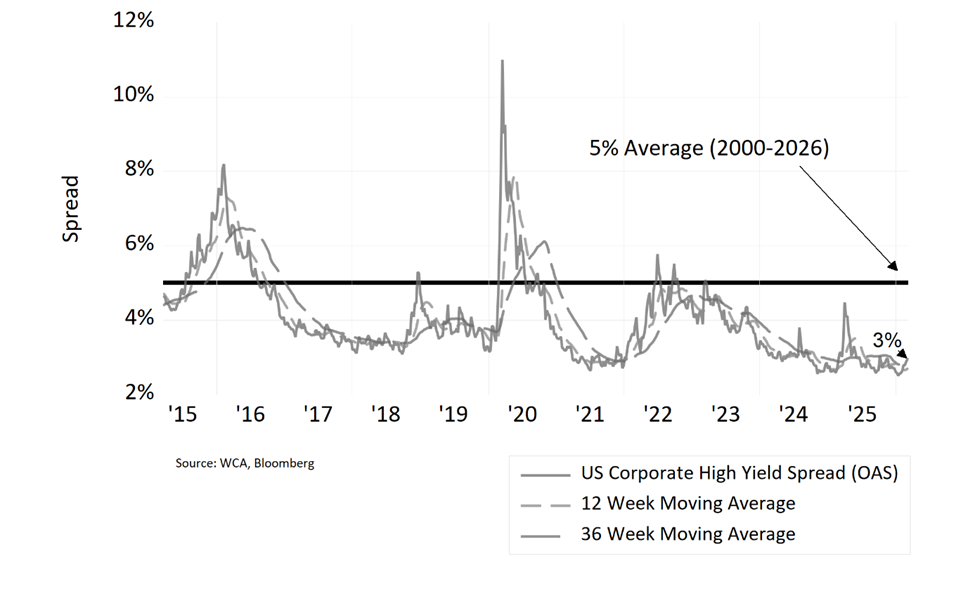
Markets can struggle when investment booms collide with tightening credit conditions. Following a period where confidence has been running exceptionally high, energy and credit are introducing a new risk case. $100+ oil and widening spreads in high yield could throw a monkey wrench into the outlook. This is why the S&P 500 is finding it hard to move to higher ground despite an otherwise good economy. Even before the beginning of the Middle East conflict, which is currently shutting in large amounts of global crude production and shipments, there were signs of pressure in credit markets. As Chart D shows, the spread for high-yield corporate issuers began to rise from record lows in January.
While hard to see in the chart, the spread reached a near record low on January 21st at 2.5%. Today, that spread stands near 3%, a 50 basis-point increase off the lows. While far from a blow-out, the broader credit environment is also showing some sign of pressure. Financial stocks are down 10% since the start of the year, and troubles at fast growing private credit managers are grabbing headlines. Higher quality companies, represented by the WCA High Quality Index, are outperforming lower quality companies, represented by the WCA Low Quality Index, by about 5% year-to-date. It seems investors may be starting to demand higher return for risk.
Chart D: High-Yield Corporate Spreads Tight, But Off Lows
Conclusion
Markets have been driven higher by surging profits, bolstered by surging investment in AI. Even before the troubles in the Middle East became front page news, there were signs that the credit cycle was set to turn. As more companies rely on credit to finance the AI capital spending Supercycle, the AI-Credit nexus has become central to where markets go from here. The next few months will allow companies to show investors how they intend to manage the cycle.
As we have said before, the quality cycle has grown long in the tooth as the past three years’ market returns have been dominated by companies with above average risk and lower quality. We believe the right play now is for investors to look to high quality businesses that are flexible, durable, and predictable. Low debt, profitable assets, and consistency should help in the months ahead. A steady and well covered dividend is also helpful to build a solid portfolio with good defense and offense.
Kevin R. Caron, CFA
Senior Portfolio Manager
973-549-4051
Chad Morganlander
Senior Portfolio Manager
973-549-4052
Steve Lerit, CFA
Head of Portfolio Risk
973-549-4028
Eric Needham
External Sales and Marketing
312-771-6010
Matthew Battipaglia
Portfolio Manager
973-549-4047
Jeffrey Battipaglia
Client Portfolio Manager
973-549-4031
Suzanne Ashley
Internal Relationship Manager
973-549-4168
Disclosures:
WCA Barometer – We regularly assess changes in fundamental conditions to help guide near-term asset allocation decisions. Analysis incorporates approximately 30 forward-looking indicators in categories ranging from Credit and Capital Markets to U.S. Economic Conditions and Foreign Conditions. From each category of data, we create three diffusion-style sub-indices that measure the trends in the underlying data. Sustained improvement that is spread across a wide variety of observations will produce index readings above 50 (potentially favoring stocks), while readings below 50 would indicate potential deterioration (potentially favoring bonds). The WCA Fundamental Conditions Index combines the three underlying categories into a single summary measure. This measure can be thought of as a “barometer” for changes in fundamental conditions.
Standard & Poor’s 500 Index (S&P 500) is a capitalization-weighted index that is generally considered representative of the U.S. large capitalization market.
S&P Global (SPGI) is a leading American provider of financial information, analytics, and credit ratings, headquartered in New York, NY. It operates major divisions including S&P Global Ratings, S&P Global Market Intelligence, S&P Global Commodity Insights, S&P Global Mobility, and S&P Dow Jones Indices.
The ICE BofA U.S. High Yield Index is an unmanaged index that tracks the performance of U.S. dollar denominated, below investment-grade rated corporate debt publicly issued in the U.S. domestic market.
The S&P 500 Growth measures constituents from the S&P 500 that are classified as growth stocks based on three factors: sales growth, the ratio of earnings change to price, and momentum.
The S&P 500 Value Index measures constituents from the S&P 500 that are classified as value stocks based on three factors: the ratios of book value, earnings and sales to price.
The S&P 500 Equal Weight Index is the equal-weight version of the widely regarded Standard & Poor’s 500 Index, which is generally considered representative of the U.S. large capitalization market. The index has the same constituents as the capitalization-weighted S&P 500, but each company in the index is allocated a fixed weight of 0.20% at each quarterly rebalancing.
The WCA Rising Dividend Custom Benchmark is a rules-based benchmark constructed by Washington Crossing Advisors to represent a universe of large capitalization U.S. companies that meet certain quality and dividend growth criteria, including proprietary screens for profitability, earnings consistency, and balance sheet strength, along with minimum market capitalization and dividend growth requirements. The benchmark is reconstituted and rebalanced quarterly and is intended to serve as a style-appropriate benchmark for the WCA Rising Dividend strategy.
The Washington Crossing Advisors’ High Quality Index and Low Quality Index are objective, quantitative measures designed to identify quality in the top 1,000 U.S. companies. Ranked by fundamental factors, WCA grades companies from “A” (top quintile) to “F” (bottom quintile). Factors include debt relative to equity, asset profitability, and consistency in performance. Companies with lower debt, higher profitability, and greater consistency earn higher grades. These indices are reconstituted annually and rebalanced daily. For informational purposes only, and WCA Quality Grade indices do not reflect the performance of any WCA investment strategy.
The risk of loss in trading commodities and futures can be substantial. You should therefore carefully consider whether such trading is suitable for you in light of your financial condition. The high degree of leverage that is often obtainable in commodity trading can work against you as well as for you. The use of leverage can lead to large losses as well as gains.
The information contained herein has been prepared from sources believed to be reliable but is not guaranteed by us and is not a complete summary or statement of all available data, nor is it considered an offer to buy or sell any securities referred to herein. Opinions expressed are subject to change without notice and do not take into account the particular investment objectives, financial situation, or needs of individual investors. There is no guarantee that the figures or opinions forecast in this report will be realized or achieved. Employees of Stifel, Nicolaus & Company, Incorporated or its affiliates may, at times, release written or oral commentary, technical analysis, or trading strategies that differ from the opinions expressed within. Past performance is no guarantee of future results. Indices are unmanaged, and you cannot invest directly in an index.
Asset allocation and diversification do not ensure a profit and may not protect against loss. There are special considerations associated with international investing, including the risk of currency fluctuations and political and economic events. Changes in market conditions or a company’s financial condition may impact a company’s ability to continue to pay dividends, and companies may also choose to discontinue dividend payments. Investing in emerging markets may involve greater risk and volatility than investing in more developed countries. Due to their narrow focus, sector-based investments typically exhibit greater volatility. Small-company stocks are typically more volatile and carry additional risks since smaller companies generally are not as well established as larger companies. Property values can fall due to environmental, economic, or other reasons, and changes in interest rates can negatively impact the performance of real estate companies. When investing in bonds, it is important to note that as interest rates rise, bond prices will fall. High-yield bonds have greater credit risk than higher-quality bonds. Bond laddering does not assure a profit or protect against loss in a declining market. The risk of loss in trading commodities and futures can be substantial. You should therefore carefully consider whether such trading is suitable for you in light of your financial condition. The high degree of leverage that is often obtainable in commodity trading can work against you as well as for you. The use of leverage can lead to large losses as well as gains. Changes in market conditions or a company’s financial condition may impact a company’s ability to continue to pay dividends, and companies may also choose to discontinue dividend payments.
All investments involve risk, including loss of principal, and there is no guarantee that investment objectives will be met. It is important to review your investment objectives, risk tolerance, and liquidity needs before choosing an investment style or manager. Equity investments are subject generally to market, market sector, market liquidity, issuer, and investment style risks, among other factors to varying degrees. Fixed Income investments are subject to market, market liquidity, issuer, investment style, interest rate, credit quality, and call risks, among other factors to varying degrees.
Beta is a measure of the volatility, or systematic risk, of a security or a portfolio relative to the market as a whole. A beta of one is considered as risky as the benchmark and is therefore likely to provide expected returns approximate to those of the benchmark during both up and down periods. A portfolio with a beta of two would move approximately twice as much as the benchmark.
Standard deviation is a measure of the volatility of a security’s or portfolio’s returns in relation to the mean return. The larger the standard deviation, the greater the volatility of return in relation to the mean return.
Changes in market conditions or a company’s financial condition may impact a company’s ability to continue to pay dividends, and companies may also choose to discontinue dividend payments
This commentary often expresses opinions about the direction of market, investment sector, and other trends. The opinions should not be considered predictions of future results. The information contained in this report is based on sources believed to be reliable, but is not guaranteed and not necessarily complete.
The securities discussed in this material were selected due to recent changes in the strategies. This selection criterion is not based on any measurement of performance of the underlying security.
Washington Crossing Advisors, LLC is a wholly-owned subsidiary and affiliated SEC Registered Investment Adviser of Stifel Financial Corp (NYSE: SF). Registration with the SEC implies no level of sophistication in investment management.