50 Years On
The current equity market bull run is the longest on record, but it is just one chapter in a bigger story. This week we look back at the current run in the context of 50 years of strong returns.
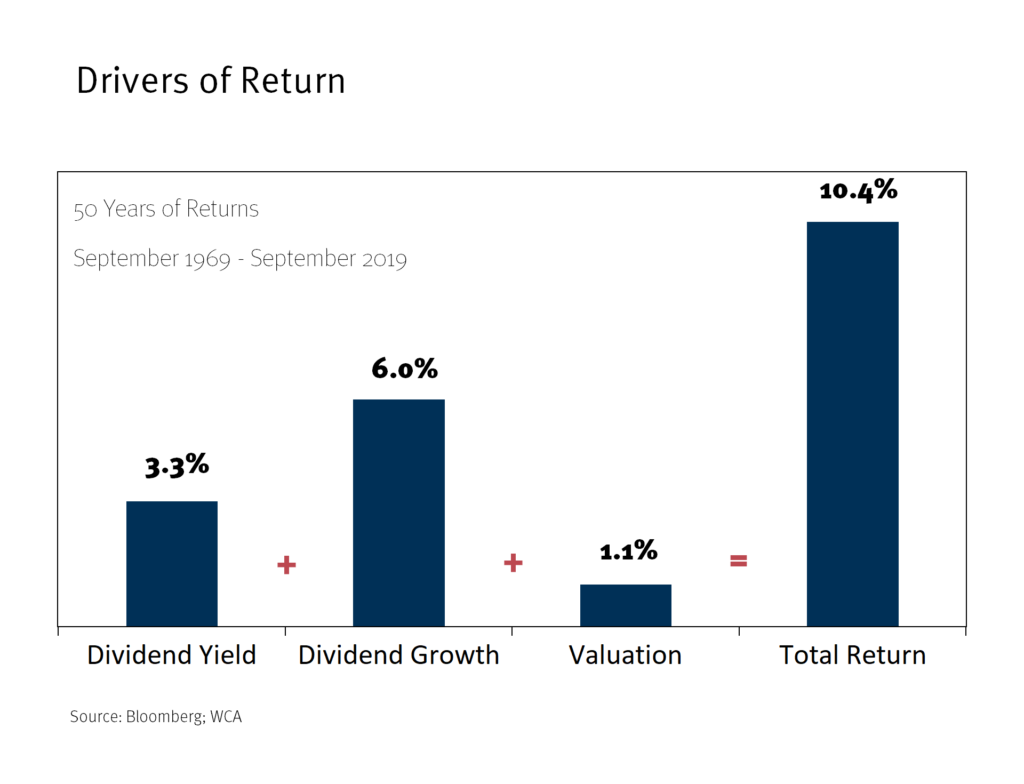
What Drives Return?
Return comes from one of three sources: current yield, growth of income, or changes in valuation. There is no other way to create a return. Take, for example, the S&P Composite index, which traded at $94 in September 1969, some fifty years ago. The index’s dividend was $3.15, implying a then-current dividend yield of 3.3% ($3.15 / $94). The index was “valued” at 30 times that dividend ($94 Index /$3.15 Dividend = 30x). By September 2019, the dividend had grown by 6% per annum to $57.22, and the multiple had grown to about 52x from 30x, or 1.1% per annum. Adding together the 3.3% initial dividend “yield”, 6.0% annualized dividend growth, and 1.1% annualized rise in valuations gets us to the 10.4% annualized total return generated by the index over the 50 years (chart, below). Incidentally, the 10.4% return was about 2.6% higher than the return on long-term U.S. Treasuries, which returned about 8.2% annually.
More Insights
These returns provide interesting insights. First, we see that the past 50-years was very generous to investors in financial markets. The 10.4% return on stocks and the 8.2% return on bonds both easily outpaced 3.9% average inflation. Real returns, net of inflation, were near 7% for equity investors, which meant real wealth doubled just about every 10 years or so for nearly a half-century. Bond investors saw real wealth double about every 16 years, on average.
A second valuable insight is that markets were reasonable in how they priced assets. Markets rated assets in such a way so to provide higher returns to markets that generated greater risk. The extra 2.6% return earned by stocks over bonds for the period, the equity risk premium, was the reward for risk-taking. These results confirm what pioneering academics in the 1960s believed — that markets would generally tend to reward risk-taking with higher returns over the long-run.
Lastly, it is useful to see where returns to stocks came from. About 30% of the gain came from the starting dividend yield (3.3% “yield”/ 10.4% total return). About 10% of the total return came from rising valuations (1.1% growth in multiples / 10.4% total annualized return). But, by far, the most significant component of return came from growth in the dividend which accounted for 60% of return (6.0% annualized growth / 10.4% annualized return). Dividend growth also dominated the return pattern of the past 10 years and the past 20 years, too. From September 1999 to September 2019, growth in the dividend contributed 60% to the equity market’s 5.5% annualized return, and from September 2009 to September 2019, growth in the dividend contributed 90% to the total return for the S&P Composite. Hence, this is the main reason why we focus on dividend growth rather than dividend yield.
Conclusion
Today’s below average dividend yields and above average valuations suggest that future returns will depend heavily on growth in dividends. Rising interest rates could also create headwinds for dividend yield investors. High-yielding equities would tend to behave like bonds and underperform due to rising rates.
History sheds light on what really drives returns over time. We continue to believe that the key “swing factor” for future equity returns rests increasingly on sustainable dividend growth, not just “current yield.” Steady, well-capitalized companies with a track record of increasing dividends still make a good deal of sense to us given today’s backdrop.
Kevin Caron, CFA, Senior Portfolio Manager
Chad Morganlander, Senior Portfolio Manager
Matthew Battipaglia, Portfolio Manager
Steve Lerit, CFA, Client Portfolio Manager
Suzanne Ashley, Analyst
(973) 549-4168
Disclosures
WCA Fundamental Conditions Barometer Description: We regularly assess changes in fundamental conditions to help guide near-term asset allocation decisions. The analysis incorporates approximately 30 forward-looking indicators in categories ranging from Credit and Capital Markets to U.S. Economic Conditions and Foreign Conditions. From each category of data, we create three diffusion-style sub-indices that measure the trends in the underlying data. Sustained improvement that is spread across a wide variety of observations will produce index readings above 50 (potentially favoring stocks), while readings below 50 would indicate potential deterioration (potentially favoring bonds). The WCA Fundamental Conditions Index combines the three underlying categories into a single summary measure. This measure can be thought of as a “barometer” for changes in fundamental conditions.
The information contained herein has been prepared from sources believed to be reliable but is not guaranteed by us and is not a complete summary or statement of all available data, nor is it considered an offer to buy or sell any securities referred to herein. Opinions expressed are subject to change without notice and do not take into account the particular investment objectives, financial situation, or needs of individual investors. There is no guarantee that the figures or opinions forecasted in this report will be realized or achieved. Employees of Stifel, Nicolaus & Company, Incorporated or its affiliates may, at times, release written or oral commentary, technical analysis, or trading strategies that differ from the opinions expressed within. Past performance is no guarantee of future results. Indices are unmanaged, and you cannot invest directly in an index.
Asset allocation and diversification do not ensure a profit and may not protect against loss. There are special considerations associated with international investing, including the risk of currency fluctuations and political and economic events. Investing in emerging markets may involve greater risk and volatility than investing in more developed countries. Due to their narrow focus, sector-based investments typically exhibit greater volatility. Small company stocks are typically more volatile and carry additional risks, since smaller companies generally are not as well established as larger companies. Property values can fall due to environmental, economic, or other reasons, and changes in interest rates can negatively impact the performance of real estate companies. When investing in bonds, it is important to note that as interest rates rise, bond prices will fall. High-yield bonds have greater credit risk than higher-quality bonds. The risk of loss in trading commodities and futures can be substantial. You should therefore carefully consider whether such trading is suitable for you in light of your financial condition. The high degree of leverage that is often obtainable in commodity trading can work against you as well as for you. The use of leverage can lead to large losses as well as gains.
All investments involve risk, including loss of principal, and there is no guarantee that investment objectives will be met. It is important to review your investment objectives, risk tolerance and liquidity needs before choosing an investment style or manager. Equity investments are subject generally to market, market sector, market liquidity, issuer, and investment style risks, among other factors to varying degrees. Fixed Income investments are subject to market, market liquidity, issuer, investment style, interest rate, credit quality, and call risks, among other factors to varying degrees.
This commentary often expresses opinions about the direction of market, investment sector and other trends. The opinions should not be considered predictions of future results. The information contained in this report is based on sources believed to be reliable, but is not guaranteed and not necessarily complete.
Washington Crossing Advisors LLC is a wholly owned subsidiary and affiliated SEC Registered Investment Adviser of Stifel Financial Corp (NYSE: SF).