Weekly Comment
Productivity growth averaged 3% through the 1950s and 1960s, declined to 2% from the mid-1970s through 2007, slid to just over 1% since the 2008-2009 recession, and fell to under 0.5% last year. We are at serious risk of stagnating growth, should this trend continue. In such an environment, tactical approaches will be required as long-run returns would tend to diminish with real growth rates. Currently, we see recession risk above historic averages, given generally weakening global data. This slippage in fundamentals that became more evident in late 2015 contributed to our elevated focus on quality in equity portfolios and more cautious asset allocation posture in recent quarters.
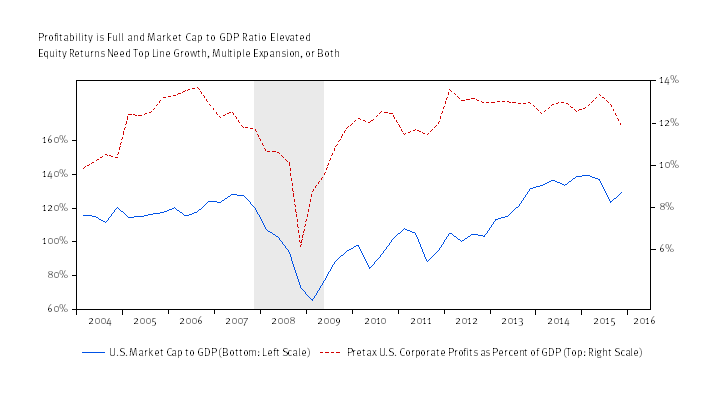
From a macro perspective, we see positive equity returns and excess returns above Treasuries, but we can no longer rely on rising valuations and profitability to enhance those equity returns. The rising profitability and multiples of 2009 to 2013 are behind us, and we believe these return drivers are more likely to revert toward historic averages from here than break out to new highs. As the chart below shows, there has been a steady rise in the value of U.S. equities relative to underlying GDP since 2009’s recession (bottom line). The debt-to-GDP ratio provides a reasonable measure of overall equity valuation (bottom line, left scale), and the profit measure provides a reasonable measure of corporate profitability (top line, right scale). The fact that both of these measures are elevated suggest a headwind pushing against forward-looking equity returns. These headwinds place a greater burden on top-line growth and cash returns as sources of return.
This increased reliance on top-line growth is one reason why the persistent slide in global productivity and growth is of heightened concern. While growth remains slow and steady, there is a steady erosion in the growth rate of productivity and overall global output. These two things are related, in our view, and increase the risk of stagnation the longer the trends persist. While the recent bump in equity prices is helping to remove some of the immediate pressure and “tail risks” to the financial system (commodities look better, credit spreads better, dollar is behaving, etc.), the underlying growth issue remain. A rising chorus of hopeful forecasts is beginning to look beyond the last two quarter’s growth slump to predict a second half bump in growth, however. Maybe this view is right, but it seems heavily dependent on three things: 1) A repeat pattern of the last few years (soft start and strong finish); 2) An extrapolation of increasing risk appetite (underwritten largely by central bank pivoting); and 3) A rebound of activity in China.
The first of these pillars is weak. While it is true that growth in the last couple years has become back loaded in the year, there is not enough data to prove this to be something to expect every year (more wishful than anything, in our view). The second pillar (central bank dovishness) is also difficult given the more recent pickup in core inflation and the ongoing improvement in jobs. The unemployment rate is approaching “full employment,” weekly jobless claims are at prior cyclical trough levels, and underemployment rates are trending ever lower too. The market seems to be betting on a more timid Federal Reserve (Fed) and seems to doubt the Fed’s own forecasts for the future path of interest rates and inflation. With more than 25% of global sovereign debt carrying negative interest rates, attention seems to be turning to whether the Fed will be next to venture into negative rates.
The final pillar of the second half rebound story, China, now seems to be the focus of attention. China contributes mightily to global growth and accounted for roughly 90% of net bank credit expansion since the recession’s end. It also recently enacted stimulus designed to re-enliven property development and sales. With GDP growth below 7%, the Peoples Bank of China recently cut minimum down payments for first-time homeowners to 20% from 25% and to 30% from 40% for second homes. It also enacted six rate cuts since November 2014 and cut reserve requirements for banks, allowing for further expansion of credit. As a result, the one-year change for property prices in Shenzhen, Shanghai, and Beijing are up 57%, 21%, and 13%, respectively. In other smaller cities around the country, however, prices are relatively flat, and a large supply of unsold units remains. Relaxing reserve requirements, reducing transaction costs, and encouraging further borrowing appears central to the recent pickup seen there and the associated jump in some building related commodity prices. We remain concerned, especially given the rapid 125% rise in outstanding Chinese bank credit (debt) that occurred between 2010 and the third quarter 2015 according to data from the Bank of International Settlements. The surge heightens “tail risks” as growth in credit decelerates.
An Update on Global Deleveraging
The same data reveals some interesting trends in debt and the progress toward deleveraging. From a total credit to GDP basis, we see some small progress globally. That ratio now stands at 224% of GDP across all reporting countries. Among the “deleveraging” advanced economies, the ratio dropped to 258% from 270% overall. This “deleveraging” was matched nearly dollar-for-dollar, though, by a “leveraging” of the emerging markets, led by China. Emerging market outstanding credit to GDP swelled to 164% from 141% since 2010 — a lower overall ratio, but exceptionally fast growth. Most of that growth in emerging market bank credit flowed from China. While the total dollar value of global credit rose by $16.3 trillion since the recession, China’s credit outstanding rose by $14.5 trillion, accounting for 90% of the world’s total credit growth. So you can see why China’s growth plans (more “hair of the dog” have contributed to hopes of a better second half global growth profile).
Is there evidence of a China rebound? This is a hard question to answer. There are plenty of legitimate reasons to be skeptical about China’s official statistics and national accounting. Consequently, a series of private surveys and other secondary sources have begun to peer into the inner working of China’s economy. One source even goes so far as to incorporate satellite observation of Chinese manufacturing activity as the basis for analysis! Most recent reports seems to show a mixed bag on China’s turnaround (and clouded by the Lunar New Year). Here is a sample of six recent high-frequency observations on China’s economy (most of these are diffusion indices <50 is contracting, >50 is expanding):
- China Satellite Manufacturing Index (March): Fell to 47.9
- Minxin Purchasing Managers Survey Index (March): Bounce to 43.6 from 41 in February
- China’s Official State Purchasing Manager’s Index (March): Up to 50.2 from 49 in February
- Caixin China Manufacturing Survey (March): Rose to 49.7 from 48 in February
- South Korea Exports (Proxy for China Exports): Down 8.2% in March for the 15th consecutive month (but better than prior month)
- Metals Prices: Recently surged
Conclusion:
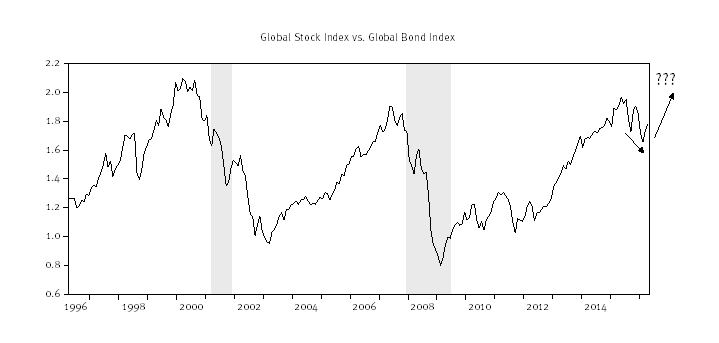
We continue to look for convincing signs of a sustained pickup in growth before concluding that risks have abated. We remain concerned about weakness in our WCA Fundamental Conditions Index (despite the market’s recent run), persistent declines in productivity growth here and elsewhere around the world, the recent decline in profits (both S&P 500 and profits as a percent of GDP), and an increasing correlation on risk premiums and commodities / China. This said, we are not backing away from our discipline, which is to focus on the data and follow what it is telling us. The recent bounce in stocks relative to bonds has not altered the overall view of risk versus safe assets (graph below) or the overall trajectory for growth. We continue to carry a 5% underweight in stocks with an increased weighting on bonds.
Recession Case: Continued very low growth trends, coupled with falling profits, create elevated risk of a curtailment of business investment and increase the odds of recession (versus baseline) in the next 12-24 months.
Expansion Case: A rebound in growth, such as that implied by many forecasters later this year, would be a welcome shift in the broader growth trends.
LONG-RUN STRATEGIC POSTURE: Our macro outlook is for slow growth and stubbornly low inflation. The start of policy normalization following years of zero interest rate policy in the United States comes at a time of weakening global growth and mixed signals from the domestic economy. We continue to view the United States economy as best positioned to weather the overall weak global environment that resurfaced in 2015.
Disclaimer
The information contained herein has been prepared from sources believed to be reliable but is not guaranteed by us and is not a complete summary or statement of all available data, nor is it considered an offer to buy or sell any securities referred to herein. Opinions expressed are subject to change without notice and do not take into account the particular investment objectives, financial situation, or needs of individual investors. There is no guarantee that the figures or opinions forecasted in this report will be realized or achieved. Employees of Stifel, Nicolaus & Company, Incorporated or its affiliates may, at times, release written or oral commentary, technical analysis, or trading strategies that differ from the opinions expressed within. Past performance is no guarantee of future results. Indices are unmanaged, and you cannot invest directly in an index.
Asset allocation and diversification do not ensure a profit and may not protect against loss. There are special considerations associated with international investing, including the risk of currency fluctuations and political and economic events. Investing in emerging markets may involve greater risk and volatility than investing in more developed countries. Due to their narrow focus, sector-based investments typically exhibit greater volatility. Small company stocks are typically more volatile and carry additional risks, since smaller companies generally are not as well established as larger companies. Property values can fall due to environmental, economic, or other reasons, and changes in interest rates can negatively impact the performance of real estate companies. When investing in bonds, it is important to note that as interest rates rise, bond prices will fall. High-yield bonds have greater credit risk than higher quality bonds. The risk of loss in trading commodities and futures can be substantial. You should therefore carefully consider whether such trading is suitable for you in light of your financial condition. The high degree of leverage that is often obtainable in commodity trading can work against you as well as for you. The use of leverage can lead to large losses as well as gains.
The WCA Fundamental Conditions Barometer measures the breadth of changes to a wide variety of fundamental data. The barometer measures the proportion of indicators under review that are moving up or down together. A barometer reading above 50 generally indicates a more bullish environment for the economy and equities, and a lower reading implies the opposite. Quantifying changes this way helps us incorporate new facts into our near-term outlook in an objective and unbiased way. More information on the barometer is found in our latest quarterly report, available at www.washingtoncrossingadvisors.com/insights.html.