WCA’s Unique Approach to Quality

Many managers use textbook financial ratios such as return on equity, debt to equity, and earnings per share variability to evaluate the quality and value of a company. However, these metrics can be easily manipulated by a company’s management and misused by index providers and rating agencies. For example, the return on equity ratio can be increased overnight by issuing debt and using it to buy back stock rather than investing in the business to promote growth. This can create an illusion of higher profitability without actually improving the company’s business operations.
Distortions Caused by Share Buybacks
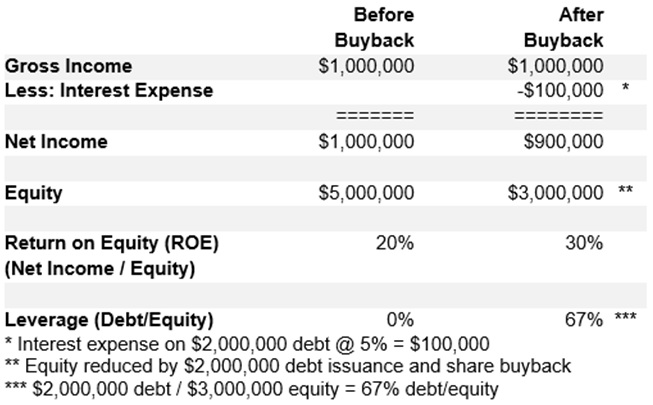
To better understand this concept, let’s take a look at Acme, Inc., a fictional firm, which generates $1,000,000 in net income and has $5,000,000 in shareholder’s equity for a 20% return on equity ($1,000,000 / $5,000,000 = 20%). If Acme’s management team issues $2,000,000 in debt at 5% and buys back shares worth $2,000,000, the ROE ratio increases to 30% from 20% (see table below). However, this strategy does not contribute to the company’s profitability and can even have negative effects. The addition of debt reduces net income by the interest expense and increases the leverage on the company’s balance sheet.
Acme, Inc. – Calculation of Return on Equity (ROE)
Effect on Benchmark Indices
The widespread use of share repurchases not only distort measures like ROE (above), but also the price-to-book ratios used to assign stocks to popular growth or value benchmark indices. By extension, investors who manage to these benchmarks should realize they could potentially be misled. Moreover, this is not a small and obscure accounting issue affecting relatively few firms. The impact of share repurchases on equity measures is a widespread issue and growing in importance.
According to Yardini Research, S&P 500 companies have repurchased $852 billion in stock in the past year. When stock is repurchased, the sum total of all repurchased shares shows up as an item called “treasury stock” on a firm’s balance sheet. This amount is subtracted from retained earnings, which reduces shareholder equity. As of the latest quarter, Bloomberg data shows 125 of the top 500 largest companies in the United States have significant treasury stock (greater than 10% of the market value of outstanding stock) on their books. Moreover, 40 of the 500 largest publicly traded companies in the United States show negative equity on their balance sheet. This creates a major challenge in calculating price-to-shareholder equity ratios, which is the primary tool for forming the ubiquitous value and growth style benchmark indices.
And index providers’ method for dealing with negative equity just makes matters worse. One major provider, according to their own index construction methodology, makes no attempt to adjust the misleading accounting measurement of equity value. Instead, they assign a price to equity ratio “proxy” by arbitrarily substituting an average industry or sector ratio in place of the company’s actual ratio. This makes little sense to us, which is one more reason why we adjust the data.
A last issue with buybacks is the way it tends to focus on bottom-line per share figures, often obscuring the “bigger picture.” The lead story in yesterday morning’s Wall Street Journal, for example, announces that “Corporate Earnings Estimates Edge Up.” The story says S&P 500 profits are expected to be up 0.5% for the third quarter and 1.2% for the whole year. However, what the article misses is that, in aggregate, total earnings are not growing. This is because share repurchases have created the illusion of growth that is not really there.
Rating Agencies Misfire on “Quality”
Many managers rely heavily on rating agencies to assess quality. However, these assessments have been called into question in the past. During the 2008-2009 financial crisis, credit rating agencies were subject to criticism for their failure to accurately and promptly recognize failures at some of the nation’s largest financial institutions (Lehman Brothers, AIG, Fannie Mae, and Bear Stearns come to mind). As recently as last year, the Security and Exchange Commission (SEC) charged S&P Global Ratings with conflict of interest violations over ratings for jumbo residential mortgages. And earlier this year, rating agencies again failed to anticipate trouble at formerly investment grade rated Silicon Valley, Signature, and First Republic banks. Within days of the first signs of trouble, these companies’ ratings were downgraded to junk and subsequently withdrawn.
Such inconsistency in ratings actions and poor track record calls into question the methodology used by rating agencies when assessing quality. For this reason, we do our own work in assessing quality rather than relying on ratings by credit rating agencies.
A Different Perspective
At Washington Crossing Advisors, we take a different perspective when measuring quality and value. We evaluate the entire firm and not just easily manipulated bottom-line metrics like return on equity or changes in earnings per share. Instead, we measure total profits (not per share) relative to a firm’s assets (not equity), before leverage effects, to ensure a business is profitable and growing. We also measure the consistency of that overall profitability when measuring consistency and predictability. We find changes in earnings per share susceptible to manipulation, thereby reducing the usefulness of the measurement. A whole-firm approach, and not an equity-per-share approach, is less prone to mislead investors who seek to better understand quality and value. Therefore, such broad measures are the basis of WCA’s approach to measuring fundamentals assessing quality, growth, or value.
Next time we will discuss how we incorporate these measures into a process for structuring quality and value oriented equity portfolios. For now, we hope to raise awareness of avoiding the use of overly simple metrics and shortcuts when evaluating quality.