The Real Reason Growth is So Slow
THE WEEK AHEAD
The Federal Open Market Committee (FOMC) conducts their March meeting on Tuesday and Wednesday. Growth overseas remains sub-par, but U.S. consumer spending is stronger and monthly job gains are up 235,000 over the last six months. Signs of moderate inflation can are evident in the personal consumption expenditures price index. This index rose 1.3% year-over-year in January.
MACRO VIEW
All the churn in markets during the first quarter had little impact on our assessment of fundamentals. Our WCA Fundamental Conditions Barometer remains below 50 and portfolios are defensively allocated. The latest actions by the European Central Bank (ECB) are lifting sentiment, but we are mindful that there are limits to central bank policy. Changes in the money supply, asset purchases designed to target the value of risk assets, and negative interest rates all have failed to boost underlying growth and productivity.
Consider the charts below, for example. They depict basic trends in workforce and productivity growth over two time periods. The first two charts below show growth in the U.S. labor force and growth in U.S. productivity from 1946 to 1999. Labor force grew a robust 1.9% per year and productivity grew near 1.7%, on average, during that period. Adding these two figures together supports real growth in output near 3.6% — roughly what the government estimates real growth in output actually was over that period. Moreover, the workforce grew rapidly through the 1960s into the 1980s as women and the baby boom generation entered the workforce. Productivity continued a steady climb from the 1940s through the 1990s, dipping during recessions and rebounding during recoveries.
Things changed following the 1990s. The workforce grew more slowly (trend growth of just 0.6%) and productivity growth declined to 1.3%. These levels support a slower pace of growth near 1.9% (0.6% labor growth plus 1.3% productivity growth). This is exactly in line with the 1.9% average real U.S. GDP growth seen since 1999 and helps explain why the expansion has been so weak.
Looking ahead, we expect to see these trends improve. We made no changes to our long-run growth expectation during the quarter. We continue to forecast long-run real growth near 2.5% (give or take 0.5%) over our forecast horizon.
U.S. Labor Force and Productivity Trends: 1946-1999
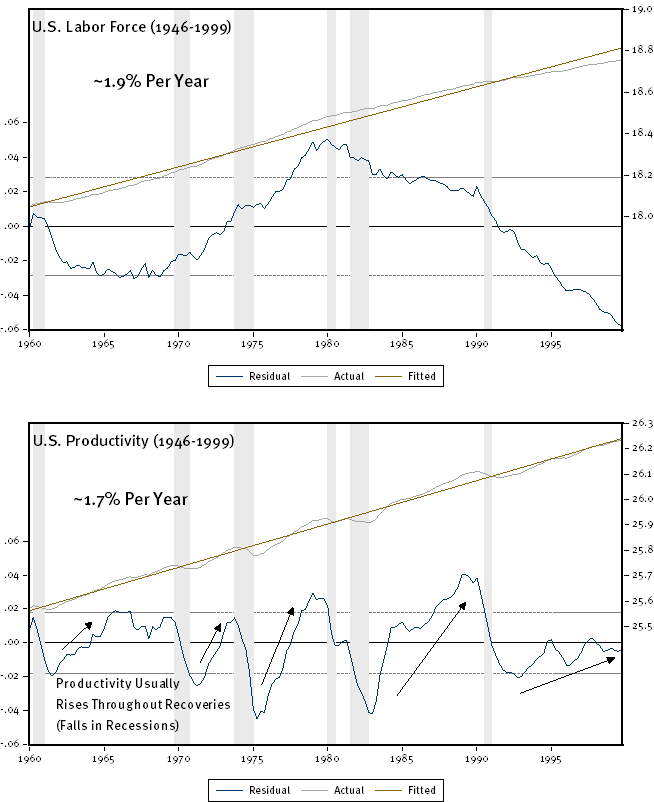
Source: Department of Labor
U.S. Labor Force and Productivity Trends: 1999-2015
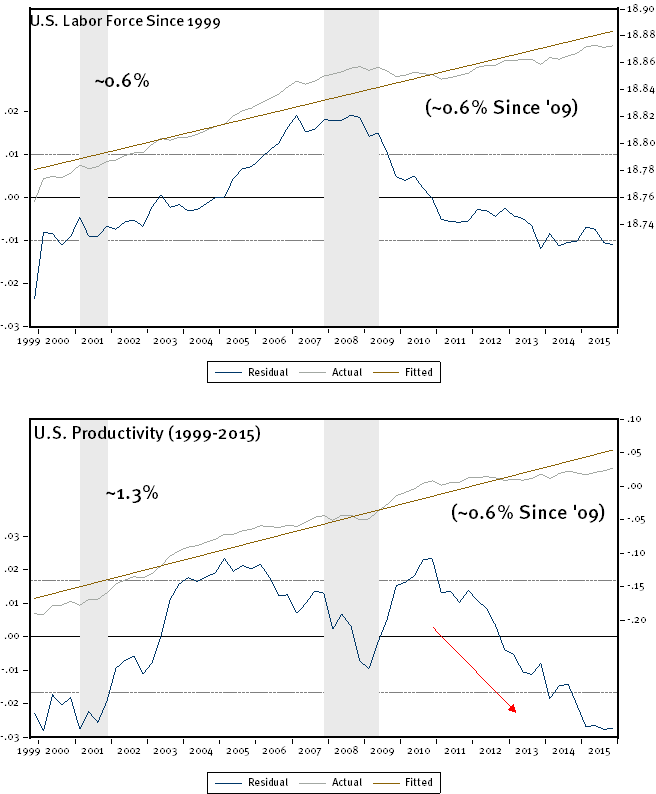
Source: Department of Labor
Barometer Update
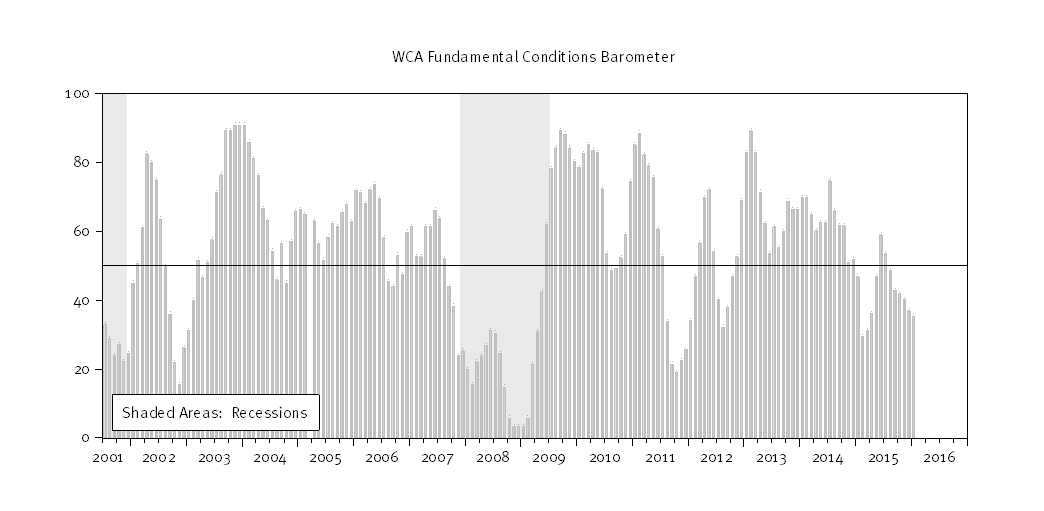
Amid the backdrop of slower secular growth, our WCA Fundamental Conditions Barometer remains below 50 (see below). We are aware that some improvement in the last couple of weeks can be seen in market sentiment, but other data has yet to confirm the improvement. One positive takeaway from the first quarter shakeout has been an adjustment in valuations and profitability to more normal levels. Our long-run forecast equity returns now stand near 6.4% versus a 5.75% expectation at the start of the year. Less drag from normalization of profit margins and valuations account for most of the improvement in the forward view.
In order for us to become more constructive and boost equity exposure, we need to see a sustained pickup in fundamental conditions materialize through the lens of our fundamental analysis. As of this writing, we are not sufficiently convinced that turn is yet in place. Accordingly, we continue to maintaining a relatively conservative portfolio stance.
ASSET ALLOCATION PORTFOLIO POSTURE
LONG-RUN STRATEGIC POSTURE: Our macro outlook is for slow growth and stubbornly low inflation. The start of policy normalization following years of zero interest rate policy in the United States comes at a time of weakening global growth and mixed signals from the domestic economy. We continue to view the United States economy as best positioned to weather the overall weak global environment that resurfaced in 2015.
Kevin Caron, Portfolio Manager
Chad Morganlander, Portfolio Manager
Matthew Battipaglia, Analyst
Suzanne Ashley, Junior Analyst
(973) 549-4052
www.washingtoncrossingadvisors.com
The information contained herein has been prepared from sources believed to be reliable but is not guaranteed by us and is not a complete summary or statement of all available data, nor is it considered an offer to buy or sell any securities referred to herein. Opinions expressed are subject to change without notice and do not take into account the particular investment objectives, financial situation, or needs of individual investors. There is no guarantee that the figures or opinions forecasted in this report will be realized or achieved. Employees of Stifel, Nicolaus & Company, Incorporated or its affiliates may, at times, release written or oral commentary, technical analysis, or trading strategies that differ from the opinions expressed within. Past performance is no guarantee of future results. Indices are unmanaged, and you cannot invest directly in an index.
Asset allocation and diversification do not ensure a profit and may not protect against loss. There are special considerations associated with international investing, including the risk of currency fluctuations and political and economic events. Investing in emerging markets may involve greater risk and volatility than investing in more developed countries. Due to their narrow focus, sector-based investments typically exhibit greater volatility. Small company stocks are typically more volatile and carry additional risks, since smaller companies generally are not as well established as larger companies. Property values can fall due to environmental, economic, or other reasons, and changes in interest rates can negatively impact the performance of real estate companies. When investing in bonds, it is important to note that as interest rates rise, bond prices will fall. High-yield bonds have greater credit risk than higher quality bonds. The risk of loss in trading commodities and futures can be substantial. You should therefore carefully consider whether such trading is suitable for you in light of your financial condition. The high degree of leverage that is often obtainable in commodity trading can work against you as well as for you. The use of leverage can lead to large losses as well as gains.
The WCA Fundamental Conditions Barometer measures the breadth of changes to a wide variety of fundamental data. The barometer measures the proportion of indicators under review that are moving up or down together. A barometer reading above 50 generally indicates a more bullish environment for the economy and equities, and a lower reading implies the opposite. Quantifying changes this way helps us incorporate new facts into our near-term outlook in an objective and unbiased way. More information on the barometer is found in our latest quarterly report, available at www.washingtoncrossingadvisors.com/insights.html.