Some Improvement
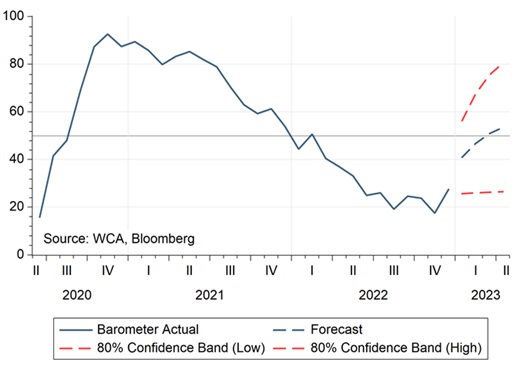
We are starting to see some light at the end of the tunnel. The stock market is up for the year, inflation has begun to decelerate, and the labor market shows continued strength. These positive signals push back against the recession and inflation story that hung over markets for most of the past year. The improved backdrop is also reflected in our WCA Barometer (chart A, below). While the current forecast reading of 48 (the blue dotted line) is not robust, it is anticipating some stability and lift after a long downward slide. While the lift could prove fleeting, it could also take root, paving the way for some positive momentum. The bottom line is that we see a shift in data that lifts our outlook from decidedly negative to something of a mixed bag.
Chart A – WCA Barometer
Accordingly, we again boosted equity exposure this month for tactically allocated, top-down portfolios. For individual stock portfolios based on bottom-up fundamentals, we continue to focus on consistent, highly profitable, low-debt companies trading at reasonable prices. However, just because we see some tentative signs of improvement, we are not throwing caution to the wind. A few critical headwinds are still with us, and these require continued vigilance.
Three Headwinds
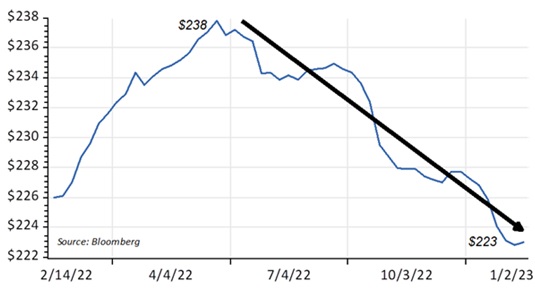
First, the profit picture is darkening. Every week since June, forecast S&P 500 profits have fallen (Chart B), and there is no reason to think this trend will soon change. In past down-cycles, profit forecasts end up anywhere from 15-40% lower and write-offs are common. To date, forecasts are only down about 5% and have yet to show signs of perking up.
Chart B – S&P 500 Forecast Operating Earnings
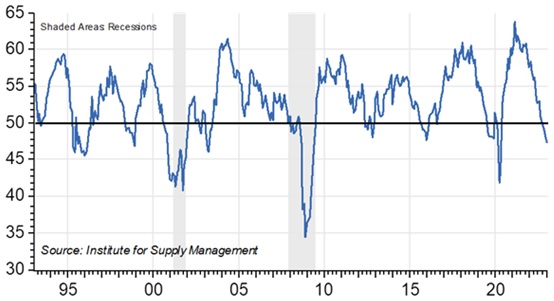
Second, there is no compelling sign that the economy is rebounding yet. The January purchasing manager’s index, a very good leading indicator for the economy, is at 47 – a level generally consistent with low or negative near-term growth. Other indicators like pending home sales (-34% year-over-year) and new housing starts (-18% year-over-year) paint a similar picture of weakening demand in important areas of the economy.
Chart C – U.S. Purchasing Manager’s Manufacturing Survey
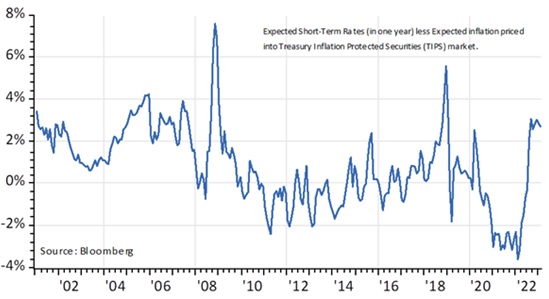
Third, the fall in inflation rate, coupled with prospects for further rate increases, means policy has gotten more restrictive, not less. We see this in higher real interest rates, which can act as a brake on growth and risk appetite. The chart below shows the sharp rise in rates using a forward-looking concept, subtracting market inflation expectations from market-implied interest rate expectations a year from now. While the market got excited about prospects for a turnaround by the Federal Reserve (Fed) a couple weeks back, last week’s hot employment report casts some doubt on such a turnaround by the Fed. Since policy works with a lag, it is likely that the cumulative impact of tightening has not yet been fully felt in the economy.
Chart D – Real Short-Term Interest Rates
Given all this, we think our portfolios are well positioned relative to our goal of prudent long-run focused management. The investment process is intact, but has room to adapt, and is forward-looking. Should the economy, earnings, risk-appetite, and interest-rates demonstrate further improvement, we are prepared to lean into risk. On the other hand, if January’s rally proves short-lived, and conditions do not improve as hoped, we are also prepared to pare back risk.