Monday Morning Minute 021218
THE WEEK AHEAD
MACROECONOMIC INSIGHT
The drop in stocks from January 26 erased 10% from the market averages. There have been at least two dozen declines of 10% or better over the last 30-years, to put things in perspective. Very few other indicators show a spreading of concern into other areas of the markets or the economy. In the past week, corporate credit spreads remained unchanged; forecast inflation was down only slightly; and S&P 500 earnings forecasts rose. Investors can take some comfort in knowing that a broader reading of the market’s “tea leaves” continues to point toward growth.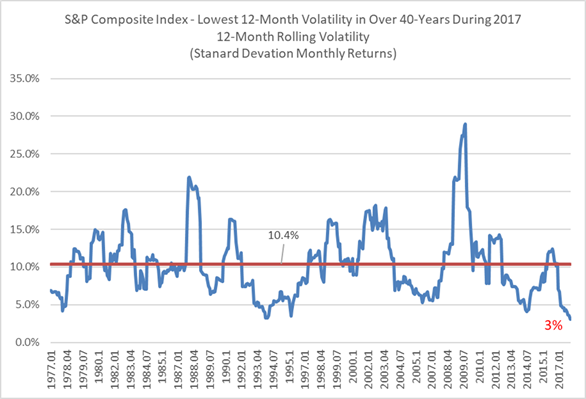
Source: Bloomberg; WCA
If the last couple week’s market action seems surprising, it might be because there has been so little disruption recently. To measure just how quiet things had become, we measured the market’s 12-month volatility over the past 40 years (chart, below). As you can see, 2017 saw the lowest volatility of any 12-month period in over 40 years. The annualized monthly volatility for the S&P 1500 Composite index was 3% in 2017, compared to a 10% historic average. Since volatility has a tendency to average out over time, a swing to the upside in the measure shouldn’t be seen as unusual.
It is especially important at times like these to recognize that risk is part of the investing process. Without it, higher rates of return would not be possible either, because risk and return are related. Most of the time, rockiness in financial markets is short-lived and should be taken in stride. Sometimes, a haphazard disturbance can unsteady an otherwise sound environment for a longer time. There is a strong tendency for markets to right themselves so long as underlying growth trends remain intact.
Over the next few weeks we will be looking at how rising stock market volatility may be impacting other aspects of the economy. For now, we see few signs of systemic impacts from the correction. If, on the other hand, we see a persistent downturn in a wider variety of indicators, we will look to pare back risk. Falling inflation, a flattening yield curve, widening credit spreads, cuts in profit forecasts, drops in output, rising layoffs, and increased consumer pessimism all could raise concerns over a longer downturn. As of today, there is no evidence that any of these trends are yet taking hold despite the recent pickup in volatility.
ECONOMIC DATA THIS WEEK
| Date | Report | Period | Survey | Prior |
| Monday, Feb 12: | Treasury Budget | Jan | -$23.2B | |
| Tuesday, Feb 13: | NFIB Small Business Optimism Index | Jan | 104.9 | |
| Wednesday, Feb 14: | Consumer Price Index M/M | Jan | 0.1% | |
| Consumer Price Index Y/Y | Jan | 2.1% | ||
| CPI Ex Food and Energy M/M | Jan | 0.3% | ||
| CPI Ex Food and Energy Y/Y | Jan | 1.8% | ||
| Retail Sales M/M | Jan | 0.4% | ||
| Retail Sales Ex Autos M/M | Jan | 0.4% | ||
| Retail Sales Ex Autos and Gas | Jan | 0.4% | ||
| Business Inventories | Dec | 0.4% | ||
| Thursday, Feb 15: | Weekly Jobless Claims | 2/10 | 221K | |
| Philadelphia Fed Business Outlook Survey | Feb | 22.2 | ||
| Producer Price Index M/M | Jan | -0.1% | ||
| Producer Price Index Y/Y | Jan | 2.6% | ||
| PPI Ex Food and Energy M/M | Jan | -0.1% | ||
| PPI Ex Food and Energy Y/Y | Jan | 2.3% | ||
| PPI Ex Food, Energy, Trade M/M | Jan | 0.1% | ||
| PPI Ex Food, Energy, Trade Y/Y | Jan | 2.3% | ||
| Industrial Production M/M | Jan | 0.9% | ||
| Industrial Manufacturing M/M | Jan | 0.1% | ||
| Capacity Utilization Rate | Jan | 77.9% | ||
| NAHB Housing Market Index | Feb | 72 | ||
| Empire State Manufacturing Survey | Feb | 17.7 | ||
| Friday, Feb 16: | Housing Starts | Jan | 1.19M | |
| Consumer Sentiment | Feb | 95.7 | ||
| Import Prices M/M | Jan | 0.1% | ||
| Export Prices M/M | Jan | -0.1% | ||
| Import Prices Y/Y | Jan | 3.0% | ||
| Export Prices Y/Y | Jan | 2.6% | ||
| Source: Bloomberg |
ASSET ALLOCATION PORTFOLIO POSTURE
Based on shorter-term expectations, the “tactical satellite” allocation within portfolios is:
Overweight Stocks vs. Bonds
Kevin Caron, CFA, Senior Portfolio Manager
Chad Morganlander, Senior Portfolio Manager
Matthew Battipaglia, Portfolio Manager
Suzanne Ashley, Analyst
(973) 549-4052
______________________________________________________________________________________________________________________________________
Disclosures
WCA Fundamental Conditions Barometer Description: We regularly assess changes in fundamental conditions to help guide near-term asset allocation decisions. The analysis incorporates approximately 30 forward-looking indicators in categories ranging from Credit and Capital Markets to U.S. Economic Conditions and Foreign Conditions. From each category of data, we create three diffusion-style sub-indices that measure the trends in the underlying data. Sustained improvement that is spread across a wide variety of observations will produce index readings above 50 (potentially favoring stocks), while readings below 50 would indicate potential deterioration (potentially favoring bonds). The WCA Fundamental Conditions Index combines the three underlying categories into a single summary measure. This measure can be thought of as a “barometer” for changes in fundamental conditions.
The information contained herein has been prepared from sources believed to be reliable but is not guaranteed by us and is not a complete summary or statement of all available data, nor is it considered an offer to buy or sell any securities referred to herein. Opinions expressed are subject to change without notice and do not take into account the particular investment objectives, financial situation, or needs of individual investors. There is no guarantee that the figures or opinions forecasted in this report will be realized or achieved. Employees of Stifel, Nicolaus & Company, Incorporated or its affiliates may, at times, release written or oral commentary, technical analysis, or trading strategies that differ from the opinions expressed within. Past performance is no guarantee of future results. Indices are unmanaged, and you cannot invest directly in an index.
Asset allocation and diversification do not ensure a profit and may not protect against loss. There are special considerations associated with international investing, including the risk of currency fluctuations and political and economic events. Investing in emerging markets may involve greater risk and volatility than investing in more developed countries. Due to their narrow focus, sector-based investments typically exhibit greater volatility. Small company stocks are typically more volatile and carry additional risks, since smaller companies generally are not as well established as larger companies. Property values can fall due to environmental, economic, or other reasons, and changes in interest rates can negatively impact the performance of real estate companies. When investing in bonds, it is important to note that as interest rates rise, bond prices will fall. High-yield bonds have greater credit risk than higher-quality bonds. The risk of loss in trading commodities and futures can be substantial. You should therefore carefully consider whether such trading is suitable for you in light of your financial condition. The high degree of leverage that is often obtainable in commodity trading can work against you as well as for you. The use of leverage can lead to large losses as well as gains.
All investments involve risk, including loss of principal, and there is no guarantee that investment objectives will be met. It is important to review your investment objectives, risk tolerance and liquidity needs before choosing an investment style or manager. Equity investments are subject generally to market, market sector, market liquidity, issuer, and investment style risks, among other factors to varying degrees. Fixed Income investments are subject to market, market liquidity, issuer, investment style, interest rate, credit quality, and call risks, among other factors to varying degrees.
This commentary often expresses opinions about the direction of market, investment sector and other trends. The opinions should not be considered predictions of future results. The information contained in this report is based on sources believed to be reliable, but is not guaranteed and not necessarily complete.
The securities discussed in this material were selected due to recent changes in the strategies. This selection criteria is not based on any measurement of performance of the underlying security.
Washington Crossing Advisors LLC is a wholly owned subsidiary and affiliated SEC Registered Investment Adviser of Stifel Financial Corp (NYSE: SF).
The S&P 100 Index, a sub-set of the S&P 500, is a market capitalization-weighted index that measures the performance of large cap companies in the United States. The Index comprises 100 major, blue chip companies across multiple industry groups.
The S&P Composite 1500 Index, is an index of U.S. stocks that includes all companies in the S&P 500, S&P 400, and S&P 600. This index covers 90% of the market capitalization of U.S. stocks. It is designed for investors seeking to replicate the performance of the U.S. equity market or benchmark against a representative universe of tradable stocks.