Growth Slows and Caution Increases in 2015
This week, data on industrial production, housing starts, and consumer prices are expected. Industrial production has recently been weak, and consumer prices are advancing below the Federal Reserve’s (Fed) 2% target.
Macro View
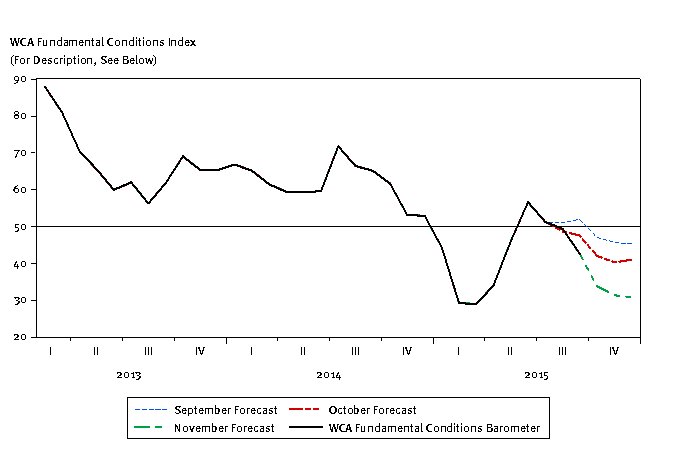
The WCA Fundamental Conditions Barometer indicates a softening of growth through the last three months. Following August’s volatility spike, the forecasted path for our barometer was ratcheted down incrementally. Currently, we see the barometer trending toward the 30-40 range in the months ahead (graph below). Not surprisingly, equity markets and most economic forecasters are adjusting to a lower expected global growth rate. The August and September spike in volatility impacted our assessment of trends in risk appetite and growth in foreign markets. The re-introduction of growth concerns, coupled with at least a temporary rise in risk aversion, is putting downward pressure on our estimated path for the WCA Fundamental Conditions barometer as we head toward year’s end.
Growth Slows and Caution Increases in 2015
The average monthly reading for several important indicators of growth and corporate health have been flat to negative this year. For example, the average monthly spread between a Baa rated corporate bond1 and the 10-year U.S. Treasury is 210 basis points (2.1%) versus 156 basis (1.56%) points last year. This could indicate some increased greater concern over the potential of corporate defaults, possibly as the result of stress in the energy sector or large amounts of net new issuance. The long-run inflation rate priced into the Treasury Inflation-Protected Securities (TIPS) market is averaging 1.7% versus 2.1% last year. This might indicate that markets are less confident the central bank will achieve their stated inflation target than they were a year ago. Similarly, the yield curve is less steep than a year ago, as the average monthly spread between short- and long-term Treasury yields fell to 210 basis points (2.1%) so far this year from 250 basis points (2.5%) last year. Maybe most relevant is the fact that the average aggregate forecasted 12-month earnings figure for the S&P 500 is $124.54 for the first nine months of this year compared to an average forecast across all of 2014 of $124.73, according to Bloomberg. By this measure, there has been essentially zero growth in expected aggregate S&P 500 earnings this year. Last year, forecasts increased about 7% throughout the year.
Some of this slippage is attributable to weaker global growth. Some can be blamed on a stronger dollar and preparation for the Fed’s anticipated “liftoff” for short-term interest rates (now widely expected to happen next month). A difficult year for energy and commodity producers clearly had an impact at the sector level. Whatever the cause, there was a clear reduction in the pace of fundamental improvement throughout the year. To the extent these are one-time adjustments, the coming months could shape up to be a period of improvement. On the plus side, we continue to see employment grow above near 2% compared to year-ago levels, and final demand remains relatively strong. Wages have begun to firm, somewhat; at the same time, fewer people are dropping out of the labor force and more people are returning to it. We are hopeful the final months of 2015 will show some pickup that can carry us into 2016. Until we have more data, however, to support such a turn, we remain relatively cautious and are keeping equity risk exposure near or slightly below our neutral long-run asset allocation targets.
Earnings Update
It has been widely reported by the financial media that the quarterly earnings for the S&P 500 were down for a second quarter. FactSet Research estimates that S&P 500 total earnings will be down 1.8% in the third quarter from a year ago and revenue will be down 4%. However, if energy were excluded from the calculation, the full-year earnings growth would leap to 6.9% on 1.9% revenue growth. With the earnings season nearly complete (90% of S&P 500 companies have reported), the results for most were better than the aggregate figures suggest.
1 Moody’s Baa Corporate Bond Yield
What is the WCA Fundamental Conditions Barometer? The WCA Fundamental Conditions Barometer above measures the breadth of changes to a wide variety of fundamental data. The barometer measures the proportion of indicators under review that are moving up or down together. A barometer reading above 50 generally indicates a more bullish environment for the economy and equities, and a lower reading implies the opposite. Quantifying changes this way helps us incorporate new facts into our near-term outlook in an objective and unbiased way. More information on the barometer is found in our latest quarterly report, available at www.washingtoncrossingadvisors.com/insights.html.
Asset Allocation Portfolio Posture
LONG-RUN STRATEGIC POSTURE: Strategic allocations are set to reflect our long-run forecasts for key asset classes. We expect policy rates to remain low as central banks continue to push lower-for-longer rate strategies. Eventually, rates should rise back to more normal levels, but this is expected to happen gradually and unevenly. Fixed income returns are expected to lag current yields as rates rise. Equity returns will track moderate growth in global GDP with little to no further lift from margin expansion (margins are already elevated). Equity valuations appear reasonable and in line with historic multiples, so no additional return is being attributed to margin expansion.
The information contained herein has been prepared from sources believed to be reliable but is not guaranteed by us and is not a complete summary or statement of all available data, nor is it considered an offer to buy or sell any securities referred to herein. Opinions expressed are subject to change without notice and do not take into account the particular investment objectives, financial situation, or needs of individual investors. There is no guarantee that the figures or opinions forecasted in this report will be realized or achieved. Employees of Stifel, Nicolaus & Company, Incorporated or its affiliates may, at times, release written or oral commentary, technical analysis, or trading strategies that differ from the opinions expressed within. Past performance is no guarantee of future results. Indices are unmanaged, and you cannot invest directly in an index.
Asset allocation and diversification do not ensure a profit and may not protect against loss. There are special considerations associated with international investing, including the risk of currency fluctuations and political and economic events. Investing in emerging markets may involve greater risk and volatility than investing in more developed countries. Due to their narrow focus, sector-based investments typically exhibit greater volatility. Small company stocks are typically more volatile and carry additional risks, since smaller companies generally are not as well established as larger companies. Property values can fall due to environmental, economic, or other reasons, and changes in interest rates can negatively impact the performance of real estate companies. When investing in bonds, it is important to note that as interest rates rise, bond prices will fall. High-yield bonds have greater credit risk than higher quality bonds. The risk of loss in trading commodities and futures can be substantial. You should therefore carefully consider whether such trading is suitable for you in light of your financial condition. The high degree of leverage that is often obtainable in commodity trading can work against you as well as for you. The use of leverage can lead to large losses as well as gains.