Earnings and Valuations
Earnings season continues. According to FactSet, analyst expectations are for another decline (approximately -5% )in second quarter earnings, but forward earnings expectations are firming up. The Fed meets this week — no rate change expected.
Earnings and Valuations Focus
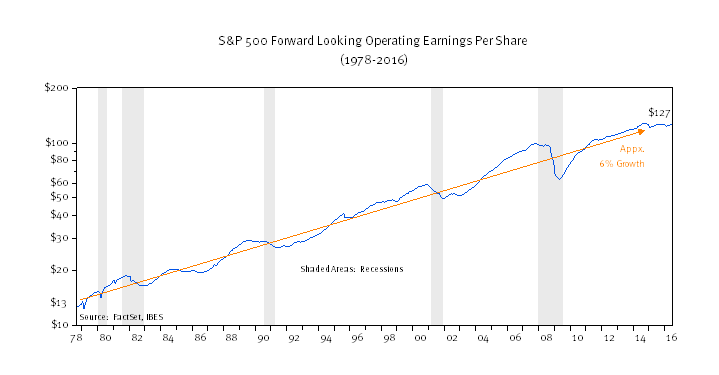
The rally of the last several sessions is being helped by a firming of earnings forecasts. Just how much improvement in earnings is expected, and what will the market be willing to pay for those earnings? According to FactSet, analysts increased their forward 12-month S&P 500 operating earnings number to $127 in June from $124 back in February. Viewed in a longer-term perspective, we see that the run to $127 of earnings closely tracked the U.S. economy’s overall growth from 1978 (Chart A below). Earnings and the economy (GDP) both expanded at nearly the same 6% annualized pace over the 1978-2016 period. Since earnings are the primary driver of stock prices, and the economy is the primary driver of corporate earnings, we can simply say that the economy is the single most important driver for long-run stock returns. Of course, there were setbacks along the way. Recessions did occur and earnings temporarily fell in each and every instance, before rebounding to even higher levels. The amount investors were willing to pay for a dollar of earnings (“the earnings multiple”) also fluctuated over time. However, the important story remains the tremendous growth in S&P 500 index earnings over the past 38 years.
Chart A
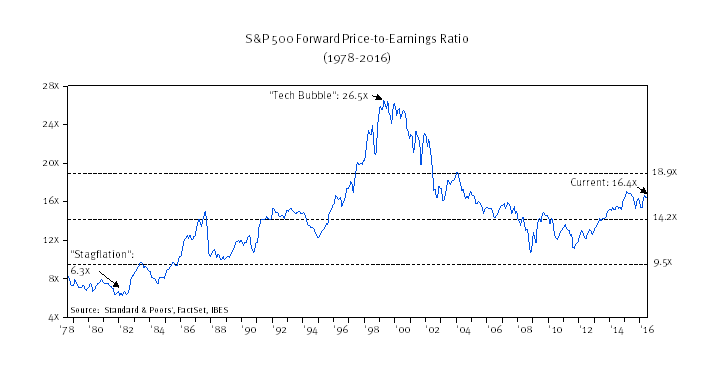
What the market pays for a dollar of earnings at different points along the way is a different question. Earnings “multiples” (the index price divided by the earnings) ranged from a low of 6.3x in the early 1980s to 26.5x in the 1990s tech bubble (Chart B, below). The average multiple was 14.2x, and 9.5x to 18.9x can be thought of as a “normal range” for multiples over the period. Currently, we stand at 16.4x earnings — 15% above average. By this measure, the market is pricey but not extraordinarily so.
Chart B
But what effect do multiples have on performance? Although past performance is not a guarantee of future results, we decided to compare multiples with the market’s return over the ensuing five years (Chart C, below). Because the S&P 500 total return index begins in 1988, we use 1988 as our starting year in making this graph. The downward sloping line in the chart below demonstrates that when multiples in the past were high (moving to the right along the horizontal bottom axis), the realized annual return over the next five years (the vertical left axis) tended to be lower. When multiples were above 20x, the forward return tended to be low or negative. When multiples were in the low teens, returns that followed tended to be better.
Chart C
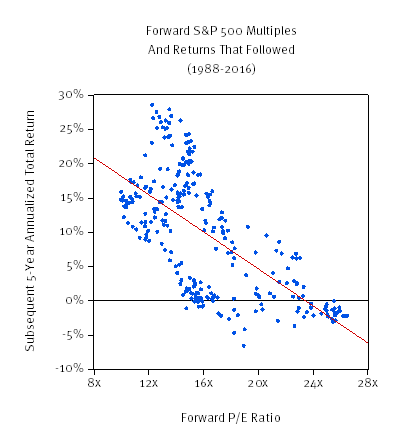
What is clear in the chart above is the simple fact that valuations matter. However, multiples are not the most important long-run drivers for returns. That honor still goes to the economy. This is why the economy is the center of so much investor attention.
Still, valuations are important and we pay close attention to these as well. At 16.4x earnings, we envision some reversion toward a mean multiple over time. This will likely impart a small penalty to long-run returns, but this penalty is offset by growth and a cash return in the form of dividends and net buybacks. We are also reminded that, at 1.6%, 10-year U.S. Treasury bonds don’t offer much in the way of a competitive return.
ECONOMIC RELEASES THIS WEEK
| Date | Report | Period | Survey | Prior |
| Monday, July 25: | Dallas Fed Manf. Survey | July | -10.0 | -18.3 |
| Tuesday, July 26: | FOMC Meeting Begins | |||
| New Home Sales M/M | June | 1.6% | -6.0% | |
| S&P Case-Shiller HPI 20-city, SA – M/M | May | — | 0.5% | |
| S&P Case-Shiller HPI 20-city, NSA – M/M | May | — | 1.1% | |
| S&P Case-Shiller HPI 20-city, NSA – Y/Y | May | — | 5.4% | |
| Consumer Confidence | July | 95.5 | 98.0 | |
| Wednesday, July 27: | FOMC Meeting Announcement | |||
| Durable Goods: New Orders – M/M | June | — | -2.2% | |
| Durable Goods: New Orders – Y/Y | June | — | 3.2% | |
| Durable Goods: Ex-transportation – M/M | June | — | -0.3% | |
| Durable Goods: Ex-transportation – Y/Y | June | — | -0.4% | |
| Core Capital Goods – M/M change | June | — | -0.7% | |
| Core Capital Goods – Y/Y change | June | — | -3.6% | |
| Pending Home Sales Index M/M | June | 1.2% | -3.7% | |
| Pending Home Sales Index Y/Y | June | — | 2.4% | |
| Thursday, July 28: | Weekly Jobless Claims | July 23 | — | 253 K |
| Advance Goods Trade Balance | June | -$60.8 B | -$60.6 B | |
| Friday, July 22: | Real GDP – Q/Q change – SAAR | 2Q2016 | 2.5% | 1.1% |
| Employment Cost Index | 2Q2016 | 0.6% | 0.6% | |
| Chicago PMI | July | 54.6 | 56.8 | |
| Consumer Sentiment | July | 90.5 | 89.5 |
ASSET ALLOCATION PORTFOLIO POSTURE
LONG-RUN STRATEGIC POSTURE: Our long-run forecasts lead us to overweight large cap domestic growth stocks, high-yield corporate bonds, and gold in the diversified “core” of portfolios. Underweight positions in “core” are long-term U.S. Treasuries, foreign developed equities, and REITs. Meanwhile the equity allocation in the short-term tactical “satellite” portion of portfolios was increased to 40% equity / 60% fixed income from 33% equity / 66% fixed income. Mid-year rebalancing took place at the end of June to reflect updated long-run forecasts.
Kevin Caron, Portfolio Manager
Chad Morganlander, Portfolio Manager
Matthew Battipaglia, Analyst
Suzanne Ashley, Junior Analyst
(973) 549-4052
The information contained herein has been prepared from sources believed to be reliable but is not guaranteed by us and is not a complete summary or statement of all available data, nor is it considered an offer to buy or sell any securities referred to herein. Opinions expressed are subject to change without notice and do not take into account the particular investment objectives, financial situation, or needs of individual investors. There is no guarantee that the figures or opinions forecasted in this report will be realized or achieved. Employees of Stifel, Nicolaus & Company, Incorporated or its affiliates may, at times, release written or oral commentary, technical analysis, or trading strategies that differ from the opinions expressed within. Past performance is no guarantee of future results. Indices are unmanaged, and you cannot invest directly in an index.
Asset allocation and diversification do not ensure a profit and may not protect against loss. There are special considerations associated with international investing, including the risk of currency fluctuations and political and economic events. Investing in emerging markets may involve greater risk and volatility than investing in more developed countries. Due to their narrow focus, sector-based investments typically exhibit greater volatility. Small company stocks are typically more volatile and carry additional risks, since smaller companies generally are not as well established as larger companies. Property values can fall due to environmental, economic, or other reasons, and changes in interest rates can negatively impact the performance of real estate companies. When investing in bonds, it is important to note that as interest rates rise, bond prices will fall. High-yield bonds have greater credit risk than higher quality bonds. The risk of loss in trading commodities and futures can be substantial. You should therefore carefully consider whether such trading is suitable for you in light of your financial condition. The high degree of leverage that is often obtainable in commodity trading can work against you as well as for you. The use of leverage can lead to large losses as well as gains.
The WCA Fundamental Conditions Barometer measures the breadth of changes to a wide variety of fundamental data. The barometer measures the proportion of indicators under review that are moving up or down together. A barometer reading above 50 generally indicates a more bullish environment for the economy and equities, and a lower reading implies the opposite. Quantifying changes this way helps us incorporate new facts into our near-term outlook in an objective and unbiased way. More information on the barometer is found in our latest quarterly report, available at www.washingtoncrossingadvisors.com/insights.html.
www.washingtoncrossingadvisors.com