Low-Quality Leadership Fading Fast

What comes around goes around. What has been going on for the past few years may now be coming to an end. From the pandemic lows of March 2020, low-quality stocks rode a wave of liquidity that is now receding. The roughly $5 trillion of new money creation, and the transfer payments that followed, encouraged risk-taking. After taking a beating at the onset of the pandemic, low-quality stocks suddenly became en vogue after March 2020. From that bottom, low-quality stocks rose 170%, as high-quality stocks rose 104%. But this situation now is going the other way.
The Situation Now
The zero percent interest rate available to borrowers and investors after March 2020 is gone. The five trillion of assets bought by the Federal Reserve after 2020 are now running off. By almost any measure, the policy is now restrictive. Failure of some banks in March this year foreshadows tightening lending standards ahead. And while spreads on corporate bonds appear reasonable, there are mounting fears about festering commercial real estate problems.
We define quality based on profitability, consistency, and debt. More profitable and consistent companies with lower debt are considered higher quality. The opposite characteristics constitute low quality in our analysis. On this basis, we form equal-weighted indices and reconstitute them annually using the available data (to avoid look-ahead bias). Companies above average on our three criteria are considered “pure” high quality. Low-quality companies are below average on the three criteria.
The risk-on “party” that low-quality shares enjoyed from March 2020 – March 2023 appears to be winding down. Since then, the WCA Pure Low-Quality Index is down -5.4% and the WCA Pure High-Quality Index is up 4.7%. This 10.1% differential favoring high quality reflects a “reversion to the mean” and removal of easy money policies. Markets are now tilting away from higher risk, low quality toward higher quality.
The “Quality” Cycle
This cycle is nothing new. It is rooted in credit dynamics and is easily seen in Chart A below. Notice the much wilder low-quality (gold line) swings versus high-quality (blue). The pattern of large swings accompanies changes in the economy and credit conditions. The slow-but-steady option of higher quality offers a better ride when adjusting for risk.
Chart A
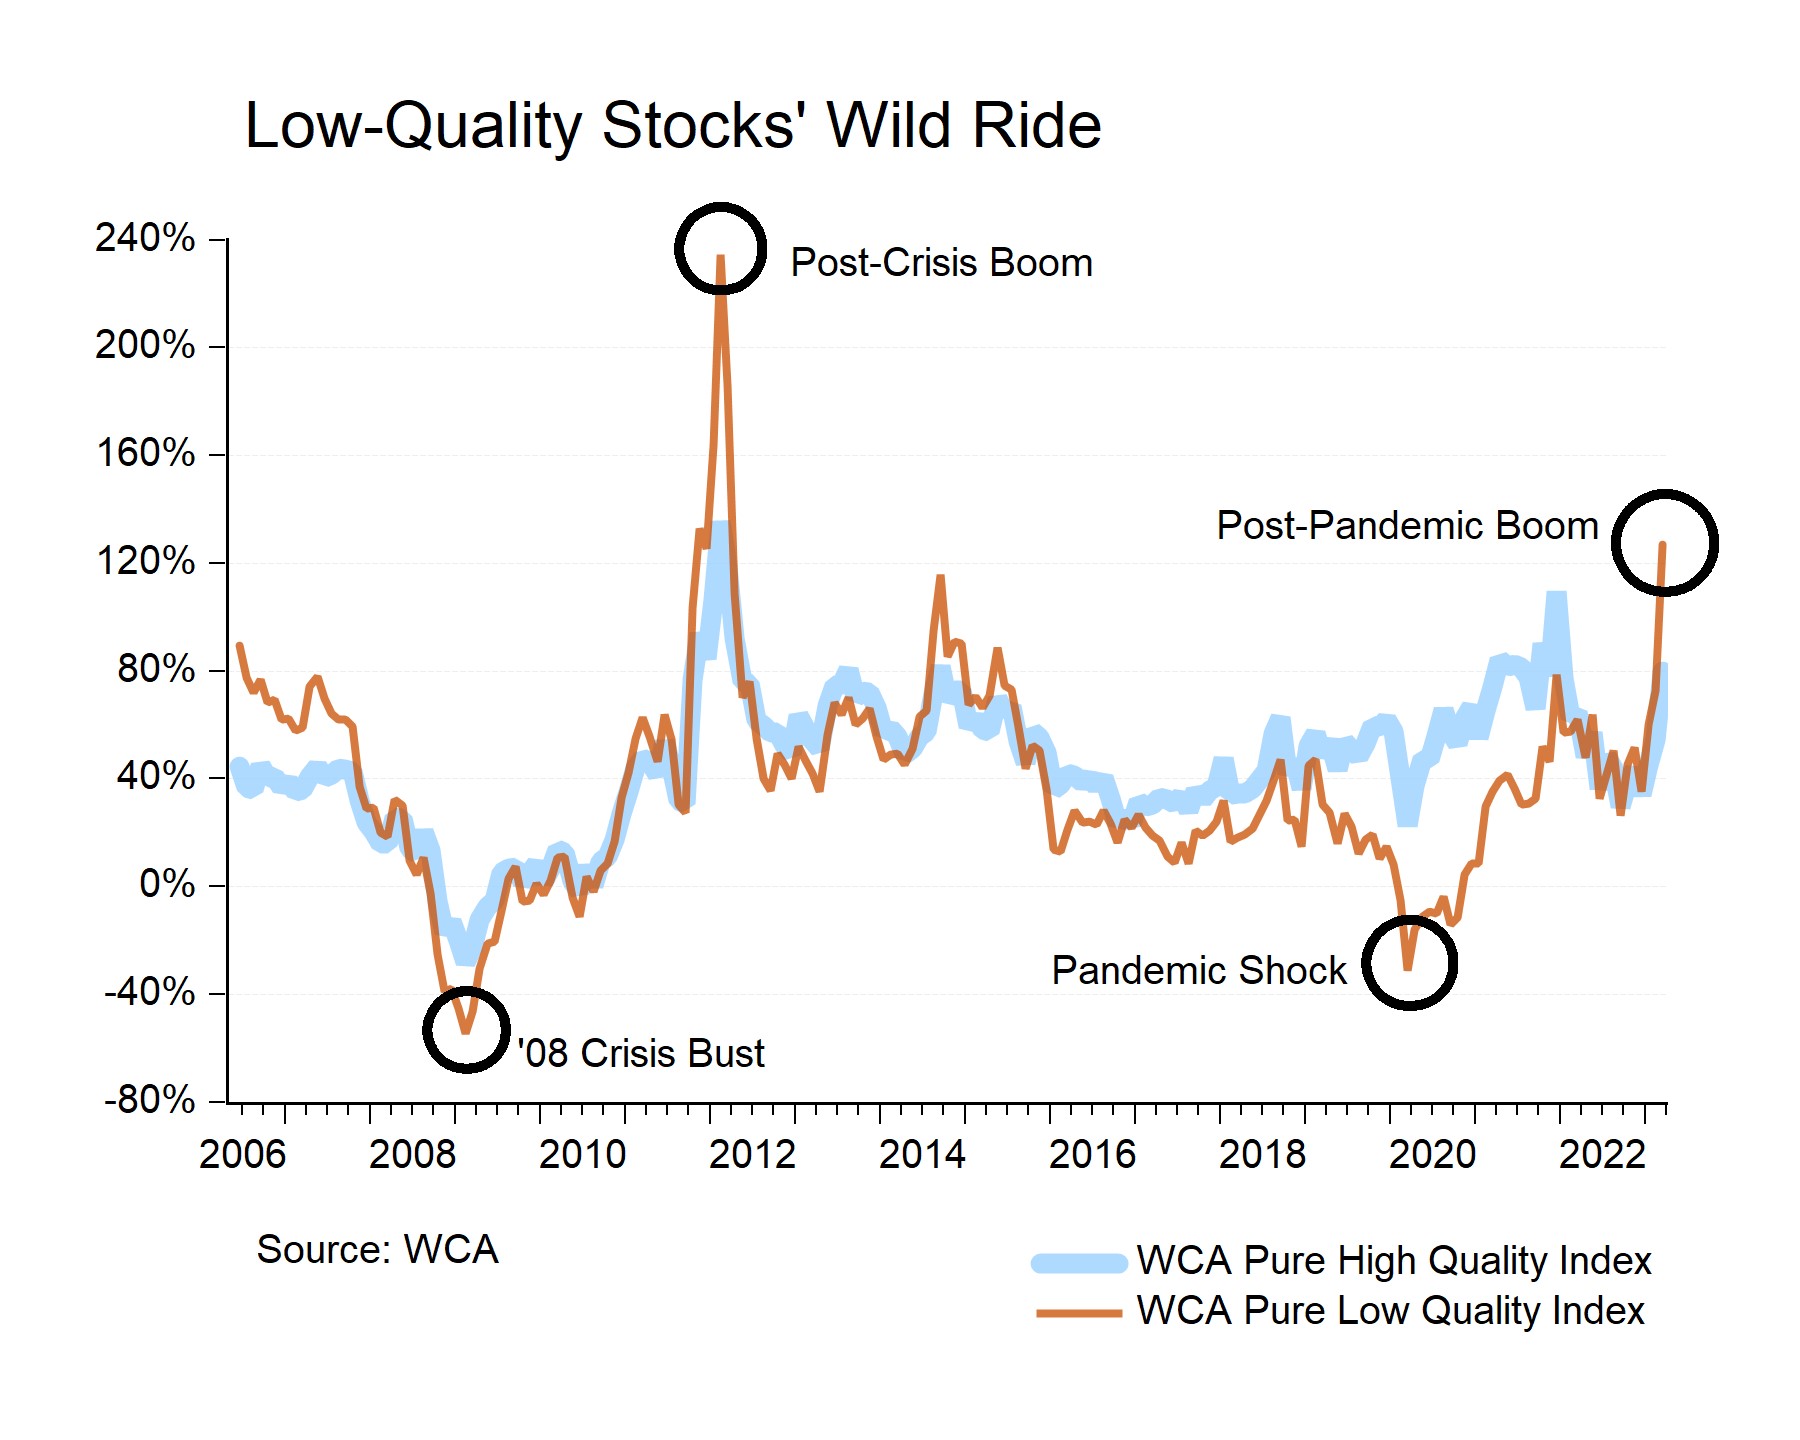
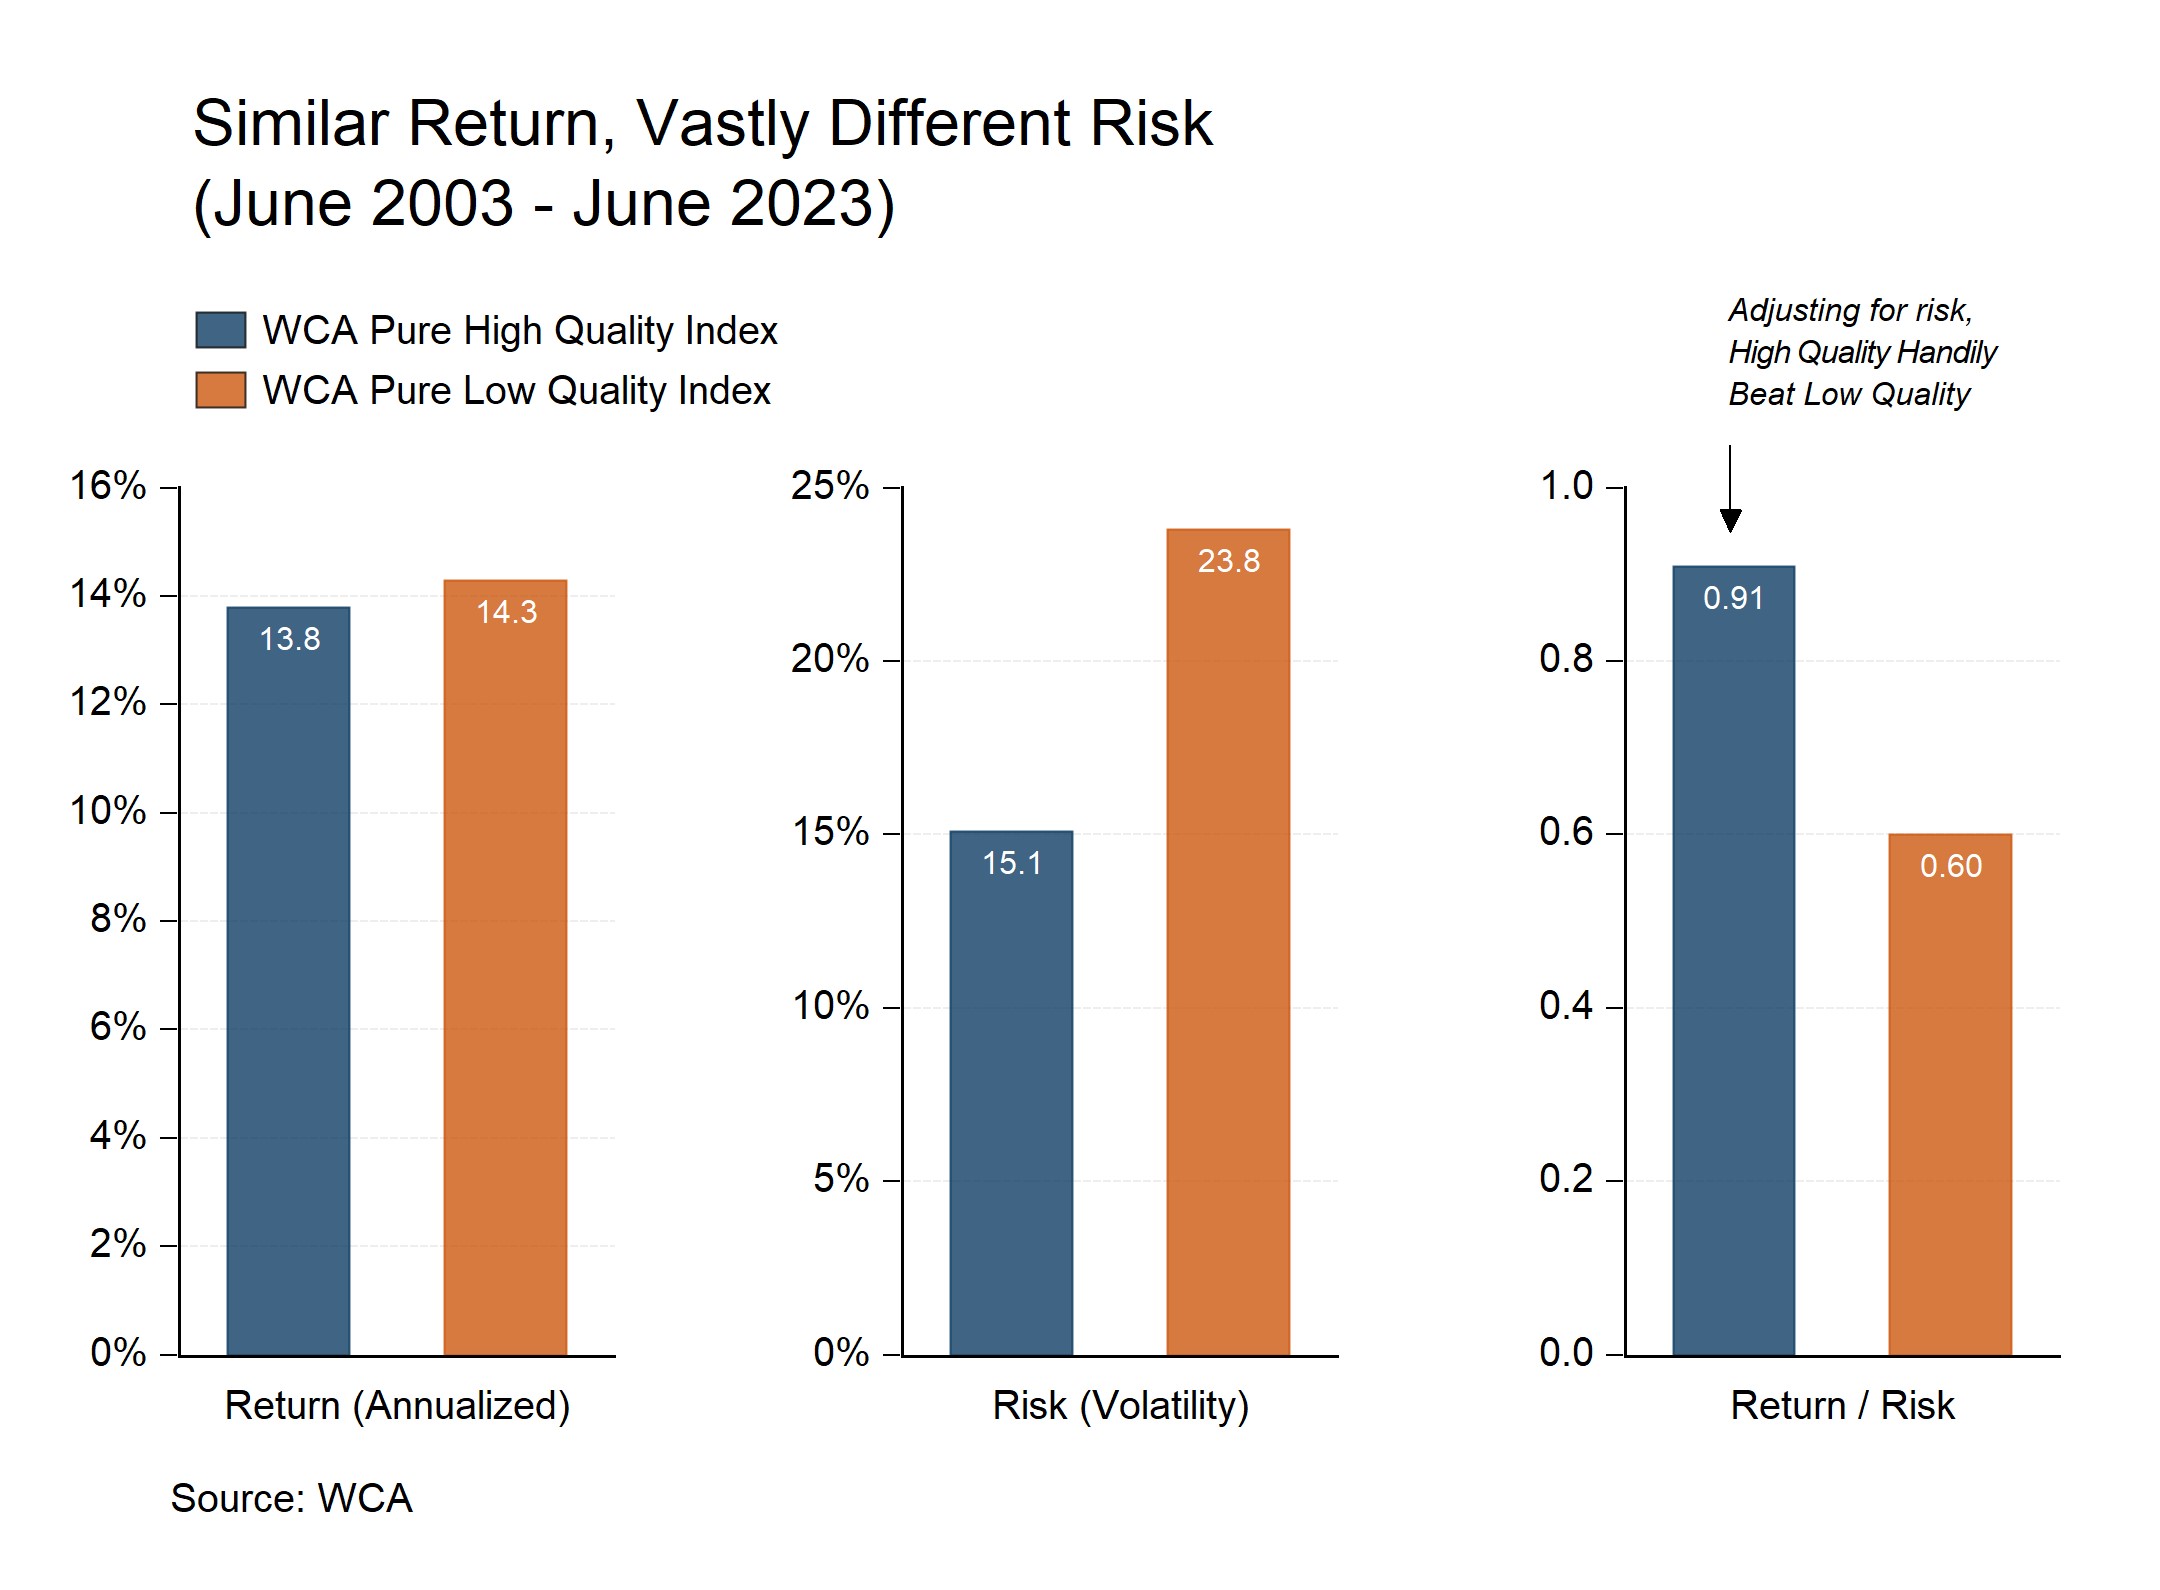
Chart B (below) shows the return, risk, and return-to-risk ratio for high and low-quality stocks over the past 20 years. While returns were similar, the risk of holding low-quality companies was far higher. Thus, after adjusting for risk, a strong argument can be made for the steadier high-quality approach.
Chart B
“Quality” and “Value”
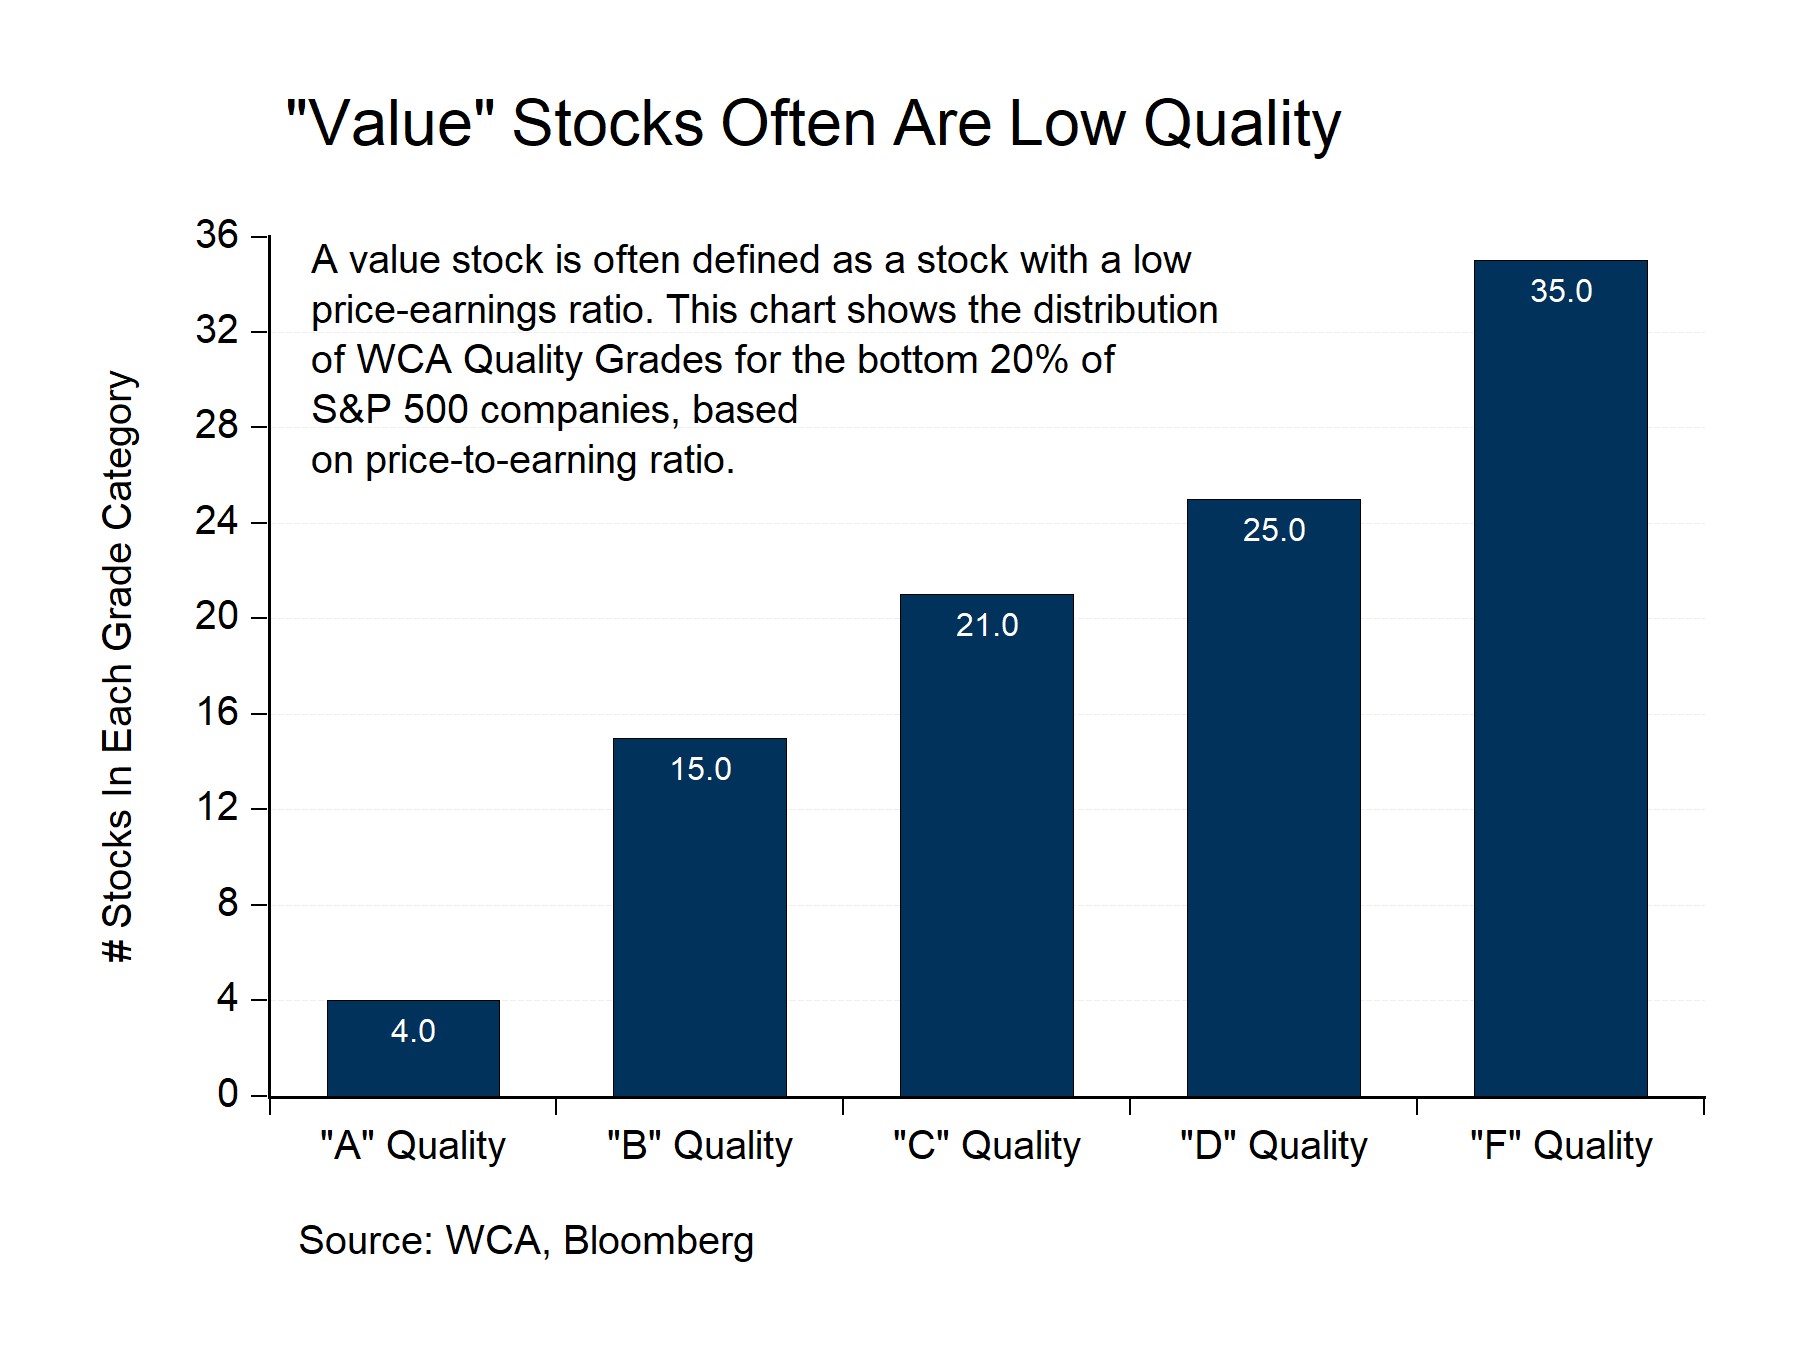
Value investors often refer to low price-to-earnings stocks as a way to find “value.” Here, such an approach also leads to higher volatility and exposure to unintended risks. To demonstrate, we gathered the lowest 20% of S&P 500 companies by price-to-earnings and grouped them by our quality grades. The chart below reveals that these “value” stocks skew toward the “D” and “F” quality grades (Chart C, below).
Chart C
Since markets tend to consider risk in assigning values, we are unsurprised that “cheap” stocks are also relatively poor quality. Low price-to-earnings “value” stocks tend to have less profitable assets, more debt, and more erratic earnings. Moreover, an analysis of the performance of low-price-earnings stocks to a set of macro factors reveals that low multiple stocks struggle when credit risk rises, liquidity fades, or the dollar strengthens.
However, low multiples (aka. “value stocks”) tend to convey a benefit from rising interest rates. This makes sense because low multiples suggest more of a stock’s present value comes from near-term earnings. Higher multiple stocks (aka. “growth stocks”) tend to rely more on far-off earnings to justify valuations. When interest rates rise, those longer-duration earnings shrink more in terms of present value. Therefore, lower-multiple stocks tend to be less vulnerable to rising rates.
By the way, most people would call low multiple stocks “value” and high multiple stocks “growth.” We have gone to great lengths to avoid such labels. For more about our view on problems in using these labels please see commentary “Asking Better Questions.”
Conclusion
The cycle which benefitted lower-quality stocks has run its course. While easy money helped lift lower-quality shares, and rising rates provided a relative advantage to “low-multiple” / “low-quality” stocks, we think these conditions are changing. The 10% outperformance of high-quality versus low-quality since early March indicates a shift in market risk appraisal.
Should these trends continue, we are well positioned. Our portfolio strategy is firmly rooted in pursuing quality at reasonable prices. Therefore, the fading of the low-quality rally of 2020-2023 is okay as far as we are concerned.