Monday Morning Minute
WASHINGTON CROSSING ADVISORS
THE WEEK AHEAD
A relatively quiet week for economic data, but new records on the Dow and S&P 500 have us thinking again about the “big picture.”
MACROECONOMIC INSIGHT
With the Dow just surpassing 25,000 and the S&P 500 crossing 2,700 for the first time in history last week, we thought it makes sense to pause and take a step back. As we point out in our Viewpoint 2018, we see the growing economy as the key driver of the market’s record-breaking performance, and there is clear evidence that growth continues. However, we must also point out that valuations are above average for stocks and risk premia is low across most asset classes. According to FactSet Research, the forward-looking price-earnings multiple for the S&P 500 is 18.4x versus a 10-year average of 14.2x. Essentially, investors seem more willing to assume greater risk, believe in continued growth, and take a long-term view.
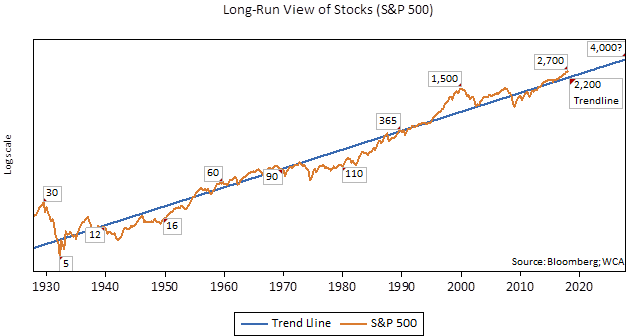
And most long-term investors have been right to think this way, even through past bear markets. The chart below, for example, shows a very long-run view of the S&P 500, a proxy for large capitalization stocks. As you can see, the market followed a generally rising trend for most of the last 90 years, despite periodic setbacks. After falling to a low near 5 in 1932, the index followed an uneven, but rising, trend through World War II, the boom years of the 1950s and 1960s, the inflation-plagued 1970s, and on into the 1980s and 1990s. After the technology-driven bull run of the 1990s ended, a great recession and financial crisis enveloped the world in 2007-2009. Since then, the market has experienced relatively steady returns underwritten by low-but-steady economic growth and tame inflation. Today, with the S&P 500 near 2,700, we are again on the north side of the long-run trend line.
Today’s higher stock values, along with low interest rates, are helping to lower the cost of funding for investment. The recently enacted tax changes should also help to lower the after-tax cost of investment capital and could further boost growth. Whatever the cause, the market pendulum appears to have again swung from pessimism to optimism. Because most of the data we track seems to point toward continued growth, we are more willing to accept the optimistic growth story for now. This does not mean, however, that we blindly accept valuations that make little sense, or ignore changes in the outlook when the facts on the ground change. Given the large advance in stocks, especially relative to bonds and cash, it is especially important to revisit a portfolio’s asset allocation and rebalance if the current mix of stocks and bonds, for example, has strayed too far from your intended mix. Just last week, we did exactly this in the asset allocation portfolios we manage.
What about the two points to the right of where we are today you ask? The first number (2,200) is simply a measure of where the S&P 500’s 1926-2017 trend-line currently sits. The 4,000 number is simply the level that the long-run trend line would reach ten years from now if the trajectory into the future remains the same as in the past. Neither one of these numbers is meant to be a forecast or prediction of any sort, but it does remind us of a couple relevant ideas as we start the new year. First, investors with a long-run time horizon should remember that short-term swings (both up and down) are a part of investing reality. A wide array of surprising events, both good and bad, have come and gone over the years, and very few were able to predict them at all. A second point is that markets do tend to have limits on both the upside and the downside which is why we believe that markets are ultimately (mostly) rational.
ECONOMIC DATA THIS WEEK
| Date | Report | Period | Survey | Prior |
| Monday, Jan 8: | No Economic Data | |||
| Tuesday, Jan 9: | JOLTS | Nov | — | 5.996M |
| Wednesday, Jan 10: | Import Prices M/M | Dec | — | 0.7% |
| Import Prices Y/Y | Dec | — | 3.1% | |
| Export Prices M/M | Dec | — | 0.5% | |
| Export Prices Y/Y | Dec | — | 3.1% | |
| Thursday, Jan 11: | Weekly Jobless Claims | 1/6 | — | 250K |
| PPI M/M | Dec | — | 0.4% | |
| PPI Ex Food & Energy M/M | Dec | — | 0.3% | |
| PPI Ex Food, Energy & Trade M/M | Dec | — | 0.4% | |
| PPI Y/Y | Dec | — | 3.1% | |
| PPI Ex Food & Energy Y/Y | Dec | — | 2.4% | |
| PPI Ex Food, Energy & Trade Y/Y | Dec | — | 2.4% | |
| Treasury Budget | Dec | — | -$138.5B | |
| Friday, Jan 12: | CPI M/M | Dec | — | 0.4% |
| CPI Ex Food & Energy M/M | Dec | — | 0.1% | |
| CPI Y/Y | Dec | — | 2.2% | |
| CPI Ex Food & Energy Y/Y | Dec | — | 1.7% | |
| Retail Sales M/M | Dec | — | 0.8% | |
| Retail Sales Ex Autos M/M | Dec | — | 1.0% | |
| Retail Sales Ex Auto & Gas M/M | Dec | — | 0.8% | |
| Business Inventories M/M | Nov | — | -0.1% | |
| Source: Bloomberg |
ASSET ALLOCATION PORTFOLIO POSTURE
Based on shorter-term expectations, the “tactical satellite” allocation within portfolios is:
Overweight Stocks vs. Bonds
Kevin Caron, CFA, Senior Portfolio Manager
Chad Morganlander, Senior Portfolio Manager
Matthew Battipaglia, Portfolio Manager
Suzanne Ashley, Analyst
www.washingtoncrossingadvisors.com
_______________________________________________________________________________________________________________________________________
Disclosures
WCA Fundamental Conditions Barometer Description: We regularly assess changes in fundamental conditions to help guide near-term asset allocation decisions. The analysis incorporates approximately 30 forward-looking indicators in categories ranging from Credit and Capital Markets to U.S. Economic Conditions and Foreign Conditions. From each category of data, we create three diffusion-style sub-indices that measure the trends in the underlying data. Sustained improvement that is spread across a wide variety of observations will produce index readings above 50 (potentially favoring stocks), while readings below 50 would indicate potential deterioration (potentially favoring bonds). The WCA Fundamental Conditions Index combines the three underlying categories into a single summary measure. This measure can be thought of as a “barometer” for changes in fundamental conditions.
The information contained herein has been prepared from sources believed to be reliable but is not guaranteed by us and is not a complete summary or statement of all available data, nor is it considered an offer to buy or sell any securities referred to herein. Opinions expressed are subject to change without notice and do not take into account the particular investment objectives, financial situation, or needs of individual investors. There is no guarantee that the figures or opinions forecasted in this report will be realized or achieved. Employees of Stifel, Nicolaus & Company, Incorporated or its affiliates may, at times, release written or oral commentary, technical analysis, or trading strategies that differ from the opinions expressed within. Past performance is no guarantee of future results. Indices are unmanaged, and you cannot invest directly in an index.
Asset allocation and diversification do not ensure a profit and may not protect against loss. There are special considerations associated with international investing, including the risk of currency fluctuations and political and economic events. Investing in emerging markets may involve greater risk and volatility than investing in more developed countries. Due to their narrow focus, sector-based investments typically exhibit greater volatility. Small company stocks are typically more volatile and carry additional risks, since smaller companies generally are not as well established as larger companies. Property values can fall due to environmental, economic, or other reasons, and changes in interest rates can negatively impact the performance of real estate companies. When investing in bonds, it is important to note that as interest rates rise, bond prices will fall. High-yield bonds have greater credit risk than higher-quality bonds. The risk of loss in trading commodities and futures can be substantial. You should therefore carefully consider whether such trading is suitable for you in light of your financial condition. The high degree of leverage that is often obtainable in commodity trading can work against you as well as for you. The use of leverage can lead to large losses as well as gains.
All investments involve risk, including loss of principal, and there is no guarantee that investment objectives will be met. It is important to review your investment objectives, risk tolerance and liquidity needs before choosing an investment style or manager. Equity investments are subject generally to market, market sector, market liquidity, issuer, and investment style risks, among other factors to varying degrees. Fixed Income investments are subject to market, market liquidity, issuer, investment style, interest rate, credit quality, and call risks, among other factors to varying degrees.
This commentary often expresses opinions about the direction of market, investment sector and other trends. The opinions should not be considered predictions of future results. The information contained in this report is based on sources believed to be reliable, but is not guaranteed and not necessarily complete.
The securities discussed in this material were selected due to recent changes in the strategies. This selection criteria is not based on any measurement of performance of the underlying security.
Washington Crossing Advisors LLC is a wholly owned subsidiary and affiliated SEC Registered Investment Adviser of Stifel Financial Corp (NYSE: SF).