Negative Surprise in Manufacturing Survey
Last week’s Chicago Purchasing Manager’s Survey Index (PMI) indicated significant weakness in manufacturing during the month of February. The index plunged from near 60 in January to 45.8 in February. The 14-point fall brought the index to below 50, a level that is generally associated with recession. Investors focus on the Chicago PMI because it is the first in a series of indicators that describe the health of the cyclical manufacturing sector. Today, we will get a look at the much broader Institute for Supply Management’s (ISM) Manufacturing Survey Index. Purchasing managers’ reports are interesting because they are on the front lines of business and have a good feel for the ebbs and flows of business. Since there is a fairly high correlation between the Chicago Purchasing Managers’ Survey Index and the Institute for Supply Management’s Index, it is likely that today’s ISM report will disappoint.
We are mindful that one month’s number does not a trend make. Tough winter weather and the California dockworkers’ strike likely had a negative impact on last week’s Chicago Purchasing Manager’s Survey Index. The energy industry’s recent struggles are a part of the story, too. One way to frame this is to look at how a broader set of economic and market data are progressing.
We have noticed in recent months that bonds have done better than stocks, spreads in the corporate bond market have widened, earnings forecasts are being trimmed, and inflation forecasts remain below 2%. This and other observations are weighing negatively on our evaluation of fundamental trends. Moreover, it was reported that overall growth in the economy was revised down to 2.2% in the last quarter of 2014 from a prior estimate of 2.6%. The 2.2% pace of growth in the fourth quarter was a sharp slowdown from the average 4.8% growth rate experienced during the March-September period.
Global growth is slower, too. Recently the International Monetary Fund lowered its forecast for global growth in 2015 and 2016, despite the sharp drop in oil prices, which should be a positive from the point of view of the consumer.
Despite all of this, the Federal Reserve Board (Fed) appears willing to move toward a tightening of policy in the months ahead. Janet Yellen recently indicated the Federal Open Market Committee could drop the word “patient” from their upcoming March guidance. In so doing, the Fed would no longer pledge to keep its policy rate at zero for at least the next two meetings, as was the prior interpretation of the “patient” language. Oddly, the move to tighten comes as inflation expectations priced into long-term Treasury bonds have fallen below the Fed’s 2% target, the Treasury yield curve have flattened as long-term rates fall, corporate bond yields have generally widened compared to Treasuries, and the U.S. dollar has been strong. These signals suggest the Fed should be looking to ease, rather than tighten, monetary policy. They also suggest that the Fed has great confidence that a pickup is just around the corner.
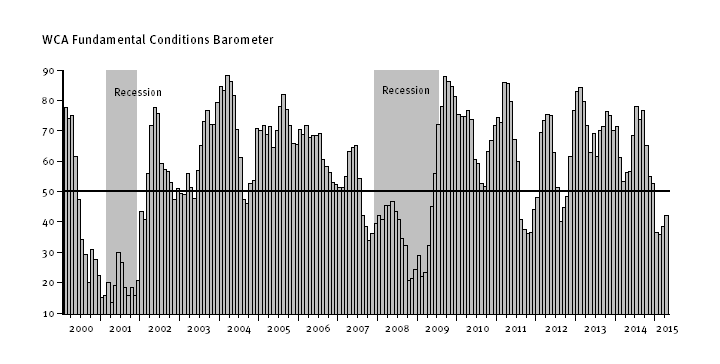
Each week, we incorporate new data into our view and are watching for signs of this pickup. So far, we have not seen that turn. Our WCA Fundamental Conditions Barometer has not yet turned positive and is in the 40-50 range (below). This week we will get new data on personal income and spending, manufacturing, and vehicle sales. Friday’s February employment report is likely to garner special attention, and expectations call for an increase of 245,000 net new jobs. Asset allocation portfolios are light on equity exposure compared to their benchmark, and we are emphasizing lower leveraged balance sheets, predictable and growing cash flow, steady profitability, and reasonable valuations across all equity portfolios.