Monday Morning Minute 111317
THE WEEK AHEAD
Producer, Consumer, Import, and Export prices are in focus this week as we recap third-quarter earnings and look down the road towards future earnings seasons.
MACROECONOMIC INSIGHT
According to FactSet, for the third quarter, companies have reported earnings growth of 5.9% and sales growth of 5.8%. In addition to these impressive gains, more companies are beating earnings per share and revenue estimates than average. For example:
Of the companies that have reported, 74% have reported EPS above the mean EPS estimate. That 74% figure is above both the 1-year (71%) and 5-year average (69%). At the sector level, Technology (90%) has the highest percentage of EPS beats, while Utilities (50%) and Telecom (50%) have the lowest.
Of the companies that have reported, 66% have reported revenue above the mean revenue estimate. That 66% figure is above both the 1-year (61%) and 5-year average (55%). At the sector level, Technology (81%) has the highest percentage of revenue beats, while Utilities (21%) has the lowest.
With regard to valuation, the forward 12-month P/E ratio is 18.0. This figure is above both the 5-year (15.7) and 10-year average (14.1). Since the start of the fourth quarter, the price of the S&P 500 index has increased by 2.4%, while the forward 12-month estimate has increased 1.1%.
See graph below.
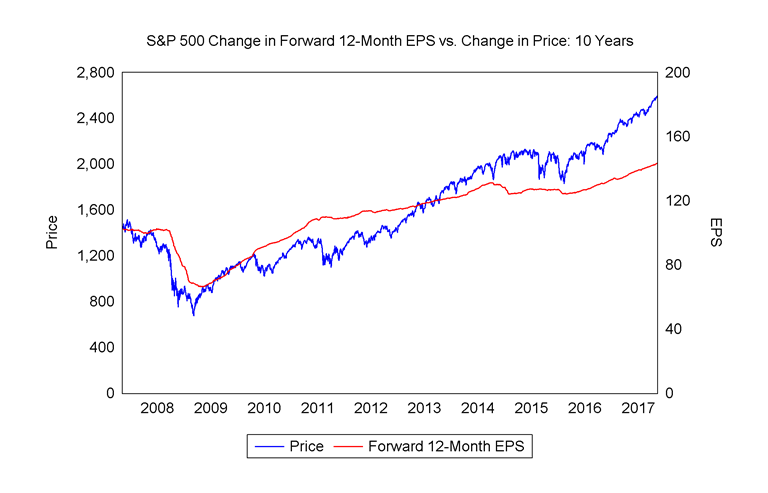
Source: FactSet
Looking into the future, the prospects for growth look promising. The street currently expects earnings to jump to double-digit levels well into next year:
4Q2017: earnings growth of 10.4%, revenue growth of 6.2%
CY2017: earnings growth of 9.5%, revenue growth of 6.1%
1Q2018: earnings growth of 10.6%, revenue growth of 6.4%
2Q2018: earnings growth of 10.2%, revenue growth of 6.3%
CY2018: earnings growth of 11.0%, revenue growth of 5.2%
If past is prologue we would expect next year’s forecasts to come down as actual results come in.
ECONOMIC DATA THIS WEEK
| Date | Report | Period | Survey | Prior |
| Monday, Nov 13: | No Economic Data | |||
| Tuesday, Nov 14: | PPI Final Demand M/M | Oct | 0.1% | 0.4% |
| PPI Ex Food and Energy M/M | Oct | 0.2% | 0.4% | |
| PPI Ex Food, Energy, Trade M/M | Oct | — | 0.2% | |
| PPI Final Demand Y/Y | Oct | 2.5% | 2.6% | |
| PPI Ex Food and Energy Y/Y | Oct | 2.2% | 2.2% | |
| PPI Ex Food, Energy. Trade Y/Y | Oct | — | 2.1% | |
| Wednesday, Nov 15: | CPI M/M | Oct | 0.1% | 0.5% |
| CPI Ex Food and Energy M/M | Oct | 0.2% | 0.1% | |
| CPI Y/Y | Oct | 2.0% | 2.2% | |
| CPI Ex Food and Energy Y/Y | Oct | 1.7% | 1.7% | |
| Retail Sales Advance M/M | Oct | 0.1% | 1.6% | |
| Retail Sales Ex Auto M/M | Oct | 0.2% | 1.0% | |
| Retail Sales Ex Auto and Gas | Oct | 0.3% | 0.5% | |
| Empire State Manufacturing Survey | Nov | 25.8 | 30.2 | |
| Business Inventories | Sep | 0.0% | 0.7% | |
| Thursday, Nov 16: | Weekly Jobless Claims | Nov 11 | — | 239K |
| Philadelphia Fed Business Outlook | Nov | 24.0 | 27.9 | |
| Industrial Production M/M | Oct | 0.5% | 0.3% | |
| Capacity Utilization | Oct | 76.3% | 76.0% | |
| Import Price Index M/M | Oct | 0.3% | 0.7% | |
| Import Price Index Y/Y | Oct | — | 2.7% | |
| Export Price Index M/M | Oct | 0.4% | 0.8% | |
| Export Price Index Y/Y | Oct | — | 2.9% | |
| NAHB Housing Market Index | Nov | 68 | 68 | |
| Friday, Nov 17: | Housing Starts M/M | Oct | 4.7% | -4.7% |
| Building Permits M/M | Oct | 1.1% | -4.5% | |
| Source: Bloomberg |
ASSET ALLOCATION PORTFOLIO POSTURE
Based on shorter-term expectations, the “tactical” allocation within portfolios is overweight stocks versus bonds.
Client approved reports and commentaries click here
Kevin Caron, CFA, Senior Portfolio Manager
Chad Morganlander, Senior Portfolio Manager
Matthew Battipaglia, Portfolio Manager
Suzanne Ashley, Analyst
(973) 549-4052 www.washingtoncrossingadvisors.com www.stifel.com
————————————————————————————————————————————————————————-
Disclosures
WCA Fundamental Conditions Barometer Description: We regularly assess changes in fundamental conditions to help guide near-term asset allocation decisions. The analysis incorporates approximately 30 forward-looking indicators in categories ranging from Credit and Capital Markets to U.S. Economic Conditions and Foreign Conditions. From each category of data, we create three diffusion-style sub-indices that measure the trends in the underlying data. Sustained improvement that is spread across a wide variety of observations will produce index readings above 50 (potentially favoring stocks), while readings below 50 would indicate potential deterioration (potentially favoring bonds). The WCA Fundamental Conditions Index combines the three underlying categories into a single summary measure. This measure can be thought of as a “barometer” for changes in fundamental conditions.
The information contained herein has been prepared from sources believed to be reliable but is not guaranteed by us and is not a complete summary or statement of all available data, nor is it considered an offer to buy or sell any securities referred to herein. Opinions expressed are subject to change without notice and do not take into account the particular investment objectives, financial situation, or needs of individual investors. There is no guarantee that the figures or opinions forecasted in this report will be realized or achieved. Employees of Stifel, Nicolaus & Company, Incorporated or its affiliates may, at times, release written or oral commentary, technical analysis, or trading strategies that differ from the opinions expressed within. Past performance is no guarantee of future results. Indices are unmanaged, and you cannot invest directly in an index.
Asset allocation and diversification do not ensure a profit and may not protect against loss. There are special considerations associated with international investing, including the risk of currency fluctuations and political and economic events. Investing in emerging markets may involve greater risk and volatility than investing in more developed countries. Due to their narrow focus, sector-based investments typically exhibit greater volatility. Small company stocks are typically more volatile and carry additional risks, since smaller companies generally are not as well established as larger companies. Property values can fall due to environmental, economic, or other reasons, and changes in interest rates can negatively impact the performance of real estate companies. When investing in bonds, it is important to note that as interest rates rise, bond prices will fall. High-yield bonds have greater credit risk than higher-quality bonds. The risk of loss in trading commodities and futures can be substantial. You should therefore carefully consider whether such trading is suitable for you in light of your financial condition. The high degree of leverage that is often obtainable in commodity trading can work against you as well as for you. The use of leverage can lead to large losses as well as gains.
All investments involve risk, including loss of principal, and there is no guarantee that investment objectives will be met. It is important to review your investment objectives, risk tolerance and liquidity needs before choosing an investment style or manager. Equity investments are subject generally to market, market sector, market liquidity, issuer, and investment style risks, among other factors to varying degrees. Fixed Income investments are subject to market, market liquidity, issuer, investment style, interest rate, credit quality, and call risks, among other factors to varying degrees.
This commentary often expresses opinions about the direction of market, investment sector and other trends. The opinions should not be considered predictions of future results. The information contained in this report is based on sources believed to be reliable, but is not guaranteed and not necessarily complete.
Washington Crossing Advisors LLC is a wholly owned subsidiary and affiliated SEC Registered Investment Adviser of Stifel Financial Corp (NYSE: SF).