Valuations Are Better, But Markets Are Not Out of the Woods
We believe the housing recession will continue for several
years yet. We estimate that home prices, on average,
may decline by as much as another 20-30%. The current
inventory of unsold homes and condominiums is far too great
and will take years to work off. Fundamental
imbalances in housing will trump government efforts to
re-inflate home values and loan availability will remain an
issue for some time to come. Therefore, we do not
expect a quick resolution to the national housing market's
woes.
Make no mistake about it. Housing problems have
definitely spilled over into the broader economy.
Since last year, the consumer has watched the value of their
largest asset fall; has had access to credit curtailed;
oftentimes has a large mortgage to pay; is plagued by
rising prices for goods and services; and is burdened by a
weak economy that is no longer creating net new jobs.
As a result, the economy will likely slog along in
recessionary-like conditions for several quarters to come.

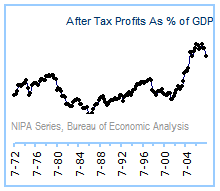
This then leads to, unfortunately, a profit contraction
which typically accompany recessions. We believe that
profits peaked in the third quarter last year. If so,
it is doubtful that we are near the bottom in profits, as
profits as a percent of GDP (see above) remain far above past peaks and
even garden-variety profit contractions generally last from
6-12 quarters. If we are on point about the economy
and profits did peak last year, we are only one quarter to
one half of the way through the profit slump.
Profit Recessions
|
Peak-Trough
Dates |
Duration
(Qtrs) |
Profit Drop (%) |
Market
Moved Higher... |
|
Q4'00-Q2'02 |
5 Qtrs |
-63% |
4
Qtrs Post-Trough |
|
Q3'89-Q2'92 |
11 Qtrs |
-36% |
5
Qtrs Pre-Trough |
|
Q1'85-Q3'87 |
10 Qtrs |
-15% |
5
Qtrs Pre-Trough |
|
Q4'74-Q4'75 |
4 Qtrs |
-18% |
3
Qtrs Pre-Trough |
|
Q4'69-Q2'71 |
6 Qtrs |
-15% |
5
Qtrs Pre-Trough |
|
Q3'66-Q2'67 |
3 Qtrs |
-12% |
3
Qtrs Pre-Trough |
|
Q2'60-Q2'61 |
4 Qtrs |
-14% |
4
Qtrs Post-Trough |
|
Average |
6 Qtrs |
-25% |
|
The good news is that the stock market doesn't typically
perform poorly all the way through the down-cycle in
profits. Normally, markets sense recovery halfway to
three-quarters of the way through the profit slide.
Therefore, if we assume that profit recovery commences
somewhere between the second half of 2009 and the second
half of 2010, then it would not be unreasonable to see the
stock market make a sustained move higher later this year or
sometime early next year. In the meantime, expect
markets to remain volatile.
One other bullish observation, despite the gloom over banks
and real estate, is that the S&P 500 is now roughly 3% below
the midpoint in our fair value range of 1,168 to 1,400.
While we could not justify higher values for stocks a year
ago, there is a chance that stocks now represent an
attractive value to investors under a set of conservative
assumptions. To get to this range, we use what is
commonly known as the "Fed Model." This model is one
equity valuation method that relies on relationships between
government bond yields and stock market earnings yields as
the basis for identifying when equity prices have become
relatively cheap or expensive. If the earnings yield
for the S&P 500, for example, is higher than Treasury bond
yields, then investors are likely being compensated properly
for assuming the risks of owning equities compared to bonds
and vice versa. While there are several inputs to the
model, key among them are expectations for earnings,
inflation priced into the bond market, and current interest
rates. At this time, we are using an
assumed $70.42 in fully diluted, net earnings and for the
S&P 500 over the next twelve months. This, coupled
with the current 4% 10-year government bond yield, assumed
range of equity risk premiums
of 3.5-4.5% over long-term Treasuries, and a 2.5% long-run inflation expectation
priced into the TIPS market, brings us to a fair value range
of 1,168 to 1,400. While the S&P 500 is trading near
1,250, the forward multiple on net earnings is near 18X.
The low end of our fair value range is at 16.5X, and the high
end of our fair value range is at 20X. While these
multiples may appear high, consider that they are based on
reported rather than operating earnings and remember that in
past cycles, earnings multiples usually expand during
profit contractions in anticipation of recovery.
"You're thinking of this place all wrong. As if I
had the money back in a safe. The money's not here. Your
money's in Joe's house..."
- George Bailey, It's
A Wonderful Life (1946)
Housing is not a sideshow issue to the economy. It is
the largest asset held by Americans and represents the
collateral that backstops the banking system. George
Bailey in the movie It's A Wonderful Life understood
the importance of housing, as the quote above suggests.
Since housing is so critical to the environment for banking,
we need to remain focused on how the housing market unfolds
and what that means for banks, credit creation, and the
economy.
The boom in home price appreciation over the past ten years
was unprecedented by historic standards. Over long
periods, home prices tend to rise in line with real GDP.
Consider that since 1948, American household real estate was
estimated to be worth $200 billion. By 1998, real estate was
estimated to be worth $9,200 billion. That is an 8%
annual appreciation in overall value. However, there
are always new contributions and additions to the housing
stock in the form of new construction. Such new construction
has averaged 5% of the existing value of home stocks over
our 60-year timeframe. By removing the 5% contribution of
new value from the 8% accretion of the overall value, that
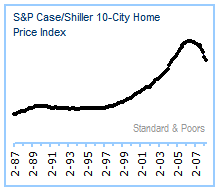
leaves 3% as a function of price appreciation. Price
appreciation, according to the S&P Case/Shiller 10-City Home
Price Index (below), was 12% per year in the decade leading up to the
peak in housing. Given that fact, it could be a long
time before housing reaches bottom. This is an
unpleasant reality, and one that need not sink the United
States economy, but it is meaningful, and markets are
right to be more risk averse in the face of ongoing
correction.

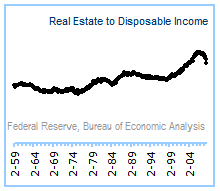
Not to beat a dead horse, but if we look at it another way,
we see that the ratio of real estate value ($19.7 trillion)
to disposable personal income ($11.1 trillion) peaked at 2
times and has fallen with home prices to a current level of
1.8. In the decade before the boom, a ratio of 1.2 to
1.4 times income was considered normal. A 20-30%
further reduction in valuations would put this ratio back in
line with this historic range.

We said we would monitor business follow-on response to
falling demand. To date, hiring activity has been limp
and layoffs have continued. The unemployment rate has
risen quickly to 5.5% as the fall in the number of people
working in the private sector has continued unabated since
November. These trends confirm our belief that the
U.S. economy has entered a recession.
Recovery from this downturn is likely to be subdued, in our
view, as leverage needs to be worked down in many parts of
the economy and banks need to be recapitalized. While
housing, profit, credit, and employment recovery should
eventually emerge, at this time we expect any resurgence to
be moderate. We also expect to see further tightening
of lending standards by banks as home prices soften and even GSE loans will become more difficult to finance, despite the
anticipated passage of a bill next week that would move
toward a more explicit government guarantee of that debt.
As an example of how leverage has increased, consider the
nation's debt as it relates to mortgages, housing, and
incomes. Between 1988 and 2008, for example, the ratio
of mortgage debt to income rose from 54% to 100% for U.S.
households in aggregate. Over the same period, mortgage debt
relative to home equity increased from 51% to 93%.
This leveraging process now must be reversed and will take
several years to work through, in our view. Therefore,
while the consumer should eventually be back, it could be
with a more moderate spending profile than the consumer that
drove the economy for the past two decades.
We are not as bearish as we had been a year ago, when risks
were on the rise but markets appeared oblivious to those
changes. Now, we are confronted with difficulties that
are large but not insurmountable over time.
Arguably, equity prices have become much more attractive
compared to bonds and commodities commensurate with one's
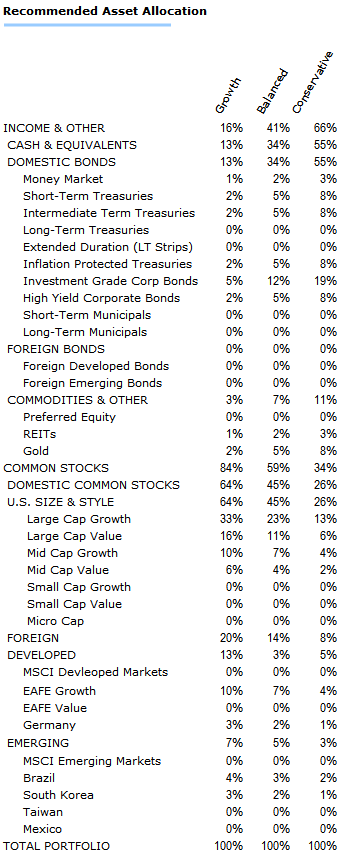
risk tolerance. Our portfolio posture continues to be
relatively defensive, with a focus on more liquid segments of
equity markets, an emphasis on growth over value, with a
diverse array of income-producing assets, including
government Treasuries, and even a small exposure to gold
bullion.

|
Past Commentaries
May 20, 2008
Buy the Dips
More
March 10, 2008
Investing During Recession
More
January 22, 2008
Global Sell-off
More
December 27, 2007
Outlook 2008
More
December 7, 2007
NBER President Raises Recession Concerns
More
November 28, 2007
Equity Risk Heightened - Allocation Remains Defensive
More
September 25, 2007
After the Rate Cut
More
July 30, 2007
The Case For Growth
More
June 15, 2007
Data Affirms Tactical Asset Allocation Posture
More
March 19, 2007
Cutting Earnings And Equity Target
More
| |
To unsubscribe, please click here.
Company Name, Address and Contact Details
The information contained herein has been prepared from sources believed to be
reliable but is not guaranteed by us and is not a complete summary or statement
of all available data, nor is it considered an offer to buy or sell any
securities referred to herein. Opinions expressed are subject to change without
notice and do not take into account the particular investment objectives,
financial situation, or needs of individual investors. There is no guarantee
that the figures or opinions forecasted in this report will be realized or
achieved. Employees of Stifel, Nicolaus & Company, Incorporated or its
affiliates may, at times, release written or oral commentary, technical
analysis, or trading strategies that differ from the opinions expressed within.
Past performance is no guarantee of future results. There are special
considerations associated with international investing, including the risk of
currency fluctuations and political and economic events. Investing in emerging
markets may involve greater risk and volatility than investing in more developed
countries. Due to their narrow focus, sector-based investments typically exhibit
greater volatility. Small company stocks are typically more volatile and carry
additional risks, since smaller companies generally are not as well established
as larger companies. Property values can fall due to environmental, economic, or
other reasons, and changes in interest rates can negatively impact the
performance of real estate companies. When investing in bonds, it is important
to note that as interest rates rise, bond prices will fall. High-yield bonds
have greater credit risk than higher quality bonds. The risk of loss in trading
commodities and futures can be substantial. You should therefore carefully
consider whether such trading is suitable for you in light of your financial
condition. The high degree of leverage that is often obtainable in commodity
trading can work against you as well as for you. The use of leverage can lead to
large losses as well as gains. Indices are unmanaged, and you cannot invest
directly in an index.
Stifel, Nicolaus & Company, Incorporated | Member SIPC & NYSE |
www.stifel.com |